Lung Volumes and Emphysema in Smokers with Interstitial Lung Abnormalities
11
0
0
Texto completo
(2) The. n e w e ng l a n d j o u r na l. T. he relationship between exposure to tobacco smoke and chronic obstructive pulmonary disease (COPD) is well described.1 Two manifestations of COPD include emphysematous destruction of the lung parenchyma and elevated measures of total lung capacity.2 However, there is increasing awareness that smoking may also result in areas of increased lung density — termed interstitial lung abnormalities — on high-resolution computed tomography (HRCT).3,4 The extent to which interstitial lung abnormalities may be associated with a lesser amount of emphysema and lower measures of total lung capacity than anticipated on the basis of known smoking exposure is unclear. We determined the relationship between radiographic interstitial lung abnormalities and HRCT measures of total lung capacity and emphysema in a cohort of non-Hispanic white and black smokers who had been recruited for the COPDGene Study on the basis of a self-reported history of more than 10 pack-years of smoking. Since we oversampled participants on the basis of COPD status,5 we evaluated whether the associations between interstitial lung abnormalities and both total lung capacity and emphysema were modified by COPD status.. Me thods Study Design. From November 2007 through April 2010, a total of 2508 smokers (1867 [74%] non-Hispanic white and 641 [26%] black) between the ages of 45 and 80 years with a history of at least 10 pack-years were enrolled at 21 clinical centers under the auspices of the COPDGene Study, which is ongoing and has been described previously.4,5 Participants with a history of any active lung disease other than asthma, emphysema, or COPD were excluded from the study. Spirometry was performed in accordance with the recommendations of the American Thoracic Society and the European Respiratory Society.6 HRCT was performed at full inspiration and at relaxed exhalation. Quantitative measures of total lung capacity and emphysema were performed with the Airway Inspector (a free, open-source tool used for CT-based image analysis; available at www.airwayinspector.org). The COPDGene Study was approved by the institutional review boards of all participating centers, and all participants provided written informed 898. n engl j med 364;10. of. m e dic i n e. consent. A detailed description of the study methods appears in the Supplementary Appendix, available with the full text of this article at NEJM.org. Visual HRCT Analysis. We divided the visual HRCT analysis into two stages. In stage 1, HRCT scans were evaluated by three readers (two chest radiologists and one pulmonologist) with the use of a sequential reading method, as previously described.4 Interstitial lung abnormalities were defined as nondependent changes affecting more than 5% of any lung zone and included nondependent ground-glass or reticular abnormalities, diffuse centrilobular nodularity, nonemphysematous cysts, honeycombing, and traction bronchiectasis (Fig. 1).7,8 Focal or unilateral ground-glass attenuation, focal or unilateral reticulation, and patchy ground-glass abnormalities (present in <5% of the lung) were considered to be indeterminate findings. The fraction of the lung that met the criteria for radiographic emphysema was not included in the estimation of interstitial lung abnormalities. In stage 2 of the visual HRCT analysis, we divided the participants with interstitial lung abnormalities into four major radiographic subtypes: predominant centrilobular or peribronchial ground-glass opacities sparing the peripheral lung parenchyma (Fig. 1A); reticular, nodular, or ground-glass opacities in a predominantly subpleural distribution (Fig. 1B); mixed centrilobular and subpleural abnormalities (Fig. 1C); and extensive radiographic changes consistent with firm radiographic evidence of interstitial lung disease according to the guidelines of the American Thoracic and European Respiratory Societies9 (Fig. 1D). Participants with interstitial lung abnormalities were divided into these four radiographic groups on the basis of the consensus opinion of the three readers, who were unaware of each participant’s clinical characteristics. Statistical Analysis. Total lung capacity was evaluated as both a continuous variable (in liters and as the percent of the predicted value10) and as a binary variable (<80% or 80% of the predicted value11). Lung volume at relaxed exhalation was evaluated as a continuous variable (in liters). The percentage of the lung that was emphysematous was evaluated as a continuous variable (defined by a threshold of both -950 Hounsfield units12 and -910 Houns. nejm.org. march 10, 2011.
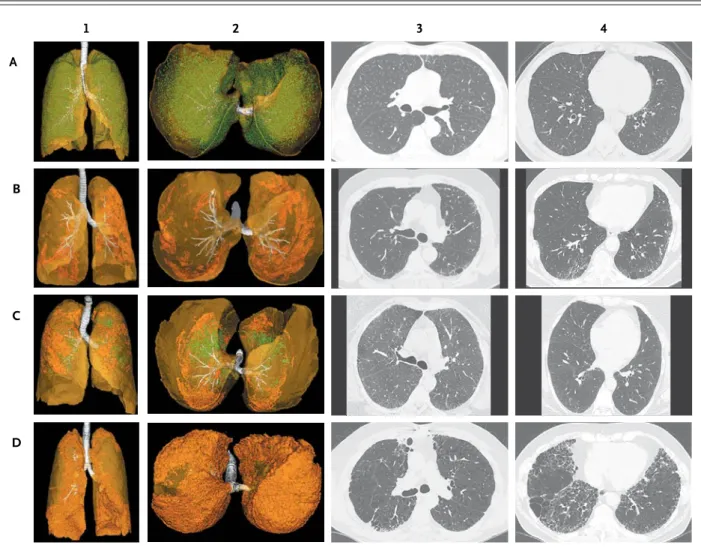
(3) R adiogr aphic Interstitial Lung Abnormalities in Smokers. 1. 2. 3. 4. A. B. C. D. Figure 1. Four Major Radiographic Subtypes of Interstitial Lung Abnormalities. Each row of radiographs and reconstructions represents from a single studyRETAKE: participant.1stThe images in Panel A are characteristic AUTHOR: Washko data (Rosas) 2nd Panel C, mixed centrilobular and subof centrilobular interstitial lung abnormalities; Panel B, subpleural interstitial lung abnormalities; FIGURE: 1 of 2 3rd pleural interstitial lung abnormalities; and Panel D, radiographic interstitial lung disease. The images in the first two columns are threeRevised dimensional reconstructions of an anterior-to-posterior view of the lungs (column 1) and a caudal-to-cephalad view (column 2). The ARTIST: ts SIZE translucent yellow–green represents the lung parenchyma; white, the tracheobronchial7tree; col opaque green, centrilobular opacities; and Combo 4-C H/T TYPE: Line 36p6 opaque orange, subpleural abnormalities. Columns 3 and 4 present axial high-resolution computed tomographic images of the chest, with images in column 3 approximately at the level of theAUTHOR, carina and those in column 4 approximately at the level of the right inferior PLEASE NOTE: Figure has been redrawn and type has been reset. pulmonary vein. Please check carefully.. JOB: 36410. ISSUE: 03-10-11. field units13). We defined COPD as a binary variable in accordance with the criteria of the Global Initiative for Chronic Obstructive Lung Disease (GOLD) for disease at stage 2 or higher.14 Bivariate analyses were conducted with Fisher’s exact test (for categorical variables) and two-tailed t-tests or the Wilcoxon rank-sum test (for continuous variables) as appropriate. Linear regression models were used for continuous variables and logistic-regression models for binary variables in multivariate analyses. All of the final multivari-. n engl j med 364;10. ate models included the variables for age, sex, race, body-mass index (BMI), pack-years of smoking, smoking status (former vs. current smoker), diagnosis of COPD (defined as GOLD stage 2 or higher14), and additional covariates as described below. We oversampled participants on the basis of COPD status5 and performed interaction tests to evaluate whether COPD status modified the associations between interstitial lung abnormalities and both total lung capacity and emphysema. P values of less than 0.05 were considered to in-. nejm.org. march 10, 2011. 899.
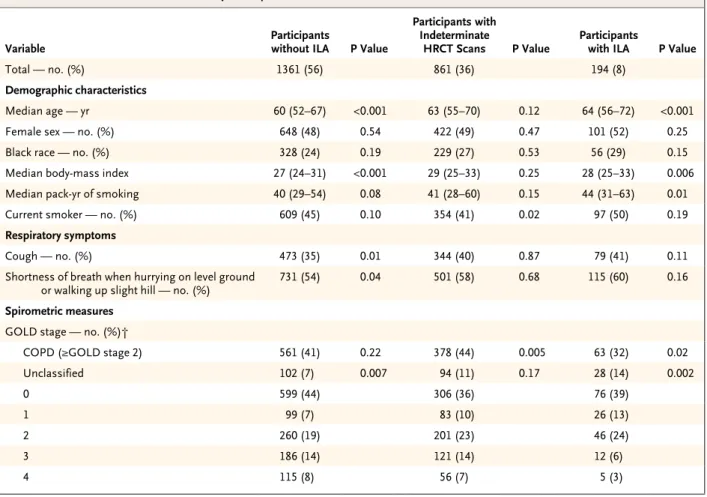
(4) The. n e w e ng l a n d j o u r na l. of. m e dic i n e. dicate statistical significance. All analyses were indeterminate reading; discrepancies in the inperformed with the use of SAS software, version terpretation of HRCT scans with respect to the 9.1 (SAS Institute). presence or absence of interstitial lung abnormalities were less common (12 scans [2%]). Baseline characteristics of study participants R e sult s in whom interstitial lung abnormalities were Characteristics of the Study Participants detected, those in whom interstitial lung abnorOf the 2508 participants originally recruited, malities were not detected, and those for whom 2416 (96%) had an HRCT scan available and were the diagnosis was indeterminate are shown in included in this analysis. Of these 2416 partici- Table 1 and in Table E1 in the Supplementary Appants, 1171 (48%) were women, 613 (25%) were pendix. As compared with participants without black, 1060 (44%) were active smokers, and 1002 interstitial lung abnormalities, those with inter(41%) met the GOLD criteria for COPD. Of the stitial lung abnormalities were significantly old2416 HRCT scans evaluated, 194 (8%) showed er, had a higher BMI, and had a greater amount interstitial lung abnormalities, 861 (36%) were of exposure to tobacco smoke. Both HRCT meaindeterminate, and 1361 (56%) did not show in- surements of total lung capacity and lung volume terstitial lung abnormalities (Table 1 and Fig. at relaxed exhalation were lower in participants 2A). Of the 1421 HRCT scans scored by at least with interstitial lung abnormalities. In addition, two readers (in stage 1 of the visual HRCT analy- participants with interstitial lung abnormalities sis), 899 (63%) had concordant scores. Among were less likely to have COPD, were more likely the 522 scans for which the evaluations were not to have spirometric measurements that could not concordant, a majority (510 [98%]) involved one be classified according to the GOLD criteria for Table 1. Baseline Characteristics of the Study Participants.*. Variable Total — no. (%). Participants without ILA. P Value. 1361 (56). Participants with Indeterminate HRCT Scans. P Value. 861 (36). Participants with ILA. P Value. 194 (8). Demographic characteristics Median age — yr. 60 (52–67). <0.001. 63 (55–70). 0.12. 64 (56–72). <0.001. Female sex — no. (%). 648 (48). 0.54. 422 (49). 0.47. 101 (52). 0.25. Black race — no. (%). 328 (24). 0.19. 229 (27). 0.53. 56 (29). 0.15. Median body-mass index. 27 (24–31). <0.001. 29 (25–33). 0.25. 28 (25–33). 0.006. Median pack-yr of smoking. 40 (29–54). 0.08. 41 (28–60). 0.15. 44 (31–63). 0.01. Current smoker — no. (%). 609 (45). 0.10. 354 (41). 0.02. 97 (50). 0.19. Cough — no. (%). 473 (35). 0.01. 344 (40). 0.87. 79 (41). 0.11. Shortness of breath when hurrying on level ground or walking up slight hill — no. (%). 731 (54). 0.04. 501 (58). 0.68. 115 (60). 0.16. COPD (≥GOLD stage 2). 561 (41). 0.22. 378 (44). 0.005. 63 (32). 0.02. Unclassified. 102 (7). 0.007. 94 (11). 0.17. 28 (14). 0.002. 0. 599 (44). 306 (36). 76 (39). 1. 99 (7). 83 (10). 26 (13). 2. 260 (19). 201 (23). 46 (24). 3. 186 (14). 121 (14). 12 (6). 4. 115 (8). 56 (7). 5 (3). Respiratory symptoms. Spirometric measures GOLD stage — no. (%)†. 900. n engl j med 364;10. nejm.org. march 10, 2011.
(5) R adiogr aphic Interstitial Lung Abnormalities in Smokers. Table 1. (Continued.). Variable. Participants without ILA. P Value. Participants with Indeterminate HRCT Scans. P Value. Participants with ILA. P Value. Median FEV1 — % of predicted‡. 80 (52–97). 0.02. 77 (55–92). 0.03. 82 (67–93). 0.15. Median FVC — % of predicted‡. 88 (75–100). 0.08. 87 (74–99). 0.30. 88 (77–98). 0.80. Median FEV1:FVC %‡. 70 (51–79). 0.04. 68 (53–76). 0.01. 71 (61–77). 0.32. 414 (30). 0.82. 266 (31). 0.004. 81 (42). 0.002. −950 HU. 4.1 (1.3–12.4). <0.001. 3.3 (0.9–9.7). <0.001. 2.2 (0.7–6.0). <0.001. −910 HU. 30 (15–47). <0.001. 23 (10–41). <0.001. 14 (7–29). <0.001. 5.21 (4.38–6.27). 0.08. 5.02 (4.15–5.96). <0.001. Spirometric restriction — no. (%)§ Chest CT findings Median % emphysema¶║. Total lung capacity‖ Median volume at full inspiration — liters Median % of predicted value. 5.70 (4.80–6.78) <0.001 107 (92–120). <0.001. 100 (84–112). 0.04. 95 (81–109). <0.001. 134 (10). <0.001. 169 (20). 0.77. 40 (21). <0.001. 3.13 (2.51–3.98). 0.06. 3.04 (2.48–3.84). <0.001. 2.67 (2.23–3.44). <0.001. <80% of predicted value — no. (%) Median lung volume at relaxed exhalation — liters. * The body-mass index is the weight in kilograms divided by the square of the height in meters. Race was self-reported. Data with respect to chronic obstructive pulmonary disease (COPD) and pulmonary-function testing are missing for 1 participant, data on information about respiratory symptoms are missing for 13 participants, data on percentage of emphysema defined by lung-attenuation thresholds of −950 Hounsfield units (HU) are missing for 1 participant and data on percentage of emphysema defined by lung-attenuation thresholds of −910 HU are missing for 51 participants, data on total lung capacity are missing for 19 participants, and data on lung volume at relaxed exhalation are missing for 195 participants. The interquartile range is shown in parentheses for median values. The first column of P values is for the comparison between participants without interstitial lung abnormalities (ILA) and those with findings classified as indeterminate, the second column of P values is for the comparison between participants with findings classified as indeterminate and those with ILA, and the third column of P values is for the comparison between participants without ILA and those with ILA. P values were calculated with Fisher’s exact test for binary variables and with paired t-tests or Wilcoxon rank-sum tests for continuous variables, as appropriate. FEV1 denotes forced expiratory volume in 1 second, FVC forced vital capacity, GOLD Global Initiative for Chronic Obstructive Lung Disease, and HRCT high-resolution computed tomography. † GOLD stages are defined as follows: unclassified (FEV1:FVC ≥0.70, FEV1 <80% of predicted value), GOLD stage 0 (FEV1:FVC ≥0.70, FEV1 ≥80% of predicted value), GOLD stage 1 (FEV1:FVC <0.70, FEV1 ≥80% of predicted value), GOLD stage 2 (FEV1:FVC <0.70, FEV1 <80% but ≥50% of predicted value), GOLD stage 3 (FEV1:FVC <0.70, FEV1 <50% but ≥30% of predicted value), and GOLD stage 4 (FEV1:FVC <0.70, FEV1 ≤30% of predicted value). P values represent the likelihood that participants are unclassified according to GOLD (an FEV1 ≤80% of predicted value and an FEV1:FVC >0.70) as compared with all other stages. ‡ Postbronchodilator measurements of pulmonary function are presented. The predicted values for FEV1 and FVC are derived from Crapo et al.15 § Spirometric restriction is defined as an FVC below the lower limit of normal and an FEV1:FVC ratio above the lower limit of normal.16 ¶ Quantitative metrics of emphysema, total lung capacity, and lung volume at relaxed exhalation were performed with Airway Inspector (www .airwayinspector.org) for each inspiratory (emphysema and total lung capacity) and expiratory (lung volume at relaxed exhalation) HRCT. ‖ Percent of predicted total lung capacity was calculated in accordance with guidelines from the American Thoracic Society and European Respiratory Society.10. COPD (forced expiratory volume in 1 second [FEV1], ≤80% of the predicted value; ratio of FEV1 to forced vital capacity [FVC], >0.7), and were more likely to have a lower percentage of emphysema. Although there was an increased frequency of spirometric restriction in participants with interstitial lung abnormalities, the absence of an association with other baseline spirometric measures and the broad distribution of participants with interstitial lung abnormalities on a plot of FEV1 (as a percentage of the predicted value) against the ratio of FEV1 to FVC suggest that spin engl j med 364;10. rometry alone is not helpful in classifying interstitial lung abnormalities (Fig. 2B, and Fig. E1 and Table E2 in the Supplementary Appendix). Total Lung Capacity and Restrictive Lung Deficit. In adjusted models, the HRCT scans for participants with interstitial lung abnormalities, as compared with the scans for participants without such abnormalities, revealed evidence of reduced total lung capacity (Table 2 and Fig. 2C). Similarly, participants with interstitial lung abnor-. nejm.org. march 10, 2011. 901.
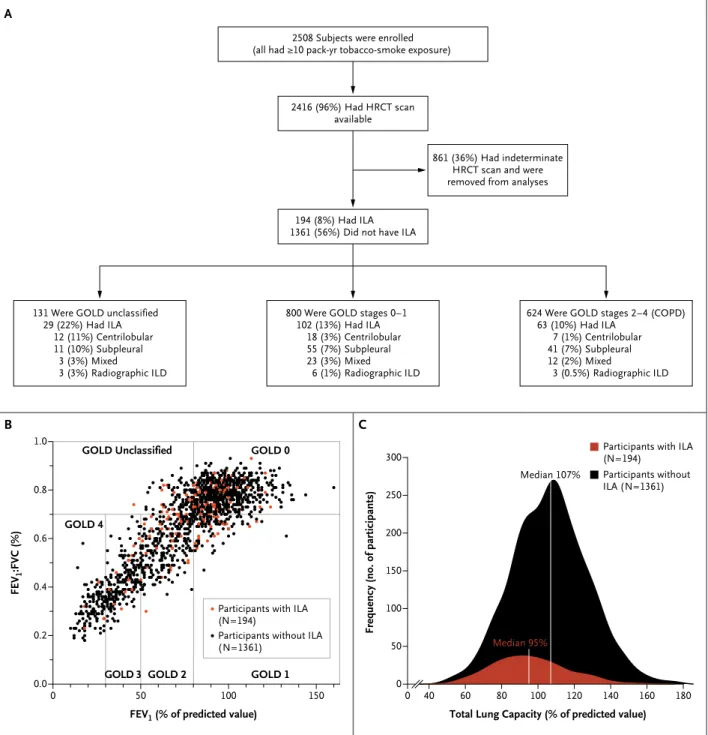
(6) The. n e w e ng l a n d j o u r na l. of. m e dic i n e. A 2508 Subjects were enrolled (all had ≥10 pack-yr tobacco-smoke exposure). 2416 (96%) Had HRCT scan available. 861 (36%) Had indeterminate HRCT scan and were removed from analyses. 194 (8%) Had ILA 1361 (56%) Did not have ILA. 131 Were GOLD unclassified 29 (22%) Had ILA 12 (11%) Centrilobular 11 (10%) Subpleural 3 (3%) Mixed 3 (3%) Radiographic ILD. 800 Were GOLD stages 0–1 102 (13%) Had ILA 18 (3%) Centrilobular 55 (7%) Subpleural 23 (3%) Mixed 6 (1%) Radiographic ILD. B. 624 Were GOLD stages 2–4 (COPD) 63 (10%) Had ILA 7 (1%) Centrilobular 41 (7%) Subpleural 12 (2%) Mixed 3 (0.5%) Radiographic ILD. C 1.0. GOLD Unclassified. GOLD 0. Participants with ILA (N=194). 300. FEV1:FVC (%). GOLD 4 0.6. 0.4 Participants with ILA (N=194) Participants without ILA (N=1361). 0.2. 0.0. GOLD 3 GOLD 2 0. 50. Frequency (no. of participants). Median 107% 0.8. GOLD 1 100. 150. 250. Participants without ILA (N=1361). 200 150 100 Median 95%. 50 0. 0. 40. FEV1 (% of predicted value). 60. 80. 100. 120. 140. 160. 180. Total Lung Capacity (% of predicted value). Figure 2. Study Enrollment and Findings. Panel A divides the study participants into three groups according to the classifications established by the Global Initiative for Chronic Obstructive Lung Disease (GOLD). Each group is then broken down according to the subtype of interstitial lung abnormalities (ILA). Patients who could not be classified according to the GOLD criteria had a forced expiratory volume in 1 second (FEV1) that was less than or equal to 80% of the predicted value and a ratio of FEV1 to forced vital capacity (FVC) that was greater than or equal to 0.7. Those patients meeting the criteria for GOLD stages 0 to 1 had an FEV1 that was 80% or more of the predicted value, and those meeting the criteria for GOLD stages 2 through 4 had an FEV1 of less than 80% and a ratio of FEV1 to FVC of less than 0.7.14 Panel B shows FEV1 (percent of predicted value) plotted against the FEV1:FVC (percent of predicted value) for participants with and those without ILA and classifies participants according to the GOLD criteria.14 Panel C is a frequency plot of total lung capacity as a percent of the predicted value10 in participants with and those without ILA. ILD denotes interstitial lung disease.. 902. n engl j med 364;10. nejm.org. march 10, 2011.
(7) n engl j med 364;10. −3 (−4 to −2) −9 (−11 to −6). <0.001 2.29 (1.43 to 3.68) <0.001 <0.001 −0.444 (−0.596 to −0.292) Adjusted§. * Percent of predicted total lung capacity was calculated in accordance with guidelines from the American Thoracic and European Respiratory Societies.10 CE denotes coefficient estimate, HU Hounsfield units, OR odds ratio, and TLC total lung capacity. † Percentage of emphysema is defined by lung-attenuation thresholds of −950 or −910 HU. ‡ COPD was defined as Global Initiative for Chronic Obstructive Lung Disease (GOLD) stage 2 or higher. § All multivariate models were adjusted for age, sex, race, body-mass index, pack-years of smoking, current smoking status, and status with respect to COPD (except in the model for COPD status). Analyses for TLC, TLC as a percent of predicted value, and emphysema (at both −950 and −910 HU) are the result of multivariate linear regression models. Analyses for TLC at less than 80% of predicted value and COPD are the result of multivariate logistic-regression models.. <0.001 0.53 (0.37 to 0.76) <0.001 −10 (−12 to −8). −13 (−16 to −10) −4 (−6 to 3) <0.001 −11 (−14 to −8) <0.001 2.38 (1.61 to 3.51) <0.001 −0.655 (−0.869 to −0.441) Unadjusted. <0.001. march 10, 2011. <0.001. 0.02 <0.001 0.69 (0.50 to 0.95). OR (95% CI) P value CE (95% CI) P value CE (95% CI) P value OR (95% CI) P value liters. CE (95% CI). P value. CE (95% CI). % Emphysema, −910 HU† <80% of Predicted TLC. % Emphysema, −950 HU†. Obstructive Lung Disease. COPD‡. nejm.org. % of Predicted TLC. In analyses stratified according to COPD status, interstitial lung abnormalities were associated with reduced total lung capacity in participants with COPD (-12% of the predicted value; 95% CI, -17 to -8; P<0.001) and in those without COPD (-7% of the predicted value; 95% CI, -10 to -4; P<0.001); the magnitude of the reduction in total lung capacity was greater in participants with COPD (P = 0.01 for the interaction between COPD and interstitial lung abnormalities). Findings were similar for emphysema — the magnitude of the reduction in emphysema was greater in participants with COPD (at -950 Hounsfield units, -7%; 95% CI, -10 to -4, P<0.001) than in those without COPD (defined by a threshold of -950 Houns field units, -0.6%; 95% CI, -1.3 to 0.1; P = 0.08; P<0.001 for the interaction between COPD and interstitial lung abnormalities). After adjustment for the extent of emphysema, the reductions in total lung capacity were similar between participants with COPD (-7% of the predicted value; 95% CI, -11 to -4; P<0.001) and those without COPD (-6% of the predicted value; 95% CI, -9 to -3; P<0.001). This suggests that in participants with COPD, interstitial lung abnormalities are associated with a reduction in total lung capacity that can be explained by the contributions of both a restrictive lung deficit and an additional reduction in the physiological burden of emphysema (e.g., reduced gas trapping leading to lower lung volumes).. Restrictive Lung Disease. Effects of COPD. TLC. Interstitial lung abnormalities were associated with a lower percentage of emphysema (at -950 and -910 Hounsfield units) in adjusted models (Table 2). Participants with interstitial lung abnormalities had a 47% decrease in their odds of having COPD (Table 2); the strength of this association was influenced by GOLD stage (P for the analysis of variance between GOLD stages 2 through 4 and interstitial lung abnormalities <0.001).. Analysis. Emphysema and COPD. Table 2. Univariate and Multivariate Analyses of the Association between Interstitial Lung Abnormalities and Metrics of Restrictive and Obstructive Lung Disease.*. malities had reductions in lung volume at relaxed exhalation (-0.293 liters; 95% confidence interval [CI], -0.430 to -0.156; P<0.001). The odds of a restrictive deficit in participants with interstitial abnormalities were 2.3 times the odds in participants without such abnormalities (Table 2).. P value. R adiogr aphic Interstitial Lung Abnormalities in Smokers. 903.
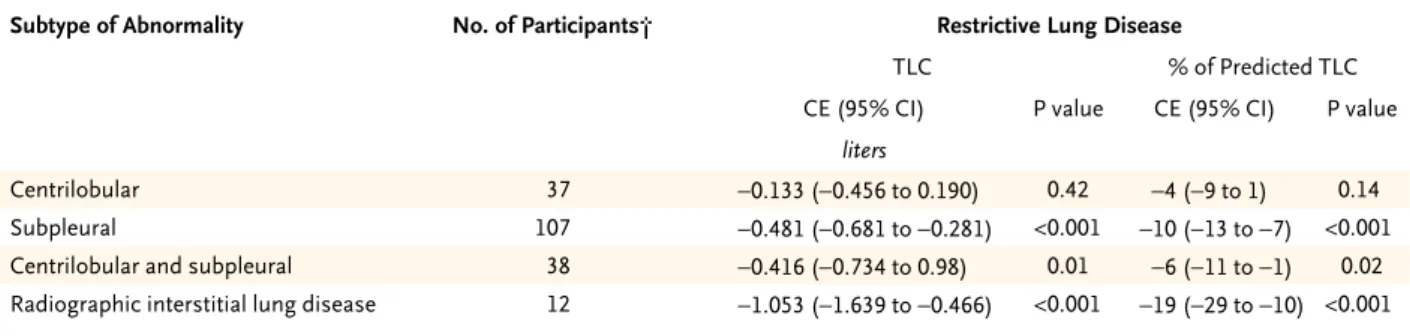
(8) The. n e w e ng l a n d j o u r na l. of. m e dic i n e. Table 3. Multivariate Analyses of the Association between Subtypes of Interstitial Lung Abnormalities and Metrics of Restrictive and Obstructive Lung Disease.* Subtype of Abnormality. No. of Participants†. Restrictive Lung Disease TLC CE (95% CI). % of Predicted TLC P value. CE (95% CI). P value. liters Centrilobular Subpleural. 37. −0.133 (−0.456 to 0.190). 0.42. −4 (−9 to 1). 0.14. 107. −0.481 (−0.681 to −0.281). <0.001. −10 (−13 to -7). <0.001. 0.01. −6 (−11 to -1). 0.02. Centrilobular and subpleural. 38. −0.416 (−0.734 to 0.98). Radiographic interstitial lung disease. 12. −1.053 (−1.639 to −0.466). <0.001. −19 (−29 to -10) <0.001. * All multivariate models were adjusted for age, sex, race, body-mass index, pack-years of smoking, current smoking status, and status with respect to COPD (except in the model for COPD status). Analyses for total lung capacity (TLC), TLC as a % of predicted value, and emphysema (defined by lung-attenuation thresholds of −950 and −910 HU) are the result of multivariate linear regression models. Analyses for TLC <80% of predicted and COPD are the result of multivariate logistic-regression models. Percent of predicted total lung capacity was calculated in accordance with guidelines from the American Thoracic Society and European Respiratory Society.10 CE denotes coefficient estimate, HU Hounsfield units, and OR odds ratio. † For each subtype, participants with abnormalities were compared with 1361 participants without abnormalities. ‡ COPD was defined as Global Initiative for Chronic Obstructive Pulmonary Disease (GOLD) stage 2 or higher.. Major Subtypes of Interstitial Lung Abnormalities. trilobular nodules (odds ratio, 4.82; 95% CI, 2.47 to 9.44; P<0.001). For findings on the association Of the 194 participants with interstitial lung ab- between interstitial lung abnormalities and varinormalities, 37 (19%) could be classified as hav- ables other than smoking, see Table E5 and elseing centrilobular abnormalities (Fig. 1A), 107 where in the Supplementary Appendix. (55%) as having subpleural abnormalities (Fig. 1B), 38 (20%) as having centrilobular and subDiscussion pleural (or mixed) abnormalities (Fig. 1C), and 12 (6%) as having radiographic interstitial lung Our analysis of HRCT scans from this large codisease (Fig. 1D) (see also Tables E3 and E4 of hort shows that interstitial lung abnormalities the Supplementary Appendix). Table 3 shows the are present in approximately 8% of smokers. The association between the subtypes of interstitial findings also show that interstitial lung abnorlung abnormalities and the measures of restric- malities are associated with both reduced total tive and obstructive lung disease. As compared lung capacity and a lesser amount of emphysema with participants who did not have interstitial in smokers, and the magnitude of these reduclung abnormalities, those with radiographic in- tions is greatest among those with COPD. We terstitial lung disease had the greatest reduction found that smokers with interstitial lung abnorin lung volumes, followed by intermediate reduc- malities have reduced total lung capacity (the extions in the subpleural and mixed subtypes, with tent of which varies according to the subtype of the centrilobular subtype having the smallest re- interstitial lung abnormality) and are at an induction in lung volumes (P = 0.02 for analysis of creased risk for a restrictive lung deficit. Although variance between subtypes) (Table 3). Emphysema reductions in total lung capacity are expected in was reduced by a similar magnitude in all sub- established clinical interstitial lung disease,17 our types of interstitial lung abnormalities (Table 3). data provide a quantitative estimate of the degree to which interstitial lung abnormalities are asExposure to Tobacco Smoke sociated with reductions in total lung capacity. As reported previously,3 both the extent of expoA major finding of our analyses is the inverse sure to tobacco smoke and smoking status were association between interstitial lung abnormaliassociated with the odds of having interstitial ties and the severity of COPD or of emphysema lung abnormalities, in adjusted models (see the (particularly among participants with COPD). We Supplementary Appendix). The specific intersti- considered the possibility that interstitial lung tial abnormality most strongly associated with abnormalities would result in an erroneous uncurrent smoking status was the presence of cen- derestimation of the amount of emphysema by 904. n engl j med 364;10. nejm.org. march 10, 2011.
(9) R adiogr aphic Interstitial Lung Abnormalities in Smokers. Obstructive Lung Disease <80% of Predicted TLC. % Emphysema, −950 HU. OR (95% CI). P value. CE (95% CI). 2.02 (0.76 to 5.37). 0.16. −3 (−6 to 0.2). 2.86 (1.53 to 5.35). 0.001. −3 (−5 to −2). 1.10 (0.42 to 2.92). 0.85. −3 (−6 to −0.5). 9.55 (1.90 to 48.01). 0.006. −2 (−7 to 3). increasing the overall lung density defined by Hounsfield-unit thresholds. Several lines of evidence suggest that a density shift in the distribution of Hounsfield units is unlikely to explain our findings. First, the associations we found between emphysema and interstitial lung abnormalities were not most prominent in the lower lobes, where more interstitial abnormalities are expected (see the Supplementary Appendix). Second, the reductions in emphysema noted in participants with interstitial lung abnormalities were paired with the physiological consequences of reduced emphysema (e.g., additional reductions in total lung capacity). Third, we noted inverse associations between the presence of interstitial lung abnormalities and clinically diagnosable COPD, a variable that is independent of the measurement of emphysema with the use of HRCT. Our findings are consistent with, and add weight to, previous studies showing that cigarette smoking is associated with both spirometric restriction18 and areas of high attenuation on HRCT.3 Since emphysema and interstitial lung abnormalities have opposing effects on lung volume, our findings suggest that HRCT may provide important diagnostic information in smokers whose total lung capacity is unexpectedly “normal.” We speculate that this could be clinically important to physicians who may think that a patient who does not have symptoms or characteristic abnormalities on lung-function tests is disease-free, when in fact the patient could be affected by two of the consequences of smoking — emphysema and interstitial lung abnormalities. It is possible that a number of smokers with interstitial lung abnormalities have clinically diagnosable respiratory bronchiolitis, a welldescribed interstitial lung disease that is related to n engl j med 364;10. % Emphysema, −910 HU. P value. OR (95% CI). P value. 0.06. −12 (−16 to −7). <0.001. −9 (−12 to −6). 0.02. −10 (−14 to −5). 0.39. −9 (−11 to −7). COPD‡ OR (95% CI). P value. <0.001. 0.33 (0.14 to 0.81). 0.02. <0.001. 0.60 (0.39 to 0.94). 0.03. <0.001. 0.67 (0.31 to 1.46). 0.32. 0.21 (0.05 to 0.93). 0.04. smoking and associated with ground-glass opacities and centrilobular nodules,19,20 or smokingrelated interstitial fibrosis,21 a less well-defined entity with features overlapping those of usual interstitial pneumonia and emphysema.22 However, among the participants in the COPDGene Study with interstitial lung abnormalities, 81% (157) had specific radiographic features and reductions in lung volumes that are not typical of respiratory bronchiolitis.9 As mentioned previously, expected reductions in lung volumes among patients with smoking-related interstitial lung abnormalities could be masked by concomitant emphysema. Our study has several limitations. First, we recognize that congestive heart failure, compression artifacts from bullous emphysema, and atel ectasis could mimic the changes on chest HRCT that we have defined as interstitial lung abnormalities. However, in a prior study that excluded participants with heart failure (defined by a physician’s diagnosis), a similar association between interstitial lung abnormalities and cigarette smoking was noted.3 In addition, a strong inverse association between emphysema and interstitial lung abnormalities suggests that compression artifacts associated with bullous emphysema are an unlikely explanation for our findings. Moreover, our study shows similar associations with total lung capacity and lung volume at relaxed exhalation, which suggests that our findings are probably not the result of differences in inspiratory effort (or atelectasis). Second, although our measurements of total lung capacity were obtained by means of HRCT, not body plethysmography, previous studies have consistently reported very high degrees of correlation between these measurements (r2 approximately 0.9),23,24 and recent data suggest that plethysmography may be a. nejm.org. march 10, 2011. 905.
(10) R adiogr aphic Interstitial Lung Abnormalities in Smokers. less accurate measurement of total lung capacity volumes, are transient or stable, or whether they than radiographic measurement in patients with will progress to clinically significant disease. COPD.25 Third, since our population includes Supported by grants from the National Institutes of Health smokers with an oversampling of participants (U01 HL089897 and U01 HL089856, to COPDGene; K23 with COPD, caution should be exercised in ex- HL089353, to Dr. Washko; K08 HL092222, to Dr. Hunninghake; K25 HL104085, to Dr. Estépar; T32 HL07427, to Dr. Brehm; trapolating our findings to general population 5R21CA116271-2, to Dr. Hatabu; and K23 HL087030, to Dr. Rosamples. sas) and by an award from the Parker B. Francis Foundation (to We have found that as compared with smokers Dr. Washko). Dr. Washko reports receiving consulting fees from Medimwithout interstitial lung abnormalities, smokers mune; Dr. Lynch, grant support from Siemens and consulting or with interstitial abnormalities on HRCT, partic- board membership fees from Actelion, Gilead, Intermune, Noularly smokers with COPD, have a reduced total vartis, and Perceptive Imaging; Dr. Khorasani, grant support from GE Medical Systems; Dr. Silverman, grant support from lung capacity and a lesser amount of emphysema. the COPD Foundation and GlaxoSmithKline and consulting fees Longitudinal follow-up studies of persons with from GlaxoSmithKline and AstraZeneca; and Dr. Hatabu, grant interstitial lung abnormalities will be required support from Toshiba Medical and AZE. No other potential conflict of interest relevant to this article was reported. to determine whether these radiographic abnorDisclosure forms provided by the authors are available with malities, and the associated reductions in lung the full text of this article at NEJM.org. References 1. Smoking and health: a report of the. Advisory Committee to the Surgeon General of the Public Health Service. Washington, DC: Public Health Service, 1964. (PHS publication no. 1103.) 2. Webb WR. Thin-section CT of the secondary pulmonary lobule: anatomy and the image — the 2004 Fleischner lecture. Radiology 2006;239:322-38. 3. Lederer DJ, Enright PL, Kawut SM, et al. Cigarette smoking is associated with subclinical parenchymal lung disease: the Multi-Ethnic Study of Atherosclerosis (MESA)–lung study. Am J Respir Crit Care Med 2009;180:407-14. 4. Washko GR, Lynch DA, Matsuoka S, et al. Identification of early interstitial lung disease in smokers from the COPDGene Study. Acad Radiol 2010;17:48-53. 5. Regan EA, Hokanson JE, Murphy JR, et al. Genetic Epidemiology of COPD (COPDGene) study design. COPD 2010;7: 32-43. 6. Standardization of spirometry, 1994 update. Am J Respir Crit Care Med 1995; 152:1107-36. 7. Brantly M, Avila NA, Shotelersuk V, Lucero C, Huizing M, Gahl WA. Pulmonary function and high-resolution CT findings in patients with an inherited form of pulmonary fibrosis, HermanskyPudlak syndrome, due to mutations in HPS-1. Chest 2000;117:129-36. 8. Gochuico BR, Avila NA, Chow CK, et al. Progressive preclinical interstitial lung disease in rheumatoid arthritis. Arch Intern Med 2008;168:159-66. 9. American Thoracic Society/European Respiratory Society International Multidisciplinary Consensus Classification of the Idiopathic Interstitial Pneumonias: this joint statement of the American Thoracic Society (ATS), and the European Respiratory Society (ERS) was adopted by. 906. the ATS board of directors, June 2001 and by the ERS Executive Committee, June 2001. Am J Respir Crit Care Med 2002;165:277-304. [Erratum, Am J Respir Crit Care Med 2002;166:426.] 10. Stocks J, Quanjer PH. Reference values for residual volume, functional residual capacity and total lung capacity: ATS Workshop on Lung Volume Measurements: official statement of The European Respiratory Society. Eur Respir J 1995; 8:492-506. 11. Lung function testing: selection of reference values and interpretative strategies. Am Rev Respir Dis 1991;144:1202-18. 12. Kim WJ, Silverman EK, Hoffman E, et al. CT metrics of airway disease and emphysema in severe COPD. Chest 2009;136: 396-404. 13. Hersh CP, Washko GR, Jacobson FL, et al. Interobserver variability in the determination of upper lobe-predominant emphysema. Chest 2007;131:424-31. 14. Rabe KF, Hurd S, Anzueto A, et al. Global strategy for the diagnosis, management, and prevention of chronic obstructive pulmonary disease: GOLD executive summary. Am J Respir Crit Care Med 2007;176:532-55. 15. Crapo RO, Morris AH, Gardner RM. Reference spirometric values using techniques and equipment that meet ATS recommendations. Am Rev Respir Dis 1981; 123:659-64. 16. Hankinson JL, Odencrantz JR, Fedan KB. Spirometric reference values from a sample of the general U.S. population. Am J Respir Crit Care Med 1999;159:17987. 17. Hartley PG, Galvin JR, Hunninghake GW, et al. High-resolution CT-derived measures of lung density are valid indexes of interstitial lung disease. J Appl Physiol 1994;76:271-7.. n engl j med 364;10. nejm.org. 18. Mannino DM, Holguin F, Pavlin BI,. Ferdinands JM. Risk factors for prevalence of and mortality related to restriction on spirometry: findings from the First National Health and Nutrition Examination Survey and follow-up. Int J Tuberc Lung Dis 2005;9:613-21. 19. Niewoehner DE, Kleinerman J, Rice DB. Pathologic changes in the peripheral airways of young cigarette smokers. N Engl J Med 1974;291:755-8. 20. Park JS, Brown KK, Tuder RM, Hale VA, King TE Jr, Lynch DA. Respiratory bronchiolitis-associated interstitial lung disease: radiologic features with clinical and pathologic correlation. J Comput Assist Tomogr 2002;26:13-20. 21. Katzenstein AL, Mukhopadhyay S, Zanardi C, Dexter E. Clinically occult interstitial fibrosis in smokers: classification and significance of a surprisingly common finding in lobectomy specimens. Hum Pathol 2010;41:316-25. 22. Cottin V, Nunes H, Brillet PY, et al. Combined pulmonary fibrosis and emphysema: a distinct underrecognised entity. Eur Respir J 2005;26:586-93. 23. Becker MD, Berkmen YM, Austin JH, et al. Lung volumes before and after lung volume reduction surgery: quantitative CT analysis. Am J Respir Crit Care Med 1998; 157:1593-9. 24. Brown MS, McNitt-Gray MF, Goldin JG, et al. Automated measurement of single and total lung volume from CT. J Comput Assist Tomogr 1999;23:632-40. 25. O’Donnell CR, Bankier AA, Stiebellehner L, Reilly JJ, Brown R, Loring SH. Comparison of plethysmographic and helium dilution lung volumes: which is best for COPD? Chest 2010;137:1108-15. Copyright © 2011 Massachusetts Medical Society.. march 10, 2011.
(11) Reproduced with permission of the copyright owner. Further reproduction prohibited without permission..
(12)
Figure
Documento similar