Photoproduction of hydrogen using nanoparticles of titanium dioxide
187
0
0
Texto completo
(2) PONTIFICIA UNIVERSIDAD CATÓLICA DE CHILE SCHOOL OF ENGINEERING. PHOTOPRODUCTION OF HYDROGEN USING NANOPARTICLES OF TITANIUM DIOXIDE. FELIPE JOSÉ VARAS CONCHA. Members of the Committee:. CÉSAR SÁEZ BLANCA ANTÍZAR RODRIGO ESCOBAR VÍCTOR FUENZALIDA LEANDRO HERRERA MAURICIO ISAACS A JUAN DE DIOS ORTÚZAR Thesis submitted to the Office of Research and Graduate Studies in partial fulfillment of the requirements for the Degree of Doctor of Science in Engineering Santiago de Chile, April 2018.
(3) To my beloved parents….
(4) ACKNOWLEDGEMENT I want to thank my family for their support. To my parents Marfilda and Mariano, for being an example of sacrifice, effort and good-hearted people. To Mariana, Ignacio and María Jesús for understanding my long absences meanwhile I was following this goal. To César, my supervisor, for sharing his expertise in research, for his support when I choose this non-traditional topic, and for showing me that it is possible to be a good person in the competitive academic world. To all my friends from Sáez’ Lab: Germán and Cristián, my μalgae friends; Catalina, my H2-partner; Leonardo, the leader and roadopener friend; and especially to my friend and doctoral partner, Sebastián, who was my company, technical opinion and fun in this very demanding PhD experience. To Prof. Isaacs, who guided me in the world of nanoscience, for opening his lab to this engineer entering into a chemist’s world. To Diego, my nanoworld mate, for all his help, patience and friendship. To the whole MAIC lab team, especially to Quezada, Jessica, Esteban and Natalia for their help and nice moments. Thanks to Kipus from U. Talca, especially to Carlos, boss and friend, for giving me a parallel R+D route to follow, and for helping me finish this process. To Rachael and the Academic Writting Center, for their support in using correct English in my writing. Finally, thanks to CONICYT for its financial support via a doctoral grant, number 21100026. This would not be possible without its important role. iv.
(5) CONTENTS INDEX. ACKNOWLEDGEMENT .......................................................................................... iv CONTENTS INDEX.................................................................................................... v TABLE OF FIGURES ................................................................................................. x TABLE OF TABLES ................................................................................................ xiv ABSTRACT ............................................................................................................... xv RESUMEN ................................................................................................................ xvi 1. CONCEPTUAL FRAMEWORK ....................................................................... 1 1.1 Problematic and selected approach ............................................................ 1 1.1.1 Energy needs and hydrogen as an option ......................................... 1 1.1.2 Technologies for hydrogen production ............................................ 2 1.1.3 Hydrogen production by photocatalysis using nanosized semiconductors ................................................................................ 3 1.1.4 Photocatalysts: Titanium dioxide..................................................... 5 1.1.5 Improvement techniques and factors affecting H2 production ........ 6 1.2 Contribution of this research ...................................................................... 8 1.3 Hypothesis and objectives .......................................................................... 9 1.4 Outline of the thesis.................................................................................. 11 1.5 General methodology ............................................................................... 12. v.
(6) 2. Hydrogen productivity analysis using low concentration of TiO2-Au nanoparticles on a UV-LED based photocatalytic reactor................................ 16 2.1 Introduction .............................................................................................. 16 2.2 Experimental ............................................................................................ 20 2.2.1 Reagents ......................................................................................... 20 2.2.2 Instruments..................................................................................... 20 2.2.3 Synthesis method ........................................................................... 22 2.2.4 Photocatalytic experiments ............................................................ 23 2.2.5 Measurement of hydrogen ............................................................. 24 2.3 Results & discussion ................................................................................ 25 2.3.1 Synthesis ........................................................................................ 25 2.3.2 UV-Vis Absorption spectroscopy .................................................. 26 2.3.3 Elemental analysis via EDS and ICP-AES .................................... 27 2.3.4 Particle size distribution of the aggregates by DLS analysis ......... 28 2.3.5 Aggregates and gold coating characterization using TEM and image processing analysis .............................................................. 30 2.3.6 Photocatalytic hydrogen production .............................................. 34 2.4 Conclusions .............................................................................................. 41. 3. Operational conditions affecting hydrogen production via photoreforming of organic compounds using TiO2-Au nanoparticles ....................... 42 3.1 Introduction .............................................................................................. 42 3.1.1 Hydrogen role in energy scenario .................................................. 42 3.1.2 Factors affecting photocatalytic hydrogen generation ................... 43 vi.
(7) 3.1.3 TiO2 modification by gold and alcohols as a sacrificial agent....... 47 3.2 Experimental Section ............................................................................... 52 3.2.1 Reagents ......................................................................................... 52 3.2.2 Instruments..................................................................................... 52 3.2.3 Synthesis of partially covered TiO2–Au nanoparticles .................. 53 3.2.4 Design of experiment ..................................................................... 54 3.2.5 Photocatalytic experiments ............................................................ 55 3.3 Results and Discussion ............................................................................. 57 3.3.1 Characterization of the photocatalyst............................................. 57 3.3.2 General results from the factorial experiment ............................... 60 3.3.3 Total hydrogen generation ............................................................. 62 3.3.4 Catalyst productivity ...................................................................... 71 3.3.5 Electron donor productivity ........................................................... 75 3.3.6 Variability adjustment factors ........................................................ 79 3.3.7 Analysis of productivities space .................................................... 80 3.4 Conclusions .............................................................................................. 83 4. Operational conditions affecting formaldehyde and formic acid formation as by-products of hydrogen production via photoreforming of methanol ........ 84 4.1 Introduction .............................................................................................. 84 4.1.1 Relevance of formaldehyde and formic acid ................................. 84 4.1.2 Formaldehyde and formic acid as by-products of photocatalytic hydrogen ................................................................. 86 4.1.3 Factors affecting formaldehyde and formic acid generation ......... 87 vii.
(8) 4.2 Experimental Section ............................................................................... 90 4.2.1 Reagents ......................................................................................... 91 4.2.2 Instruments..................................................................................... 91 4.2.3 Synthesis of partially covered TiO2–Au nanoparticles .................. 92 4.2.4 Design of experiment ..................................................................... 92 4.2.5 Photocatalytic experiments ............................................................ 93 4.2.6 Formaldehyde and formic acid measurement ................................ 94 4.3 Results and Discussion ............................................................................. 96 4.3.1 Characterization of the photocatalyst............................................. 96 4.3.2 General results from the factorial experiment ............................... 97 4.3.3 Formaldehyde generation .............................................................. 99 4.3.4 Formic acid generation ................................................................ 105 4.3.5 Analysis of productivities space .................................................. 111 4.4 Conclusions ............................................................................................ 116 5. Conclusions of doctoral work ......................................................................... 118 5.1 Conclusions based on objectives ............................................................ 118 5.2 Conclusions paper 1 ............................................................................... 119 5.3 Conclusions paper 2 ............................................................................... 120 5.4 Conclusions paper 3 ............................................................................... 120 5.5 Recommendations and future perspectives ............................................ 122. 6. Bibliography ................................................................................................... 123. Annex I. Supporting information for paper 1 ........................................................... 156 viii.
(9) Annex II. Supporting information for paper 2 ......................................................... 164 Annex III. Supporting information for paper 3 ........................................................ 168. ix.
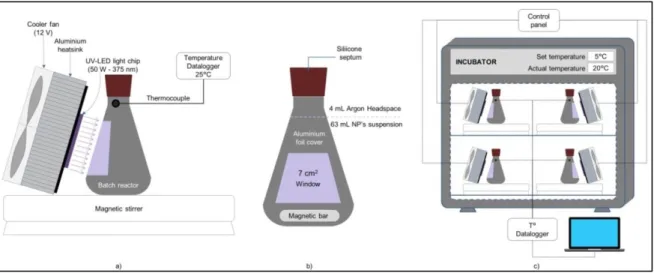
(10) TABLE OF FIGURES Figure 1. Flowchart with the general methodology. Blue: experimental stage; light blue: analytical stage. .................................................................................................................. 12 Figure 2. Experimental setup for hydrogen generation: (left) batch reactor; (center) UVLED setting; (right) system configuration within the incubator ........................................ 23 Figure 3. Normalized UV-visible absorption spectra of TiO2, TiO2-Au synthesized using molar ratio 1:1 ([TiO2]=0.2 mM), and TiO2-Au synthesized using molar ratio 20:1 ([TiO2]=4 mM) ................................................................................................................... 27 Figure 4. EDS spectra of TiO2-Au 20:1, confirming presence of Ti, O and Au. .............. 28 Figure 5. Particle size (radius) distribution results from DLS analysis for TiO2-Au aggregates synthesized with molar ratios 20:1 and 1:1, with synthesis pH level adjusted to 2.2 and 4.5 .......................................................................................................................... 29 Figure 6. TEM images for agglomerates TiO2-Au synthetized using a molar ratio [TiO2]:[Au] 1:1 and 20:1, analyzed with ImageJ, and an agglomerate of bare TiO2......... 31 Figure 7. Particle size distribution for gold nanoparticles on the surface of TiO2-Au synthesized using molar ratios 20:1 and 1:1, with fitted curves for normal distribution centered on 3.9 nm and 11.5, respectively. ........................................................................ 33. x.
(11) Figure 8. Cumulative hydrogen generation profile showing zero-order kinetics with respect to H2 using UV-light for nanoparticles synthesized in ratios 20:1 and 1:1. .......... 34 Figure 9. Catalyst productivity, also called turnover rate, reported in the literature for photocatalytic hydrogen generation using TiO2-Au catalysts, compared to the results of this work. ............................................................................................................................ 38 Figure 10. Experimental setup: a) experimental unit configuration; b) batch reactor; c) system configuration with four experimental units running at the same time. .................. 56 Figure 11. Normalized UV-visible absorption spectra of bare TiO2 (without peak) and TiO2-Au synthesized using a molar ratio 20:1 (with localized surface plasmon resonance peak around 530 nm) .......................................................................................................... 57 Figure 12. Particle size distribution results from DLS analysis for TiO2-Au agglomerates, with a peak of particles at 46 nm........................................................................................ 58 Figure 13. TEM image for an agglomerate TiO2-Au synthesized using a molar ratio 20:1, where the small rounded spots are the gold nanoparticles over the Titania surface. ......... 59 Figure 14. Particle size distribution for gold nanoparticles on the surface of TiO2-Au with a diameter peak around 4.5 nm. ......................................................................................... 59 Figure 15. Main effects plot for a) total hydrogen generation (H) and b) for its variability (H-StdDev). ........................................................................................................................ 63. xi.
(12) Figure 16. Interaction effects plot for total hydrogen generation (H), where white boxes show significant interactions. ............................................................................................. 67 Figure 17. Pareto chart of the standardized effects for the reduced model of H. .............. 69 Figure 18. Main effects plot for a) catalyst productivity (H/cat) and b) for its variability (H/cat-StdDev). .................................................................................................................. 72 Figure 19. Pareto chart of the standardized effects for the reduced model of H/cat. ........ 74 Figure 20. Main effects plot for a) electron donor productivity (H/eDon) and b) for its variability (H/eDon-Std Dev). ............................................................................................ 76 Figure 21. Pareto chart of the standardized effects for the reduced model of H/eDon. .... 78 Figure 22. Productivities space formed by experimental and predicted productivities. ... 81 Figure 23. Effect of single factors on productivities space. .............................................. 82 Figure 24. Experimental setup: a) experimental unit configuration; b) batch reactor; c) system configuration with four experimental units running at the same time. .................. 95 Figure 25. TEM image for an agglomerate TiO2-Au. The small rounded spots are the gold nanoparticles over the titanium dioxide surface. ................................................................ 97 Figure 26. Main effects plot for the total formaldehyde generation (F).......................... 100 Figure 27. Main effects plot for the catalyst productivity of formaldehyde (F/cat). ....... 101. xii.
(13) Figure 28. Interaction effects plot for total formaldehyde generation (F) ....................... 102 Figure 29. Pareto chart of the standardized effects for the F model. .............................. 104 Figure 30. Main effects plot for the total formic acid generation (FA)........................... 106 Figure 31. Main effects plot for the catalyst productivity of formic acid (FA/cat). ........ 106 Figure 32. Interaction effects plot for total formic acid generation (FA). ....................... 108 Figure 33. Pareto chart of the standardized effects for the FA model............................. 110 Figure 34. Space of responses for each possible combination of factors of total production of formaldehyde (F) and formic acid (FA), showing the displacement for a level change in factors A, B, C and D. ...................................................................................................... 112 Figure 35. Space of productivities for each possible combination of factors of catalyst productivity of formic acid (FA/cat) and hydrogen (H/cat), showing the displacement for a level change in factors A, B, C and D. ............................................................................. 113 Figure 36. Space of selectivity (F/FA) vs catalyst productivity of hydrogen (H/cat) for each possible combination of factors, showing the displacement due to a level change in factors A, B, C and D. ...................................................................................................... 114. xiii.
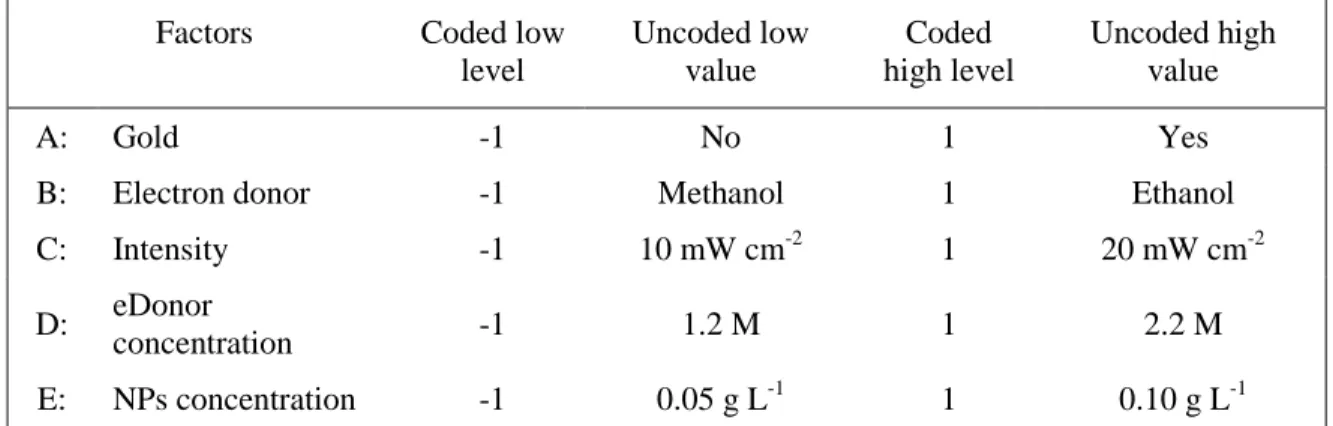
(14) TABLE OF TABLES Table 1. Size, area, and shape descriptors from image processing analysis...................... 31 Table 2. Measures of central tendency and dispersion for particle size distributions (Feret’s diameter) of gold nanoparticles from ImageJ analysis. ........................................ 33 Table 3. Comparative summary of experimental conditions and main results for recent literature reporting photocatalytic hydrogen generation using TiO2-Au nanoparticles, organized by catalyst productivity. .................................................................................... 39 Table 4. Coded and uncoded values of the factors used in the experiment for H2. ........... 61 Table 5. 25-1V Design of the experiment and results .......................................................... 61 Table 6. Coded and uncoded values of the factors used in the experiment for CH2O and CH2O2. ................................................................................................................................ 98 Table 7. 24-1IV Design of the experiment and results. ........................................................ 99. xiv.
(15) ABSTRACT The current global energy scenario has led scientists to look for more sustainable fuels. Hydrogen is an option, but it implies big challenges like changing the current dominant fossil fuel based production system. In this context, hydrogen production via photocatalytic routes is an interesting option. However, the reported yields have been disappointingly low, so it is crucial to focus research on improving these processes. This doctoral thesis seeks to identify the operational conditions with highest effect on the production of hydrogen and valuable by-products via photoreforming of alcohols using TiO2 nanoparticles, among five factors and their interactions: presence of gold as a cocatalyst, type of alcohol, intensity of light, concentration of alcohol and concentration of nanoparticles. Special focus was given to exploring the influence of these factors in a low range of catalyst concentrations. TiO2-Au nanoparticles synthesized via sol-gel method were fully characterized (UV-Vis, SEM-EDS, ICP-AES, DLS, TEM). Hydrogen, formaldehyde and formic acid were produced. The presence of gold as a co-catalyst, the intensity of UV light and their interaction showed the highest effect. The best configuration allowed reaching a catalyst productivity of 2,900 μmol∙g-1∙h-1. Keywords: Photocatalysis • Hydrogen • Photo-reforming of organic compounds • Titanium dioxide nanoparticles • Gold nanoparticles • Formaldehyde • Formic acid. xv.
(16) RESUMEN El actual escenario energético mundial ha llevado a los científicos a buscar combustibles más sustentables. El hidrógeno destaca como alternativa, pero implica grandes desafíos como el cambio del actual sistema de producción a partir de combustibles fósiles. La producción de hidrógeno vía fotocatálisis destaca como opción, pero los rendimientos reportados han sido bajos, siendo crucial enfocar esfuerzos en mejorar estos procesos. Esta tesis doctoral busca identificar las condiciones operacionales con mayor efecto en la producción de hidrógeno y de subproductos valiosos, a través del fotorreformado de alcoholes utilizando nanopartículas de TiO2, entre cinco condiciones y sus interacciones: presencia de oro como cocatalizador, tipo de alcohol, intensidad de la luz, concentración de alcohol y concentración de nanopartículas. Se prestó especial atención a explorar la influencia de estos factores en un rango de bajas concentraciones de catalizador. Las nanopartículas de TiO2-Au sintetizadas mediante un método sol-gel fueron completamente caracterizadas (UV-Vis, SEM-EDS, ICP-AES, DLS, TEM). Se logró generar H2, CH2O y CH2O2. La presencia de oro como cocatalizador, la intensidad de la luz UV y su interacción fueron los factores de mayor peso. La mejor configuración permitió alcanzar una productividad de catalizador de 2,900 μmol ∙ g-1 ∙ h-1. Palabras clave: Fotocatálisis • Hidrógeno • Fotorreformado de compuestos orgánicos • Nanopartículas de dióxido de titanio • Nanopartículas de oro • Formaldehído • Ácido fórmico. xvi.
(17) 1. 1 1.1 1.1.1. CONCEPTUAL FRAMEWORK Problematic and selected approach Energy needs and hydrogen as an option. Humanity faces a huge challenge: to deal with and fight climate change. Even when there is not total agreement about its origin, the scientific community considers greenhouse gases (GHG) accumulation as the main cause behind this phenomenon, especially those with anthropogenic source, linked to the use of fossil fuels. The problem is complex considering that: 81% of the world's primary energy matrix is based on fossil fuels (IEA, 2017a), 65% of anthropogenic GHG emissions come from energy consumption (Stern, 2006), and the strong signs of a growing oil shortage (IEA, 2017b). In this scenario, hydrogen has a relevant role as a sustainable fuel with several positive features, such as its high energy content per mass unit (IEA, 2007) (141,850 kJ·kg-1 H2 gas, standard), and its clean usage, which just generates water as by-product. These virtues make hydrogen an interesting choice in the technology road to a more sustainable society. However, the current scenario does not have the necessary conditions for massive production of hydrogen for energy purposes: 96% worldwide hydrogen production is based on fossil fuels (IEA, 2007); almost 100% of global production is used as raw material for the petrochemical industry (C. A. Grimes, Varghese, & Ranjan, 2008); the.
(18) 2. current electrolytic hydrogen costs twice as much as the cost goal of 2-3 USD kg-1, which does not make it competitive (Turner et al., 2008); its productive chain has important technological barriers; it requires a profound technological and social transformation, and a renewal of the existing infrastructure. Despite all these challenges, leading countries have developed a roadmap to make hydrogen a competitive fuel against traditional the fossil fuels (IEA, 2015; US DOE, 2002). In this plan, the development of production technologies is crucial, and it is required to expand the understanding of the phenomena involved in hydrogen generation. So, experimental and mechanistic studies are key factors in this route to a sustainable hydrogen based system. 1.1.2. Technologies for hydrogen production. Hydrogen production technologies can be classified according to the raw material used in the process: fossil fuels, water or biomass (Balat, 2008; IEA, 2006; Turner et al., 2008). Among the technologies based on fossil hydrocarbons, methane steam reforming (SMR) is the dominant technology, followed by partial oxidation (POX), autothermal reforming (ATR) and coal gasification. However, they have high carbon, water and energy footprints. In the case of biomass, thermochemical and biological processes are used. This is the least mature technology and is mostly at laboratory level. Water-based methods are considered a more sustainable option, but electrolysis is the only industrial-scale technology commercially available. Other systems under development with good.
(19) 3. projections are the thermochemical cycles and those that use solar energy such as photoelectrolysis and photocatalysis. There are currently many challenges in the development of technologies for the production of hydrogen. The efficiency of production plants must be improved and the capital costs reduced. In processes based on fossil fuels and biomass, the main limitation is related to its CO2 emissions and the intensive use of energy (Balat, 2008; Brentner, Peccia, & Zimmerman, 2010; Janusz Nowotny & Veziroglu, 2011). In the case of electrolytic processes, the problem is the high cost of electricity and the intensive use of energy (Zeng & Zhang, 2010). Biological processes and those that use solar energy must face various challenges before being able to scale-up, due to their low production rates and low efficiencies (Dincer & Acar, 2015; H.-S. Lee, Vermaas, & Rittmann, 2010). 1.1.3. Hydrogen production by photocatalysis using nanosized semiconductors. Water-splitting, the generation of hydrogen using solar energy based on water as raw material and semiconductive catalysts has become the Holy Grail process (Serpone et al., 2016). Therefore, many researchers have focused their efforts on photocatalysis using particulate systems, becoming one of the most promising energy solutions in the near future. This method relies on the photoelectric effect, which was discovered in the 70s by Fujishima and Honda (Fujishima & Honda, 1972). When a semiconductor suspended in water is excited by light, the electrons of its valence band receive enough energy to overcome its band gap and pass to the conduction band, generating electron-hole (e-/h+).
(20) 4. pairs, also called charge carriers. Therefore, the photogenerated holes oxidize water molecules in the surface forming O2, and the electrons reduce protons to H2, without changing the semiconductor composition (Osterloh & Parkinson, 2011). Unfortunately, although this method may seem technically simple, it involves a complex reaction where inverse reactions are involved, and usually good photocatalysts for H2 production are good catalysts for their recombination too (Osterloh & Parkinson, 2011). An alternative approach for solar hydrogen generation is photoreforming of aqueous solutions containing oxygenated organic compounds. Photoreforming could be viewed as an intermediate process between photocatalytic water splitting and photooxidation. Compared to pure water splitting, photocatalytic reforming has emerged as a more efficient light-promoted hydrogen production. Kawai and Sakata first achieved photocatalytic hydrogen production from a liquid mixture of methanol and water in 1980 (Kawai & Sakata, 1980). It has been reported that the oxygenated organic compounds such as hole scavengers are capable of reacting with the photogenerated holes to inhibit charge carrier recombination and preventing oxygen production to suppress the backreaction between H2 and O2, in turn enhancing H2 production (Carraro et al., 2014; Chao Wang et al., 2017). Photoreforming can even be a sustainable method, and many biomassderived compounds as renewable sources have been proposed for photoreforming hydrogen production (Gallo et al., 2012; Puga, 2016; Chao Wang et al., 2017). The advances in nanosized materials have contributed to the technological development of applications in photocatalysis. It is more effective to work at nanometric scale, increasing.
(21) 5. the photoefficiency of the systems where the transfer of charges is the limiting step (S. Gupta & Tripathi, 2011), because in small sized particles, the charge carriers are always near the surface, where the reactions take place (Osterloh & Parkinson, 2011). 1.1.4. Photocatalysts: Titanium dioxide. The photocatalysis is generally defined as the catalysis of a photochemical reaction on a solid surface, usually a semiconductor. There must be at least two reactions occurring at the same time in a balanced way: oxidation and reduction. If such a balance does not exist its composition would change, and one of the basic requirements of any catalyst would not be fulfilled (Fujishima, Zhang, & Tryk, 2008). The basic criterion for defining a good photocatalyst to produce H 2 is to have an appropriate band gap, where the lowest energy level of the conduction band, also called LUMO (lowest unoccupied molecular orbital), must be more negative than the redox potential for H+/H2 (-0.41 V), and that the highest energy level of the valence band, also called HOMO (highest occupied molecular orbital), should be more positive than the redox potential for the oxidation reaction. In case of water-splitting, it should be more positive than O2/H2O (+0.82 V) (Kudo, 2007). Moreover, an ideal semiconductor should be simple to produce and use, cost-effective, photostable, harmless for the health of people and the environment, respond to sunlight, and be able to catalyze the reaction effectively (Carp, Huisman, & Reller, 2004; S. Gupta & Tripathi, 2011). However, most photocatalysts have limitations. For example, Ge, GaAs, PbS and CdS are not stable.
(22) 6. enough for catalysis in aqueous media, suffering photocorrosion and in some cases presenting toxicity; ZnO dissolves in water; and Fe2O3, SnO2 and WO3 have incompatible conduction bands with H2 generation (Fujishima et al., 2008; S. Gupta & Tripathi, 2011). Titanium dioxide (TiO2) stands out for several reasons: its 3.2 eV gap satisfies the basic requirement in relation to the redox potentials; it is photostable in aqueous environments; it is not toxic; its holes are strongly oxidizing and selective; and it is more abundant than other photosensitive materials; and it has a high refractive index resulting in an efficient dispersion of diffuse light through the pores of the material (S. Gupta & Tripathi, 2011; J. Nowotny, Bak, Nowotny, & Sheppard, 2007). In spite of the mentioned virtues, the production rates of H2 and the solar-to-hydrogen conversion efficiencies are still modest, due to mainly three reasons: i) the rapid recombination of its charge carriers; ii) the rapid reverse reaction of recombination of H2 and O2; and iii) that it only can capture UV light photons (4% of solar energy, while visible light represents 50%) (Ni, Leung, Leung, & Sumathy, 2007). 1.1.5. Improvement techniques and factors affecting H2 production. The main problem affecting hydrogen productivity is that the time scale of the different reaction steps in photocatalytic hydrogen production is very different. The photoinduced generation of an electron-hole couple occurs in femtoseconds, meanwhile their recombination in 10–100 ns. Reduction reactions mediated by the excited electrons need a longer time, in the range of ms, whereas the oxidative reaction carried out by holes takes.
(23) 7. ca. 100 ns. Therefore, electrons need to be preserved for a longer time by trapping them into a metal where they can migrate, or by making holes react with a suitable hole scavenger, also called electron donor or sacrificial agent (Hoffmann, Martin, Choi, & Bahnemann, 1995; Melo & Silva, 2011; Rossetti, 2012). This second technique is the reason behind the better results in photoreforming than water-splitting. Regarding the metal deposition on the semiconductor surface, the Schottky barrier (B. Gupta, Melvin, Matthews, Dash, & Tyagi, 2016; Rajeshwar, Chenthamarakshan, Ming, & Sun, 2002) formed at the interface between metal and semiconductor can serve as an electron trap, increasing the lifetime of charge carriers and enhancing the efficiency of the photocatalytic reaction. The metal also serves as an active site to reduce protons to H2 (Rossetti, 2012). Other modification techniques are the ion-doping to reduce the band gap of the semiconductor and expand the captured spectrum of light, and the use of sensitizing dyes, which have the ability of injecting more electrons to the conduction band of the semiconductor. Besides the already mentioned techniques, researchers have shown interest in how different factors affect hydrogen production. Most of them are operational conditions like concentration and type of electron donors, concentration and type of nanoparticles, geometry and size of nanoparticles, wavelength and intensity of light, among others..
(24) 8. However, most of these studies analyze the effect of these factors independently, skipping the possible joint effect when several of them interact. 1.2. Contribution of this research. Based on the necessity to develop new sources of clean energy and that we must move towards H2 production methods that are neither dependent on fossil fuels nor intensive in energy use, this research seeks to contribute to the a better understanding of the effects of several operational conditions on the H2 production via photoreforming of alcohols using TiO2 and TiO2-Au nanoparticles. Many studies in this field provide valuable information about the effect of an isolated factor on hydrogen production, but as is typical in nanosized applications, there exists a long list of factors affecting it, with very different experimental conditions too. This makes it very difficult to compare the impact of different factors and identify which is the best route to higher productivities and higher efficiencies. In this scenario, this work provides an evaluation and quantification of the combined effects of five factors on hydrogen production and its by-products, formaldehyde and formic acid, in particulate systems: -. The presence of gold as a co-catalyst. -. The type of alcohol to be photoreformed. -. The intensity of UV-light supplied to the photoreactor. -. The concentration of alcohol.
(25) 9. -. The concentration of nanoparticles. Based on these analyses, statistical models are proposed for hydrogen, formaldehyde and formic acid production and their catalyst productivities estimations. This tool can help to estimate these responses when a change in these five factors is made. As a secondary contribution, this work explores the photo-reforming of alcohols in a range of nanoparticle concentrations never reported before (below 0.1 g∙L-1) under high levels of UV-light intensity (above 10 mW∙cm-2), providing valuable experimental data, which could be used for validation of different theorical models and for comparing with isolated factors analyses. 1.3. Hypothesis and objectives. The hypothesis: Adding gold nanoparticles over the surface of titanium dioxide nanoparticles is the main factor affecting the production of hydrogen and by-products in the photoreforming of alcohol processes. The magnitude of this effect can be affected by the combined influence of changes in operational conditions, such as type of alcohol, intensity of light, concentration of alcohol and concentration of nanoparticles. The general objective is:.
(26) 10. To identify the operational conditions with the highest effect on the production of hydrogen and by-products via photoreforming of alcohols using TiO2 nanoparticles among five factors and their interactions: presence of gold as a co-catalyst, type of alcohol, intensity of light, concentration of alcohol and concentration of nanoparticles. The specific objectives are to: 1) synthesize and characterize nanoparticles of TiO2 modified with gold as a cocatalyst. 2) produce hydrogen via photoreforming of alcohols using the synthesized TiO2-Au nanoparticles. 3) quantify and prioritize the main and interaction effects of the selected operational conditions on the hydrogen production, on its catalyst productivity, and its alcohol productivity. 4) propose and validate a statistical model to predict the hydrogen production and its catalyst productivity. 5) quantify and prioritize the main and interaction effects of the selected operational conditions on the production of valuable by-products – formaldehyde and formic acid – and its catalyst productivity. 6) propose and validate a statistical model to predict the formaldehyde and formic acid production, and their catalyst productivities..
(27) 11. 1.4. Outline of the thesis. This thesis is organized in six chapters. They contribute as follows: -. Chapter 1 is titled “CONCEPTUAL FRAMEWORK”, it presents the problematic and motivations behind this work, a brief status of art, the proposed hypothesis and objectives, and the general methodology used to achieve the objectives.. -. Chapter 2 presents the article “Hydrogen productivity analysis using low concentration of TiO2-Au nanoparticles on a UV-LED based photocatalytic reactor”. It covers the synthesis and full characterization of the nanomaterial and evaluates the feasibility of hydrogen production via photoreforming. It contributes to the achievement of the specific objectives 1) and 2).. -. Chapter 3 presents the article “Operational conditions affecting hydrogen production via photo-reforming of organic compounds using TiO2-Au nanoparticles”. It is the main chapter of this work, directly related to the hypothesis verification. It contributes to the achievement of the specific objectives 3) and 4).. -. Chapter 4 presents the article “Operational conditions affecting formaldehyde and formic acid formation as by-products of hydrogen production via photoreforming of methanol”. It analyzes four factors affecting the production of intermediaries. It contributes to the achievement of the specific objectives 5) and 6).. -. Chapter 5 shows the Conclusions of doctoral work.. -. Chapter 6 presents the Bibliography used in this document..
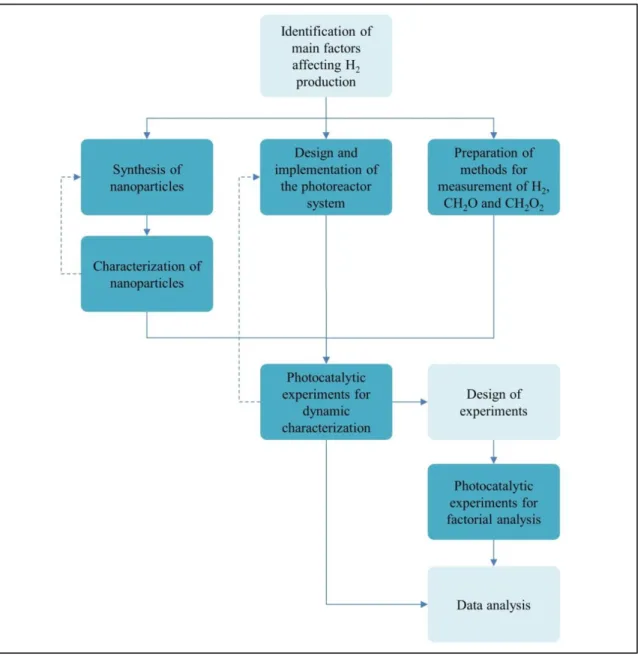
(28) 12. 1.5. General methodology. The methodology used in this research consists of three analytical stages and six experimental stages. They follow the sequence showed by the diagram in Figure 1.. Figure 1. Flowchart with the general methodology. Blue: experimental stage; light blue: analytical stage..
(29) 13. The stages are briefly described as follows: -. Identification of main factors: the first stage considered a bibliographic review to identify the main factors affecting hydrogen production in photocatalytic processes, and a further selection of controllable factors to include in the study.. -. Synthesis: commercial P25 TiO2 nanoparticles were modified with gold using a sol-gel approach described in detail in section 2.2.3. The method was adjusted iteratively until gold deposition and nanometric scale were reached.. -. Characterization: the resultant particles were analyzed by several techniques described in section 2.3. . UV-Vis spectroscopy to obtain the characteristic absorbance spectrum of the nanomaterial modified by gold.. . Scanning electron microscopy + electron dispersive spectroscopy (SEMEDS) to obtain the proportion of gold in the composite nanomaterial via elemental analysis.. . Inductively coupled plasma - atomic emission spectrometry (ICP-AES) to verify the proportion of gold via elemental analysis.. . Dynamic light scattering (DLS) to obtain the particle size distribution of the nanomaterial.. . Transmission electron microscopy (TEM) to obtain nanoscale images of the nanomaterial..
(30) 14. . Image processing analysis using software ImageJ (Rasband, n.d.) to obtain the particle size distribution of the gold nanoparticles over the titania surface.. -. Design and implementation of the photoreactor system: the fourth stage was to design the experimental set-up for photocatalytic reactions. Batch photoreactors were selected as the particulate system; located within an environment with temperature control at known atmospheric pressure. They were illuminated by UVLED lamps (375 nm) at known intensities. More details in sections 2.2.2.. -. Preparation of methods for measurement of main products: Hydrogen production was measured using gas chromatography (GC) and a U-tube manometer to follow in time the changes of gas pressure in the headspace of the reactor. A calibration curve was prepared for H2 production by GC and reported colourimetric methods were selected to measure the formaldehyde and formic acid production. Details about these methods are presented in sections 2.2.5 and 4.2.6.. -. Photocatalytic experiments for characterization of the reaction dynamic: Photocatalytic hydrogen production was confirmed and monitored during 6 hour experiments. This stage considered evaluation of kinetic rates, productivities and efficiencies. More details in sections 2.2.4 and 2.3.6.. -. Design of experiments (DOE) for factorial analysis: a half-fraction factorial completely randomized experimental design was selected to configure a set of possible combinations of factors to evaluate their influence on the hydrogen,.
(31) 15. formaldehyde and formic acid production. Every factor had two levels (high and low) and the selection of factor’s levels was based on literature review. More details in sections 3.2.4 and 4.2.4. Level selection and chosen combinations of factors are presented in sections 3.3.2 and 4.3.2. -. Photocatalytic experiments for factorial analysis: based on the set-up resulting from the previous stage, selected experimental combinations were run under UV illumination for 11 hours. After that, the main products were quantified. Summary of results are shown in sections 3.3.2 and 4.3.2.. -. Data analysis: data analysis of the experimental results was made via statistical analyses such as linear regression, analysis of variance (ANOVA) and the specific DOE package of Minitab 17®..
(32) 16. 2. HYDROGEN. PRODUCTIVITY. ANALYSIS. USING. LOW. CONCENTRATION OF TiO2-Au NANOPARTICLES ON A UV-LED BASED PHOTOCATALYTIC REACTOR 2.1. Introduction. The current global energy scenario has led the scientific community to look for more sustainable fuels as an attempt to decrease the anthropogenic CO2 emissions. Hydrogen has a relevant role in this task, but it implies big challenges. One of these tasks is to develop a sustainable production system, from the current fossil fuel based system which dominates the world’s hydrogen production. 95% (Balat, 2008) of hydrogen production is mainly based on gas steam reforming, oil reforming and coal gasification (Dincer & Acar, 2015). The photocatalytic hydrogen production via semiconductor nanoparticles that use sunlight as an energy source is an interesting option. Literature reports in this field are focused on the synthesis, characterization of properties and testing of nanomaterials able to photocatalyze the degradation of pollutants (Bansal, Chaudhary, & Mehta, 2015; Ling et al., 2015; Majidnia & Idris, 2015; Saud et al., 2015), water splitting reaction (Ahmad, Kamarudin, Minggu, & Kassim, 2015; Ortega Méndez et al., 2014; Rosseler et al., 2010) or photo reforming reaction (Daskalaki & Kondarides, 2009; Gunlazuardi & Dewi, 2014; Ni, Leung, & Leung, 2007; Oros-Ruiz, Zanella, López, Hernández-Gordillo, & Gómez, 2013), but information about catalyst performance in a very low range of concentrations.
(33) 17. (< 0.1 g·L-1) is scarce, which is a relevant factor to reduce costs in future real applications for hydrogen photo-production. Among the photocatalysts, the most studied material is titanium dioxide (Bowker et al., 2014; Clarizia et al., 2014; B. Gupta et al., 2016; S. Gupta & Tripathi, 2011; Jose, Sorensen, Rayalu, Shrestha, & Klabunde, 2013; Linsebigler, Lu, & Yates, 1995; Y. Wang, He, Lai, & Fan, 2014) thanks to its availability, corrosion resistance, non-toxicity, low price, high photoactivity and stability (Taboada, Angurell, & Llorca, 2014a), however its photocatalytic activity is limited to the ultraviolet region (B. Gupta et al., 2016). Catalytic properties of titania are improved using sacrificial agents or modification techniques. Organic species, like alcohols (Al-Azri et al., 2015; D’Elia et al., 2011; Dosado, Chen, Chan, Sun-Waterhouse, & Waterhouse, 2015; Taboada, Angurell, & Llorca, 2014b) and glycerol (Chang, Huang, Chen, Chu, & Hsu, 2015; Fujita, Kawamori, Honda, Yoshida, & Arai, 2016; Lyubina, Markovskaya, Kozlova, & Parmon, 2013; Sadanandam, Lalitha, Kumari, Shankar, & Subrahmanyam, 2013), are typical sacrificial agents to be used as electron donors or hole scavengers. Between the usual modification techniques to improve the photocatalytic process, three of them stand out: combination with metals (Pt (Beltram, Romero-Ocaña, Josè Delgado Jaen, Montini, & Fornasiero, 2015; Jung et al., 2015; Lu et al., 2015), Pd (Gomathisankar, Yamamoto, Katsumata, Suzuki, & Kaneco, 2013; X. Liu, Zhao, Domen, & Takanabe, 2014; H. Yan et al., 2009), Cu (Clarizia et al., 2014; Gomathisankar, Hachisuka, et al., 2013; Jung et al., 2015), Ni (Balcerski, Ryu, & Hoffmann, 2015; Xiying Li, Wang, Chu, Li, & Mao, 2014; Melián et al., 2014; Y. Xu &.
(34) 18. Xu, 2015), Rh (Gomathisankar, Hachisuka, et al., 2013; D. Wang et al., 2015; F. Zhang, Maeda, Takata, Hisatomi, & Domen, 2012), Ag (Ansari, Khan, Ansari, & Cho, 2015; S. Yang et al., 2016), Au (Al-Azri et al., 2015; Jovic, Chen, et al., 2013; Ortega Méndez et al., 2014; Sinatra et al., 2015), etc.), combination with other semiconductors (Cu oxides (J. Chen et al., 2014; Sinatra et al., 2015; Q. Wang et al., 2013), Ni oxides (Melián et al., 2014; Y. Xu & Xu, 2015), ZnO (Bel Hadjltaief, Ben Zina, Galvez, & Da Costa, 2016; Nsib, Naffati, Rayes, Moussa, & Houas, 2015; Roy, Lingampalli, Saha, & Rao, 2015), WO3 (Bai et al., 2015; Lam, Sin, Abdullah, & Mohamed, 2015; Chao Wang et al., 2015)), and cation or anion doping (Fujita et al., 2016; R. Liu, Yoshida, Fujita, & Arai, 2014). In recent years, gold nanoparticles have received great attention as co-catalysts due to their effectiveness in degrading and mineralizing organic compounds (Ayati et al., 2014) .They are comparatively cheaper than platinum, and their inherent plasmonic oscillation makes them photoactive in the visible region (B. Gupta et al., 2016). The gold loading, after deposition on semiconductor surfaces, exhibits movement of the Fermi level towards a more negative direction, which is a key factor for increasing the Schottky barrier effect or efficiency of charge-transfer, which in turn suppresses the e--h+ recombination (B. Gupta et al., 2016; Rajeshwar et al., 2002). In addition to the materials, a non-energy intensive synthesis method is necessary to project real size applications of this process. Considering the low rates of hydrogen production in these kinds of processes, compared with mature technologies, the use of atmospheric pressure and room temperature to modify titania nanoparticles is relevant for.
(35) 19. increasing the chance of economic feasibility and a positive net energy balance. Several methods are reported to synthesize gold supported catalysts. Some of them are impregnation,. coprecipitation,. deposition–precipitation,. deposition–reduction,. hydrothermal, photodeposition, gas phase grafting, solid grinding, physical vapor deposition, and cathodic arc plasma deposition (B. Gupta et al., 2016; Takei et al., 2012). Between this range of options, a conventional sol-gel chemistry approach was used, which was reported for antimicrobial coatings and surface-enhanced Raman scattering (SERS) tags (Fu, Vary, & Lin, 2005; W. Li, Guo, & Zhang, 2010a). This method stands out due to its low energy requirements, as opposed to methods with heat treatments, such as impregnation or hydrothermal treatments, high vacuum requirements, gas phase grafting or methods involving electrical demands, such as cathodic arc plasma deposition or sonochemical reduction (Mizukoshi et al., 2007; Takei et al., 2012). In this context, the goal of this study is to prepare and characterize TiO2 particles partially coated with gold nanoparticles synthesized with a conventional sol-gel method under mild conditions to explore the active mechanism of hydrogen photo-production via photoreforming of organic compounds and the catalyst productivity using a low concentration of nanoparticles in a methanol-water solution. Elemental composition, agglomeration status, and shape and size analyses are reported. The photocatalytic experiments use a batch experimental setup with 375 nm UV-light supplied by a low-consumption LED light based system, which can deliver seven times the UV intensity of light supplied by the sun (considering 1 sun = 100 mW∙cm-2 and 3% of the sun radiation on the UV range.
(36) 20. (Chowdhury, Gomaa, & Ray, 2011)) to increase the performance of particles synthesized at routine level. Photocatalytic experiments under visible light irradiation from cold-white LED lights with different amounts of gold are also given for comparing and analyzing the active mechanism. 2.2 2.2.1. Experimental Reagents. For TiO2-Au synthesis, Aeroxide® P25 Titanium(IV) oxide nanopowder (TiO2, 80% anatase, 20% rutile, Sigma AldrichTM), gold(III) chloride hydrate (HAuCl4•3H2O, Sigma AldrichTM), sodium borohydride (NaBH4, MerckTM), and tri-sodium citrate dehydrate (C6H5Na3O7•2H2O, MerckTM) were used as received without further purification. Hydrochloric acid fuming 37% for analysis (MerckTM) was used in a solution 0.1 N. Also, for photocatalytic reactions, methanol (CH3OH, MerckTM, analytical grade ACS, ISO, Reag. Ph Eur) was used without further purification. 2.2.2. Instruments. Composites were characterized using an UV-VIS photodiode array spectrophotometer Shimadzu, model MultiSpec-1501. Particle size distribution was measured using dynamic light scattering (DLS) analysis on a Malvern Zetasizer Nano ZS instrument. Microscopic images were obtained using a Philips Tecnai 12 Biotwin transmission electron microscope (TEM). Elemental analysis was done using a LEO 1420VP scanning electron microscope.
(37) 21. (SEM) with an electron dispersive spectroscopy (EDS) detector. The inductively coupled plasma - atomic emission spectrometry (ICP-AES) was made using a Varian Liberty Series II Axial. Image processing for determination of gold particle size distribution and morphological analysis was carried out using software ImageJ (Rasband, n.d.). The statistical analyses were conducted using software MinitabTM 17. Radiation measurements were developed using a PCE Instruments UVA-UVB radiation sensor, model PCE-UV34 and a StellarNet Miniature UV-VIS Spectrometer, model Black Comet Super Range Concave Grating Series. The photocatalytic reactor system was implemented within an incubator (Shin Saeng, model SBOD-201) as a controlled temperature chamber. The system is based on: two 50 mL Erlenmeyer flasks (total volume 68 mL) with GL18 screw caps with hole and septum of silicone as batch reactors; a humidity, temperature and barometric pressure USB datalogger Extech, RHT50; four 50 W UV-LED lights of 375 nm, Justar, model JX50UV10X5G, each one with aluminum heatsink, fan of 12 V for cooling and a LED driver; and four 3 W cold-white LED lights, model JDRE27 (emission spectrums in Figure - S 1 in annex I). Determination of hydrogen was made using a gas chromatograph DANI, model Master GC, equipped with a fused silica capillary column with molecular sieve of 5 A° Supelco, model Mol Sieve 5A PLOT, and a micro-volume thermal conductivity detector VICI, model TCD-NIFED-220DI. Evolution in real time of hydrogen concentration was calculated using a USB thermocouple datalogger Pico Technology, model TC-08, with.
(38) 22. two type K thermocouples, and a U-tube manometer (Range 250-0-250 mm H2O, resolution 1 mm H2O) with water as fluid. 2.2.3. Synthesis method. An adjusted method for synthesizing TiO2-Au nanoparticles was used, proposed by Fu (Fu et al., 2005) and Li (W. Li et al., 2010a). It is based on the chemical reduction of [AuCl4]over TiO2 surface using NaBH4 as a reducing agent. It works at room temperature and pressure. First, 100 mL of 0.2 mM TiO2 and 0.2 mM HAuCl4 colloidal suspension was prepared. HAuCl4 works as a gold precursor giving [AuCl4]- ions to the solution. After 5 minutes of an ultrasonic bath to avoid agglomeration, pH of the reaction media was adjusted to 2.2 by dropwise addition of 0.1 M HCl solution, to obtain a negative electric charge on the surface of TiO2 particles. After 5 more minutes of the ultrasonic bath, 1 mL of a 25 mM sodium citrate solution was added to the colloidal suspension in a roundbottom flask. After stirring for 5 minutes, 3 mL of 25 mM citrate and 0.1 M NaBH4 solution were added, showing a change of color from white to purple, and thus the reduced Au0 over the TiO2 particles surface was obtained, with a pH 4.5. After stirring for 10 minutes, the TiO2-Au obtained was analyzed to check if the expected UV-vis spectroscopy pattern (Jovic, Chen, et al., 2013; W. Li et al., 2010a) was obtained. Finally, after 5 minutes of the ultrasonic bath, the colloidal suspension was stored in darkness at 4°C..
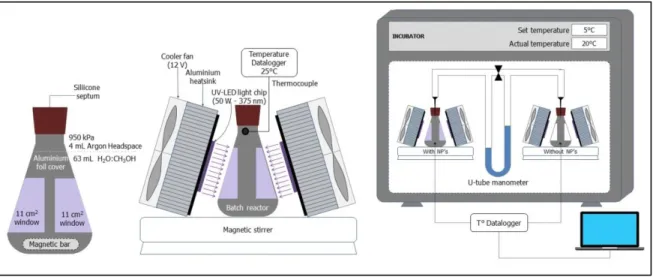
(39) 23. The described procedure leads to composites with TiO2:Au molar ratio 1:1. The full procedure was repeated to obtain nanoparticles in a molar ratio 20:1, increasing the amount of TiO2, keeping the amount of gold constant. 2.2.4. Photocatalytic experiments. The experimental unit was integrated by two batch reactors partially covered with aluminum foil with two 11 cm2 square windows. Both were filled with 63 mL of 1.2 M methanol-water solution, with a 4 mL headspace filled with argon gas at barometric pressure of 950 kPa (see Figure 2-left).. Figure 2. Experimental setup for hydrogen generation: (left) batch reactor; (center) UV-LED setting; (right) system configuration within the incubator. One of the reactors had a concentration of nanoparticles of 0.056 g∙L-1 and the second one did not have nanoparticles to catalyze the reaction. Both reactors were illuminated with.
(40) 24. two 375 nm UV-LED lights focusing on the windows, parallel to their surfaces, receiving an intensity of light of 20 mW∙cm-2 (3.78·1016 photons·s-1·cm-2) during 6 hours under slow stirring (see Figure 2-center). The headspaces on both reactors were connected by a glass manifold with a U-tube manometer to measure the differential pressure produced by the generated gases on the reactor with nanoparticles, which under these conditions, is proportional to the gas concentration. The manifold also had a by-pass valve in the middle to set the same initial pressure on both reactors (see Figure 2-right). The experiment was performed within the incubator with a temperature set at 5°C to increase the radiation delivered by the UV-LED lamps. The heat released by the lamps raised the temperature of the chamber to 20°C, and the temperature of the reactors to an average of 25°C. Intensity of light was regulated by the distance between the surface and the LED lamp. After 6 hours of reaction, the final hydrogen concentration was measured using gas chromatography in triplicate of 250 µL from the headspace of each reactor using the method described in next section. Evolution in real time of hydrogen concentration was calculated based on temperature and differential pressure. The same procedure was repeated using cold-white visible light, just changing the light source, keeping the intensity of light constantly at 20 mW·cm-2. 2.2.5. Measurement of hydrogen. A gas chromatographic method was developed for determining the amount of hydrogen gas using argon as a carrier gas. It consists in: oven temperature at 40°C, isotherm during.
(41) 25. 13 minutes, injector temperature at 40°C, thermal conductivity detector at 60°C, column flow at 1 mL/min constant during 12 minutes, and 1 minute at 50 mL/min. The calibration curve is given by Equation 1. nH2 = 0.001576 AGC + 0.5460. Equation 1. Where nH2 is the amount of moles of hydrogen gas in μmol and AGC is the area of the first peak obtained in the chromatogram, which appears at a retention time of 8.6 min. This method also allows the measurement of O2, N2 and CO. The concentration of H2 gas in the headspace of the photocatalytic reactor is obtained dividing nH2 by the volume of the syringe used for sampling; in this case, 250 μL. 2.3 2.3.1. Results & discussion Synthesis. Gold ions (Au3+) can be deposited over the surface of TiO2 particles by anionic adsorption. The amphoteric nature of TiO2 allows changing its surface electric charge with the change of pH value. This method uses acidic pH (2.2) under the TiO2 isoelectronic point (IEP), pH=6.0 (Zanella et al., 2002), as TiO2 surface becomes positively charged (with TiOH2+ as main surface species). The positive charges over the TiO2 induce the adsorption of [AuCl4]- anions. When the reducing agent is added (NaBH4), Au3+ from [AuCl4]- anions is reduced to Au0 over the TiO2 (Gómez-de Pedro, Puyol, Izquierdo, Salinas, & Alonso, n.d.). The reaction is shown in Equation 2 and Equation 3..
(42) 26. Equation 2. TiO2 + HAuCl4 TiO2-[AuCl4]- + H+ Equation 3. TiO2-[AuCl4]-+4NaBH4+12H2O TiO2-Au+4NaCl+4B(OH)3+29H+ 2.3.2. UV-Vis Absorption spectroscopy. Figure 3 shows the absorption spectra for TiO2 and TiO2-Au composites synthesized using two different molar ratios for [TiO2]:[Au]. Bare TiO2 did not show peaks at visible light region, unlike Au nanoparticles which presented a peak at 540 nm (W. Li, Guo, & Zhang, 2010b). After reduction of gold ions over the TiO2 surface, the TiO2-Au absorption spectrum presented a peak at 530 nm. Composites with a higher proportion of gold nanoparticles showed a higher peak and higher maximum peak wavelength. This is explained by the size of the gold nanoparticles and its influence on the surface plasmon resonance effect (SPR). As the size of gold nanoparticles increased, the maximum peak wavelength and its intensity also increased (Hong & Li, 2013), which agrees with the reported conclusion that the maximum peak wavelength red-shifts as the relative particle size increased (Cyrankiewicz, Wybranowski, & Kruszewski, 2007). The size of the gold nanoparticles is presented in the section about image processing analysis. These spectra are consistent with reported information in studies based in similar synthesis methods (Fu et al., 2005; W. Li et al., 2010b), being a first confirmation of metallic gold coating..
(43) 27. Figure 3. Normalized UV-visible absorption spectra of TiO2, TiO2-Au synthesized using molar ratio 1:1 ([TiO2]=0.2 mM), and TiO2-Au synthesized using molar ratio 20:1 ([TiO2]=4 mM). 2.3.3. Elemental analysis via EDS and ICP-AES. Figure 4 shows the EDS spectra for a sample of TiO2-Au synthesized in a molar ratio 20:1, ratifying the presence of Ti (46.54%wt), O (47.02%wt) and Au (6.45%wt). The results show that the measured content of Au was half the nominal value (12.3%wt) calculated with the quantities used during the synthesis. ICP-AES analysis indicates that in particles 20:1, 9.1%wt of the total mass is gold and 90.9%wt is TiO2. For particles 1:1 69.5%wt is gold and 30.5%wt is TiO2..
(44) 28. Figure 4. EDS spectra of TiO2-Au 20:1, confirming presence of Ti, O and Au.. 2.3.4. Particle size distribution of the aggregates by DLS analysis. Figure 5 shows the particle size distribution (as a function of the radius) from a DLS analysis on TiO2-Au aggregates synthesized using two different molar ratios and pH values. Results show that particle size of agglomerates increased with the amount of gold and pH. This supports the reported evidence which affirms that agglomerate size increases both with ionic strength and as the pH of the solution approached the IEP (H. H. Liu, Surawanvijit, Rallo, Orkoulas, & Cohen, 2011). This is because pH alters the colloidal stability of the nanoparticle system by modulating the protonation/deprotonation equilibrium and further altering the electrostatic repulsion (Dunphy Guzman, Finnegan, & Banfield, 2006; French et al., 2009; Zhou et al., 2013). For composites synthesized using a molar ratio 20:1, the peak in the particle size distribution shifted from 46 nm to 110 nm.
(45) 29. when pH changed from 2.2 to 4.5, closer to the IEP of TiO2. Synthesis using a lower molar ratio of 1:1 resulted in bigger agglomerates, with a peak at 71 nm when pH was 2.2, which shifted to 142 nm when pH was 4.5. Higher pH also increased the variability on the radius of agglomerates in a factor by 2.5, from 439 nm when pH was 2.2, to 1081 nm when pH was 4.5.. Figure 5. Particle size (radius) distribution results from DLS analysis for TiO2-Au aggregates synthesized with molar ratios 20:1 and 1:1, with synthesis pH level adjusted to 2.2 and 4.5.
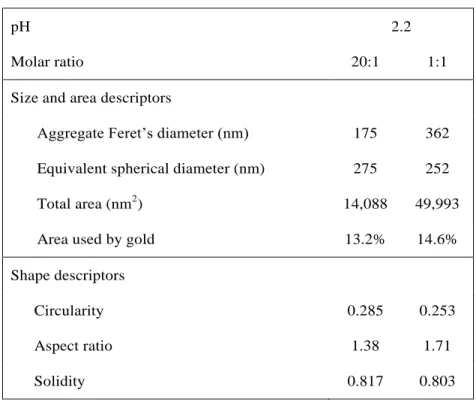
(46) 30. 2.3.5. Aggregates and gold coating characterization using TEM and image processing analysis. The TEM images in Figure 6 show TiO2-Au aggregates synthesized using [TiO2]:[Au] molar ratios 1:1 (left) and 20:1 (center) at pH 2.2 during the synthesis. It also shows an agglomerate of bare TiO2 (right). The images highlight the gold nanoparticles detected by ImageJ, which can be recognized by a smaller and more rounded shape than bare TiO2. Since particles are irregular, particle size is represented by the Feret’s diameter, the longest distance between any two points along the selection boundary, also known as maximum caliper (Ferreira & Rasband, 2012). The aggregate using 20:1 molar ratio has a Feret’s diameter of 175 nm and the one using 1:1 molar ratio, 362 nm, both within the range of values shown in Figure 5. In both cases, the shape analysis shows low circularity near 25% (1.0 indicates a perfect circle; 0.0 indicates an increasingly elongated shape), medium solidity around 80%, and high aspect ratio, highest in the case of 1:1 synthesis. Specific values of these descriptors are presented in Table 1. Image processing analysis showed similar TiO2 area covered by gold nanoparticles, both around 14%. It is important to highlight that ImageJ gives an area that represents the projection of the threedimensional particle over a plane, serving as an approximation to the actual percentage of surface covered by the gold particles..
(47) 31. Figure 6. TEM images for agglomerates TiO2-Au synthetized using a molar ratio [TiO2]:[Au] 1:1 and 20:1, analyzed with ImageJ, and an agglomerate of bare TiO2. Table 1. Size, area, and shape descriptors from image processing analysis. pH. 2.2. Molar ratio. 20:1. 1:1. Aggregate Feret’s diameter (nm). 175. 362. Equivalent spherical diameter (nm). 275. 252. Total area (nm2). 14,088. 49,993. Area used by gold. 13.2%. 14.6%. Circularity. 0.285. 0.253. Aspect ratio. 1.38. 1.71. Solidity. 0.817. 0.803. Size and area descriptors. Shape descriptors.
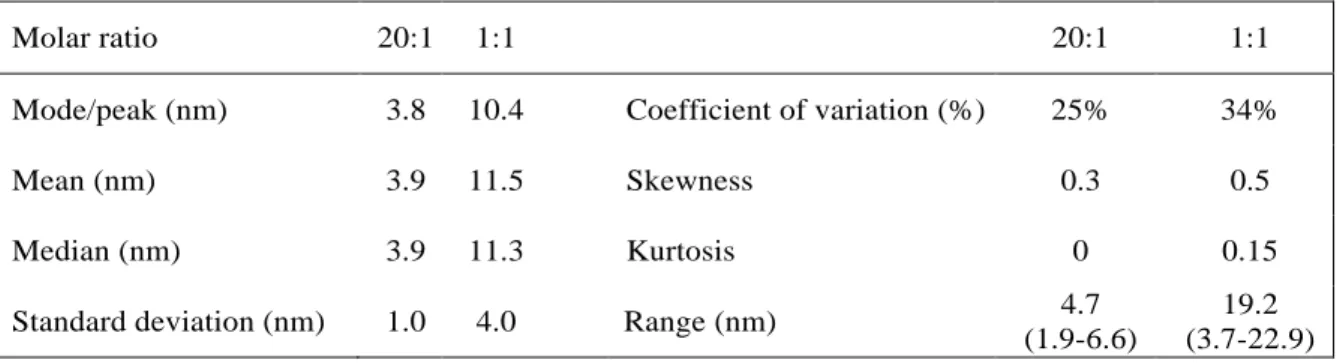
(48) 32. The images show a big difference between the sizes of gold particles deposited over the TiO2 when different molar ratios are used in the synthesis method; when lower molar ratio was used, there were bigger nanoparticles and less dispersion over TiO2 surface. Image processing analysis allowed dimensioning a sample of 180 nanoparticles in image type 20:1 and 280 nanoparticles in image type 1:1 to address a statistical analysis. The results are summarized on the histograms in Figure 7 and Table 2. The chart shows the particle size distribution for gold nanoparticles on the surface of TiO2 with normal distribution in both cases, centered on mean values 3.9 nm and 11.5 nm, respectively. The statistical significance of this 7.6 nm of difference was corroborated by applying an independent 2 samples t-test with a 95% confidence level. The fact that higher molar ratios resulted in smaller gold particles is consistent with earlier results from characterizations of gold coated TiO2 where authors used the same gold precursor, varying the molar ratio, but in a different synthesis method (Iliev, Tomova, Bilyarska, & Tyuliev, 2007; Jovic, Chen, et al., 2013), or even using a different core material (Lkhagvadulam, Kim, Yoon, & Shim, 2013). Also, in relation to the spreading of sizes in both distributions, it is clear that 20:1 synthesis ends in a much more homogeneous particle size than the 1:1 synthesis, which can be observed in the standard deviation (σ1:1 = 4.0 nm ; σ20:1 = 1.0 nm). The kurtosis near 0 is consistent with the normality of both distributions, and the not too flat, not too sharp peaks, and the positive but near to zero skewness, agree with the almost symmetrical shape of distributions..
(49) 33. Figure 7. Particle size distribution for gold nanoparticles on the surface of TiO 2-Au synthesized using molar ratios 20:1 and 1:1, with fitted curves for normal distribution centered on 3.9 nm and 11.5, respectively. Table 2. Measures of central tendency and dispersion for particle size distributions (Feret’s diameter) of gold nanoparticles from ImageJ analysis.. Molar ratio. 20:1. 1:1. Mode/peak (nm). 3.8. 10.4. Coefficient of variation (%). Mean (nm). 3.9. 11.5. Skewness. Median (nm). 3.9. 11.3. Kurtosis. Standard deviation (nm). 1.0. 4.0. Range (nm). 20:1. 1:1. 25%. 34%. 0.3. 0.5. 0. 0.15. 4.7 (1.9-6.6). 19.2 (3.7-22.9).
(50) 34. 2.3.6. Photocatalytic hydrogen production. TiO2-Au aggregates obtained with 20:1 and 1:1 molar ratios were tested in photocatalytic experiments (described in Figure 2) during 6 hours, by triplicate, under UV light and then under cold-white visible light. The H2 generation profile is shown in Figure 8 with a linear fitting through linear regression and a ±95% confidence prediction band.. Figure 8. Cumulative hydrogen generation profile showing zero-order kinetics with respect to H2 using UVlight for nanoparticles synthesized in ratios 20:1 and 1:1..
(51) 35. This linearity with time is indicative of high stability of the material related to the photocatalytic activity. UV-Vis absorption spectra for particles before (Figure 3) and after (Figure - S 2-S3) photocatalysis showed signs of a small degradation for the particles 20:1, decreasing the intensity of the Au-related peak, while a small shift toward lower energies was observed with the 1:1 nanoparticles This behavior can be sign of agglomeration too, but TEM images obtained after experiments (Figure - S 6 and S9) did not show big aggregation, only a reduction in gold presence. The linear behavior indicates a zero order kinetics in relation to the H2 production, which is consistent with a Langmuir-Hinshelwood mechanism, typical on heterogeneous catalytic systems (Dickinson, James, Perkins, Cassidy, & Bowker, 1999) where the photocatalytic reaction rate is independent of the reactants’ adsorption coverage (Iliev et al., 2007). Equation 4 shows a Langmuir–Hinshelwood kinetic model, modified to describe reactions occurring on the solid–liquid interphase surface:. 𝑟0 =. 𝑘𝑟 𝐾𝐶𝑒𝑞 𝑑𝐶 = 𝑑𝑡 1 + 𝐾𝐶𝑒𝑞. Equation 4. Where 𝑟0 is the initial rate of appearance of the product, 𝑘𝑟 is the limiting step rate constant of reaction at maximum coverage degree under the given experimental conditions, 𝐾 is the reactant adsorption constant and 𝐶𝑒𝑞 is the equilibrium bulk-solute concentration. Independence of reactant adsorption means a 𝐾𝐶𝑒𝑞 ≫ 1, so the active center of the catalyst is almost saturated with the reactant, thus the adsorbed form is in equilibrium with the reactant in the solution (Dickinson et al., 1999)..
(52) 36. For particles synthesized using molar ratio 20:1 under UV-light, the rate of hydrogen generation for the reactor was 24 µmol·h-1, which leads to an estimated reaction rate of 370 µmol·L-1·h-1. In terms of yields, the mass productivity of the catalyst (also called turnover rate (Maschmeyer & Che, 2010)) reached 6700 µmol·h-1·g-1. This value represents a fifth of the highest value reported in recent literature using a similar catalyst with ethanol as a sacrificial agent, but using 6 times higher catalyst concentration and 11 times higher alcohol concentration. Also, this result represents a third of the highest reported value using the same sacrificial agent, methanol, which used 18 times higher catalyst concentration, 5 times higher alcohol concentration, and a different type of titania as catalyst, 100% anatase and photoactive under visible light. The molar productivity of methanol was 310 µmol·h-1·mol-1. The overall energy conversion efficiency (Taboada et al., 2014a), defined as the energy stored as hydrogen divided by the incident photon energy was 0.5% and the apparent quantum yield (AQY) (Maschmeyer & Che, 2010) was 1.0% (formulas are shown in annex I). This low value could be tentatively ascribed to the high intensity of light supplied to the system, and to the high volume of free water within the reactor. When the photocatalytic system used particles with a higher proportion of gold (1:1, under UV-light), hydrogen production decreased a 72%: rate of hydrogen generation was 7 µmol·h-1, estimated reaction rate was 100 µmol·L-1·h-1, mass productivity of the catalyst was 1900 µmol·h-1·g-1, molar productivity of the methanol was 90 µmol·h-1·mol-1, overall energy conversion efficiency was 0.1% and AQY was 0.3%..
(53) 37. For both types of particles, the cold-white visible light from the LED lamp source was not able to catalyze the reaction. These results support a mechanism where the titanium dioxide is the one which captures the photons with enough energy to excite their valence electrons. Gold nanoparticles on the titania surface just helps to decrease the recombination of charge carriers, but they do not make the material photoactive under visible light. The observed gold loading dependence, with higher production rates on composites with smaller but more abundant gold particles (20:1), and the fact that both types of particles have similar TiO2 area covered by gold, support the reported thesis (Bowker et al., 2014) that active sites are located on the perimeter length around the metallic nanoparticles, in the TiO2-Au junction. An extra test with particles 20:1 was run using a higher concentration of particles under the same experimental conditions. It showed that hydrogen production is not proportional to the catalyst amount. With 10 times higher concentration (0.56 g·L-1), the system generated only 6.9 times more hydrogen. The screening effect between particles led to a lower mass productivity of the catalyst (4,600 µmol·h-1·g-1). Nonetheless, the system used the same light supply in a better way: the overall energy conversion efficiency increased to 3.2% and the AQY to 7.2%. Figure 9 and Table 3 compare the highest catalyst productivity obtained in this work, with reported data from recent literature about photocatalytic hydrogen generation using TiO 2Au nanoparticles, distinguishing the type of sacrificial agent used in each experiment..
(54) 38. Figure 9. Catalyst productivity, also called turnover rate, reported in the literature for photocatalytic hydrogen generation using TiO2-Au catalysts, compared to the results of this work..
(55) 39. Table 3. Comparative summary of experimental conditions and main results for recent literature reporting photocatalytic hydrogen generation using TiO2-Au nanoparticles, organized by catalyst productivity. Reference. Catalyst productivity. Sacrificial agent productivity. Sacrificial agent. Type of titania (Anatase/Rutile). μmol·h-1·g-1 μmol·h-1·mol-1 (Jovic, Chen, et al., 2013) (Jovic, Al-Azri, et al., 2013). 34,000 33,400. (Dosado et al., 2015). 32,200. (Al-Azri et al., 2015). 29,800. (Ortega Méndez et al., 2014). 20,572. (Su et al., 2014). 19,600. (Al-Azri et al., 2015). 17,600. (Sinatra et al., 2015). 12,000. (Rosseler et al., 2010) (Murdoch et al., 2011). 7,200 6,930. This work. 6,700. (Jose et al., 2013). 6,275. (Gomathisankar, Yamamoto, et al., 2013) (Bamwenda, Tsubota, Nakamura, & Haruta, 1995) (Jose et al., 2013) (Oros-Ruiz et al., 2013) (Oros-Ruiz, Zanella, Collins, HernándezGordillo, & Gómez, 2014) (Taboada et al., 2014a) (Taboada et al., 2014b) (Taboada et al., 2014b) (Waterhouse et al., 2013) (Cihlar & Bartonickova, 2013) (Melvin et al., 2015). P25Degussa 860 EtOH 13.7 / 80% (85/15) P25Degussa 845 EtOH 13.7 / 80% (85/15) P25Degussa 764 EtOH 13.7 / 80% (85/15) P25Degussa 7,079 Glycerol 1.4 / 10% (85/15) AnataseKronosVlp 3,329 MetOH 6.2 / 25% (100/0) P25Degussa 11,460 Glycerol 3.4 / 25% (--/--) P25Degussa 2,314 MetOH 2.5 / 10% (85/15) Ethylene AnataseSynthesized 7,894 0.9 / 5% glycol (100/0) P25Degussa 29,127 MetOH 0.2 / 1% (80/20) AnataseSynthesized 234 EtOH 3.9 / 23% (100/0) P25SigmaAldrich 310 MetOH 1.2 / 5% (80/20) P25Degussa 5,495 EtOH 0.9 / 5% (75/25). 5,000. 2,500 Glucose. P25Degussa (75/25). 4,059. 1,380 EtOH. P25JapanAerosil (--/--). 3,200. 1,942 MetOH. 1,866. 75 MetOH. 1,204. 35 MetOH. 948. 36 EtOH. 900. 103 EtOH. 849 400. Sacrificial agent concentration M / %vol.. 74 MetOH 1,362 EtOH. 399. 112 MetOH. 307. 25 MetOH. P25Degussa (75/25) P25Degussa (--/--) P25Degussa (70/30). Catalyst concentration. Gold loading. Modification method. Primary wavelength. Light intensity. AQY ***. g·L-1. %wt. **. ηm. mW·cm-2. %. 0.347. 1%. DPU+C. 365. 6.5. NR. 0.347. 2%. DPU+C. 365. 6.5. NR. 0.325. 1.5%. DPU+C. 365. 6.5. NR. 0.325. 1%. DPU+C. 365. 5. NR. 1. 0.8%. PD+D. 365. --. 17.6%. 2. #. SI+D. 365. 217. 70%. DPU+C. 365. 5. NR. GR. 365. 8. 7%. 1%. 0.325. 1%. 0.56. 2%##. 1. 2%. DAE+C. Vis. 30. NR. 0.13. 4%. DPU+C. 350. 1.5. NR. 0.056. 9.1%. SG. 375. 20. 1.0%. 0.75. 1%. SMAD+C. --. --. NR. 1.0 / --. 0.5. 5 ppm. PD. 365. 5. NR. 5.0 / 29%. 1.7. 1%. PD+VD. 276-342. 30. NR. 1.2 / 5%. 0.75. 1%. SMAD+C. --. --. NR. 12.4 / 50%. 0.5. 0.5%. DPU+C. 254. 2.2. NR. 17.1 / 69%. 0.5. 0.5%. DPU+VD. 254. 2.2. NR. 0.5. 1%. IWI+C. 365. 0.2*. 20.8%. 1.5. 1%. IWI+C. 365. 0.2*. 38%. 1.5. 1%. IWI+C. 365. 0.2*. 36%. 0.29. 2%. DPU+C. UV+Vis. 0.35. 80%. 1.67. 0.02%. GAR+C. 300-700. 14.4. NR. 0.5. 1%. PD+D. 370-640. 100. 1.5%. AnataseSynthesized 13.1 / 76% (97/3) AnataseSynthesized 13.1 / 76% (97/3) AnataseSynthesized 17.1 / 69% (97/3) Inverse opal 0.1 / 1% (--/--) AnataseSynthesized 5.9 / 24% (82.6/17.4) P25Degussa 6.2 / 25% (--/--) P25Degussa 0 / 0% (--/--). (J.-J. Chen, Wu, Wu, 30(UV) 8 -- None 1.43 3% PD+VD UV+Vis NR & Tsai, 2011) 1680(vis) (--) No information available (*) per fiber (**) Methods: DPU = Deposition-precipitation with urea; PD = Photodeposition; SI = Sol-immobilization; GR = galvanic replacement; DAE = direct anionic exchange; SG = sol-gel; SMAD = solvated metal atom dispersion; IWI = incipient wetness impregnation; GAR = glucose-assisted reduction; C = calcination; D = Drying; VD = vacuum drying. (***) AQY: apparent quantum yield. AQY = 100 x 2 x H2 molecules out / photons in. NR = not reported, nor estimable due to the lightened reactor surface is not reported. (#) Cocatalyst: Au+Pd (##) Cocatalyst: Au+Cu2O.
Figure
![Figure 3. Normalized UV-visible absorption spectra of TiO 2 , TiO 2 -Au synthesized using molar ratio 1:1 ([TiO 2 ]=0.2 mM), and TiO 2 -Au synthesized using molar ratio 20:1 ([TiO 2 ]=4 mM)](https://thumb-us.123doks.com/thumbv2/123dok_es/7312968.449756/43.918.179.838.172.590/figure-normalized-visible-absorption-spectra-synthesized-using-synthesized.webp)

+7


Documento similar