NuSTAR Observations of WISE J1036+0449, a Galaxy at z~1 Obscured by Hot Dust
15
0
0
Texto completo
(2) The Astrophysical Journal, 835:105 (15pp), 2017 January 20. Ricci et al.. 1. INTRODUCTION. DOGs is comparable to that of type 1 AGNs with similar luminosities at redshifts 2 < z < 4 (Stern et al. 2014; Assef et al. 2015). The most luminous known galaxy in the universe, WISE J2246-0526 (L bol = 3.5 ´ 1014 L ; Tsai et al. 2015), is a hot DOG. Recent ALMA observations of this object have found evidence of wide velocity spread, consistent with strong turbulence or isotropic outflows, which implies that the system is blowing out its interstellar medium and might be in the process of becoming an unobscured quasar (Díaz-Santos et al. 2016). Hot DOGs may therefore represent a key phase in the evolution of AGNs. In AGNs, much of the X-ray emission is produced in a compact region very close to the SMBH (10 rG , where rG is the gravitational radius of the SMBH; Zoghbi et al. 2012; De Marco et al. 2013). X-ray observations are therefore a potent tool to infer the line-of-sight column density to the central engine (NH ). The relation between the bolometric and X-ray output of hot DOGs also sheds light on the physical conditions of the X-ray emitting plasma. Hot DOGs are therefore excellent laboratories for probing the structure of the accretion flow at the highest luminosities, although they are not yet well studied in the X-ray band, with only a handful having been observed by X-ray facilities to date. Stern et al. (2014) reported on two hot DOGs observed with the Nuclear Spectroscopic Telescope Array (NuSTAR) and XMM-Newton and an additional source observed only by XMM-Newton. All three targets are at z ~ 2. Neither target observed by NuSTAR yielded a significant detection, while two of the three objects were faintly detected by XMM-Newton, implying that the sources are either X-ray weak or heavily obscured by column densities NH 10 24 cm-2 . Similar results were obtained by Piconcelli et al. (2015), who studied a 40ks XMM-Newton spectrum of WISE J1835+4355, a hot DOG at z=2.298, and found NH 10 23 cm-2 , with the source likely being reflection dominated (L. Zappacosta et al. 2016, in preparation). Recently, Assef et al. (2016) found evidence of similar levels of obscuration in the X-rays for another hot DOG, WISE J0204–0506 (z=2.100), using a serendipitous off-axis Chandra observation (160 ks exposure). To better constrain the X-ray absorption of hot DOGs and hence their intrinsic X-ray luminosities, it is necessary to obtain reliable detections at E 10 keV, where their emission is less affected by neutral gas absorption (e.g., Annuar et al. 2015; Lansbury et al. 2015; Puccetti et al. 2016; Ricci et al. 2016a, 2016b; Tanimoto et al. 2016). The simplest way to do this is to observe brighter, lower-redshift sources. However, Assef et al. (2015) show that the number of hot DOGs at such redshift is very small, in part due to an inherent bias in their selection function, with fast space density evolution also a likely contributing factor. Furthermore, hot DOGs that happen to be at lower redshifts are biased toward being much less luminous than their higher-redshift counterparts, due, at least in part, to the strict requirements of the selection function on the W1 flux. A new selection technique, as discussed in the following section, allows identification of a significant population of hot DOGs at z ~ 1 (R. J. Assef et al. 2016, in preparation). We report here on the study of one of these new objects, WISE J103648.31+044951.0 (WISE J1036+0449). In this paper, we show that, like the SED of hot DOGs at higher redshift, that of WISE J1036+0449 at z=1.009 peaks in the mid-IR. Exploiting three NuSTAR observations, we are able to constrain the line-of-sight column density and its intrinsic. Supermassive black holes (SMBHs) are known to reside at the centers of most galaxies (e.g., Kormendy & Richstone 1995; Magorrian et al. 1998; Tremaine et al. 2002) and are believed to play an important role in the evolution of their host galaxies during an active phase in which they accrete matter (e.g., Ferrarese & Merritt 2000; Gebhardt et al. 2000; Kormendy & Ho 2013). During such phases, they are observed as active galactic nuclei (AGNs). In the most luminous AGN, accretion is likely triggered by major galaxy mergers (e.g., Treister et al. 2012). An important stage in the life-cycle of SMBHs is believed to happen during a dust-enshrouded phase, when SMBHs accrete most of their mass, before blowing out the material (e.g., Martínez-Sansigre et al. 2005; Glikman et al. 2007; Urrutia et al. 2008; LaMassa et al. 2016) and evolving into a blue unobscured source (e.g., Hopkins et al. 2006). During this obscured phase the system is expected to be extremely bright in the infrared (IR). The first objects with these characteristics were discovered in large numbers by the Infrared Astronomical Satellite (IRAS) and are called luminous [LIR (8–1000 m m) = 1011–1012 Le] and ultra-luminous (LIR = 1012–1013 Le) IR galaxies (LIRGs and ULIRGs, respectively; e.g., Sanders & Mirabel 1996; Farrah et al. 2003; Lonsdale et al. 2006; Imanishi et al. 2007; Veilleux et al. 2009). Subsequently, submillimeter galaxies (SMGs; e.g., Blain et al. 2002; Alexander et al. 2005; Casey et al. 2014) at z ~ 2–4 were discovered at longer wavelengths, while Spitzer surveys identified a population of dust-obscured galaxies at z ~ 2 (DOGs; e.g., Yan et al. 2007; Dey et al. 2008; Fiore et al. 2009; see also Toba et al. 2015 and Toba & Nagao 2016 for studies of DOGs selected using other facilities). More recently, the Wide-Field Infrared Survey Explorer satellite (WISE; Wright et al. 2010) surveyed the whole sky in four mid-IR bands, discovering new populations of hyperluminous (LIR = 1013–1014 Le; e.g., Eisenhardt et al. 2012; Hainline et al. 2014; Wu et al. 2014) and extremely luminous (LIR > 1014 L ; Tsai et al. 2015) IR galaxies (HyLIRGs and ELIRGs, respectively). This was accomplished by selecting objects that are faint or undetected in the W1 (3.4 μm) and W2 (4.6 μm) bands but bright in the W3 (12 μm) and W4 (22 μm) bands. Overall, ∼1000 of these sources were discovered across the entire extragalactic sky (i.e., ∼1 per 30 deg2; Eisenhardt et al. 2012). Spectroscopic redshifts for 115 “W 1W 2-dropouts” are currently available (Assef et al. 2015), and most of these objects are at z 1.5, with the current highest redshift z=4.601 (Tsai et al. 2015; Díaz-Santos et al. 2016). These sources are typically optically faint, and their IR spectral energy distributions (SEDs) peak at the rest-frame λ∼20 μm, implying dust hotter (T 60 K) than that in ULIRGs, SMGs, or DOGs. They are therefore referred to as hot DOGs (Wu et al. 2012). It has been shown that for these ELIRGs the 1–20 μm luminosity is always higher than the infrared luminosity above 20 μm (Tsai et al. 2015). The lack of a far-IR peak in their SEDs implies that the dominant energy sources are luminous heavily obscured AGNs and not extreme starbursts (Wu et al. 2012; Tsai et al. 2015). Hubble Space Telescope and Keck/ NIRC2 observations of hot DOGs show strong lensing is unlikely (Eisenhardt et al. 2012; Wu et al. 2014; Tsai et al. 2015; Fan et al. 2016b), while X-ray studies (Stern et al. 2014; Piconcelli et al. 2015; Assef et al. 2016, this work) show that they contain very powerful AGNs. The number density of hot 2.
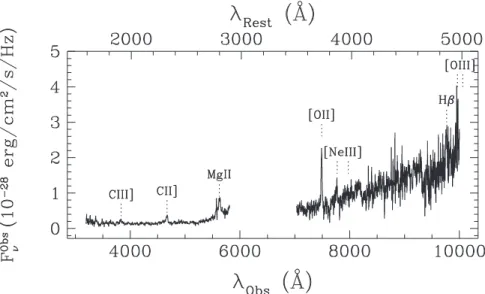
(3) The Astrophysical Journal, 835:105 (15pp), 2017 January 20. Ricci et al.. X-ray luminosity. WISE J1036+0449 is one of the closest hot DOGs known (z=1.009), and given its relative proximity, it could become an important case for a study of this interesting population of AGNs. The paper is structured as follows. In Section 2 we describe the selection method and show that the SED of WISE J1036 +0449 is consistent with those of other hot DOGs. In Sections 3 and 4 we report on the X-ray observations available and on the X-ray spectral analysis, respectively. In Section 5 we discuss the possible intrinsic X-ray weakness of Hot DOGs and their absorption properties, while in Section 6 we report our conclusions. Throughout the paper we use Vega magnitudes and adopt standard cosmological parameters (H0 = 70 km s-1 Mpc-1, Wm = 0.3, WL = 0.7). Unless otherwise stated, all uncertainties are quoted at the 90% confidence level.. not meet the hot DOG selection criteria because it is too bright in the W1 band. In the next sections, we discuss some of the follow-up observations carried out to demonstrate that it is a bona fide hot DOG in the targeted redshift range. 2.1. Spectroscopic Follow-Up of WISE J1036+0449 2.1.1. Optical Spectroscopy. Optical spectroscopy for WISE J1036+0449 was obtained on UT 2012 April 20 using the Low-Resolution Imaging Spectrometer (LRIS; Oke et al. 1995), which has a slit width of 1.5 arcsec, at the Keck Observatory. The data were reduced using the standard IRAF36 tools. The spectrum (Figure 2) shows a red continuum and several well-detected narrow emission lines. From blue to red, these are C III]λ1909 Å, C II] λ2324 Å, Mg IIλ2798 Å, [O II]λ3727 Å, [Ne III]λ3869 Å, Hβ, and [O III]λ4959 Å. Using these emission lines, we estimate a redshift of z = 1.009 0.002, fully consistent with the redshift range expected.. 2. SOURCE SELECTION AND SED Assef et al. (2015) presented the redshift distribution of a large sample of hot DOG candidates, showing that it is bimodal, with almost all confirmed hot DOGs at z ~ 2–4 and a small number of apparent contaminant sources at z 0.5. There is a significant dearth of hot DOGs in the z ~ 1–2 redshift range, and Assef et al. (2015) argue that while a strong redshift evolution toward this redshift range is likely, the results could be in part driven by an inherent bias against z 2 objects in their selection function. As discussed in detail by Eisenhardt et al. (2012), hot DOGs are selected based purely on their WISE magnitudes (specifically those from the All-Sky Data Release35), without the use of supporting observations. Hot DOGs are required to have W1 > 17.4 mag and satisfy either (i) W 3 < 10.6 mag and W 2 - W 3 > 5.3 mag or (ii) W 4 < 7.7 mag and W 2 - W 4 > 8.2 mag. The requirement of faintness in the W1 and W2 bands strongly biases the sample against the most luminous z ~ 1 objects, where W1 would sample the rest-frame 1.6 μm maximum of the host-galaxy stellar emission. Such biases must be considered when studying the redshift and luminosity evolution of this population. To mitigate these biases, we have devised a complementary WISE color selection function which allows us to target hot DOGs at z ~ 1–2. Specifically, we select objects whose AllSky Data Release magnitudes meet the following three requirements: (i) W1 < 17.4 mag, (ii) W 1 - W 3 > 7 mag, and (iii) W 1 - W 4 > 10 mag. The color requirements were chosen to specifically select objects in the z ~ 1–2 range with IR SEDs similar to that of WISE J1814+3412 (Eisenhardt et al. 2012), which is one of the best-studied hot DOGs in the literature. Requirement (i) makes the selection function complementary to that of z > 1.5 Hot DOGs (which have W1 > 17.4 mag) and reflects the fact that deeper Spitzer IRAC detections of z>1.5 hot DOGs (Assef et al. 2015; Tsai et al. 2015) imply that z∼1 sources with similar SEDs will be detected by WISE at this level. There are only 153 objects in the entire extragalactic sky that meet these criteria, and an extensive follow-up campaign is underway to assess the completeness and contamination of this selection. These results will be reported in detail elsewhere (R. J. Assef et al. 2016, in preparation). One of the first objects selected according to the criteria defined above is WISE J1036+0449 (Figure 1), which would 35. 2.1.2. Near-IR Spectroscopy. We also obtained near-IR spectroscopy for WISE J1036 +0449 on UT 2016 January 27 using the NIRSPEC instrument (McLean et al. 1998) at the Keck Observatory. Observations were carried out in the J band using the 42″ ×0 57 longslit in the low-resolution mode, and the source was observed for a total exposure time of 4×500 s in an ABBA sequence. The observations were reduced using a combination of the IRAF NIRSPEC tools provided by the Keck Observatory37 and the standard IRAF tools. Wavelength calibration was done using the sky emission lines. 2.1.3. Optical and Near-IR Spectral Analysis. The emission features observed in the optical spectrum, particularly the presence of C III] and Mg II, strongly imply that WISE J1036+0449 is an obscured AGN (e.g., Stern et al. 1999). Such spectral characteristics are commonly observed in hot DOGs (Wu et al. 2012; Assef et al. 2016; P. R. Eisenhardt et al. 2016, in preparation), supporting the idea that WISE J1036+0449 belongs to this class of objects. The Mg II emission line has a significantly broad base, implying that part of the broad-line region emission might be visible despite the large amount of obscuration toward the accretion disk. Assuming that Mg II is broadened by the gravitational potential of the SMBH, and using the McGill et al. (2008) calibration, we find that the black hole mass is MBH 2 ´ 108 M (see J. W. Wu et al. 2016, in preparation, for details of the interpretation of broad lines in hot DOGs). Such a broad base is not visible, however, for the Hβ emission line. In the following we discuss the near-IR spectrum of the source and show that for Hα, the signal-to-noise ratio is too low to definitively measure the line width but might be broad enough to warrant an intermediate AGN classification for this object. We caution, however, that such an intermediate-type classification might be due not to a lower obscuration, but to reflected light from the central engine, as in the hot DOG studied by Assef et al. (2016). We note that the [O II] doublet has an observed-frame width of approximately 20 Å, which is 36 37. http://wise2.ipac.caltech.edu/docs/release/allsky/. 3. http://iraf.noao.edu/ ftp://ftp.keck.hawaii.edu/pub/ObservingTools/iraf/keck.tar.gz.
(4) The Astrophysical Journal, 835:105 (15pp), 2017 January 20. Ricci et al.. Figure 1. Images of the field around WISE J1036+0449 from the hard X-rays to the far-IR. From top to bottom, the panels show the images obtained by NuSTAR FPMA (3–24 keV); Swift/XRT (0.3–10 keV); the SDSS r-band (6231 Å); WISE band 1 (3.4 μm), band 2 (4.6 μm), band 3 (12 μm), and band 4 (22 μm); and CSO (350 μm). The NuSTAR image was obtained by combining three observations, as described in Section 4, and was smoothed with a Gaussian kernel of a radius of 12 pixels. The SDSS image was smoothed with a Gaussian kernel of a radius of 2 pixels. The CSO image shows the signal-to-noise ratio per pixel. The crosses show the position of WISE J1036+0449, while the circles on the bottom right show the size of the beam. In all images, north is up and east is left.. 4.
(5) The Astrophysical Journal, 835:105 (15pp), 2017 January 20. Ricci et al.. Figure 2. UV/optical spectrum of WISE J1036+0449, obtained with the LRIS instrument at the Keck Observatory. See Section 2.1.1 for details.. Figure 3. Near-IR Keck/NIRSPEC spectrum of WISE J1036+0449 (see Section 2.1.2 for details). The dashed line shows the error spectrum.. greater than the spectral resolution of ∼10 Å of the observations. No asymmetry is observed, as could be expected for quasar outflows. The excess width of ∼17 Å implies an FWHM of approximately 700 km s-1. Such width is consistent with what would be expected for emission associated with the narrow-line region of a quasar. However, in less extreme galaxies, [O II] is typically related to star formation in the host galaxy (see, e.g., Kauffmann et al. 2003), implying that it could be due to turbulence in the interstellar medium. Recently, DíazSantos et al. (2016) used ALMA to study the [C II]λ157.7 μm emission line in the hot DOG W2246–0526 at z=4.601 (Tsai et al. 2015). Díaz-Santos et al. (2016) found an FWHM of 600 km s-1 for this emission line and showed that this is consistent with strong, [C II]-emission-region-wide turbulence in the interstellar medium of the galaxy. The near-IR spectrum (Figure 3) shows a clear detection of the Hα emission line as well as of the [N II]λλ6549, 6583 Å and [S II]λλ6717, 6731 Å doublets, although the S/N of the spectra is too low to accurately measure the line widths, as was done in the optical. The observed features are consistent with what would be expected for a type 2 AGN, as implied by the. optical spectrum. The emission lines show a small systematic offset to the red, suggesting a slightly larger redshift closer to z=1.010, which is consistent with the optical value within the uncertainties. The continuum level at the blue end of the nearIR spectrum seems to be a factor of ∼4 below that at the red end of the optical spectrum. While no effort has been made to take into account the variations of the seeing between the science and calibration targets, which could have resulted in biases to the absolute level of the flux calibration, such a large difference could imply that the host galaxy is significantly more extended than the slit width of 0 57 (4.6 kpc) in the J band. 2.2. UV through Far-IR SEDs of WISE J1036+0449 One of the main characteristics of hot DOGs is their distinctive multi-wavelength SED (see Eisenhardt et al. 2012; Wu et al. 2012; Jones et al. 2014; Assef et al. 2015; Tsai et al. 2015). In these objects the rest frame mid-IR through far-IR is dominated by emission from a highly obscured, hyperluminous AGN, with little to no contribution from a cold-dust component that would be traditionally associated with star formation in the host galaxy. The optical, on the other hand, is typically 5.
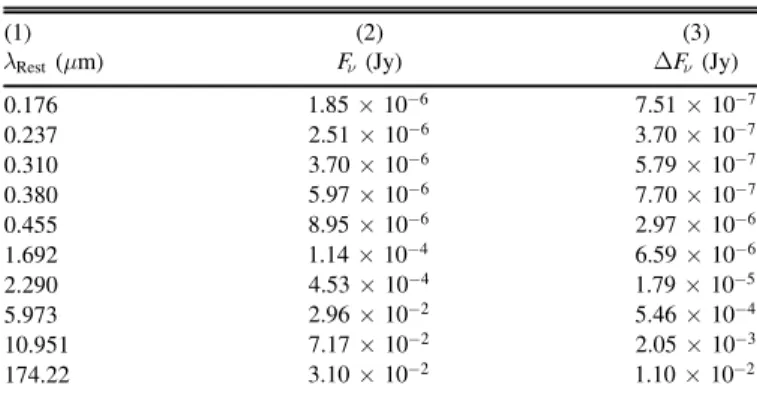
(6) The Astrophysical Journal, 835:105 (15pp), 2017 January 20. Ricci et al. Table 1 Multi-wavelength Photometry (1) lRest (μm) 0.176 0.237 0.310 0.380 0.455 1.692 2.290 5.973 10.951 174.22. Figure 4. Rest-frame UV through far-IR broadband SED of WISE J1036 +0449 (green triangles). The green triangles show the flux measured in the SDSS u¢r ¢g¢i ¢z ¢ bands, the four WISE photometric bands, and the CSO/ SHARC II 350 μm band. The red solid line shows the geometric mean SED of the sources studied by Tsai et al. (2015) using WISE and Herschel Space Observatory observations, scaled to the WISE photometry of WISE J1036 +0449. The cyan circles show the SED of WISE J1814+3412 (renormalized to a similar flux level of WISE J1036+0449 for comparison), while the light red region shows the range covered by all the sources in the study of Tsai et al. (2015). The SED is shown in nFn for comparison with that of Tsai et al. (2015).. (2) Fn (Jy). (3) DFn (Jy). 1.85 ´ 10-6 2.51 ´ 10-6 3.70 ´ 10-6 5.97 ´ 10-6 8.95 ´ 10-6 1.14 ´ 10-4 4.53 ´ 10-4 2.96 ´ 10-2 7.17 ´ 10-2 3.10 ´ 10-2. 7.51 ´ 10-7 3.70 ´ 10-7 5.79 ´ 10-7 7.70 ´ 10-7 2.97 ´ 10-6 6.59 ´ 10-6 1.79 ´ 10-5 5.46 ´ 10-4 2.05 ´ 10-3 1.10 ´ 10-2. Note. The columns report (1) the rest-frame wavelength, (2) the flux, and (3) the error on the flux.. where needed). The mean SED was fitted to the WISE photometry of WISE J1036+0449 for display purposes. The SED shape of WISE J1036+0449 is very similar to that of WISE J1814+3412 and qualitatively consistent with the mean SED of the Tsai et al. (2015) sources. The far-IR observations obtained with CSO show that WISE J1036 +0449 has a steeply dropping SED from rest frame ∼10 μm to ∼100 μm, which is one of the defining characteristics of the hot DOG population. This implies that cold-dust emission from star formation contributes negligibly to the integrated SED, as such a component would be expected to peak at ∼100 μm (see discussions in Wu et al. 2012; Jones et al. 2014; Tsai et al. 2015). Furthermore, the SED steadily drops between rest frame ~5 m m and ~1 m m , which is also, by selection, a defining characteristic of hot DOGs and most IR-luminous galaxies. The mid-IR WISE colors are, in fact, somewhat redder than those of the objects studied by Tsai et al. (2015), implying that they may be subject to even greater extinction (see Assef et al. 2015). The SED and the optical spectrum presented in Section 2.1.1 show that, although targeted with a different selection function, WISE J1036+0449 is a bona fide hot DOG. Due to its lower redshift and significantly higher flux (W 4 = 5.18 mag) with respect to other hot DOGs, WISE J1036+0449 is an ideal target for hard X-ray observations, which are able to probe the emission from the highly obscured AGN (e.g., Arévalo et al. 2014; Baloković et al. 2014; Gandhi et al. 2014, 2015b; Bauer et al. 2015; Koss et al. 2015).. dominated by the emission from the much less luminous host galaxy. The SED peaks at a rest-frame wavelength of ∼20 μm hence show extremely red colors between the optical/near-IR and the mid-IR but very blue colors between the mid-IR and far-IR. 2.2.1. Data and Comparison with the Typical SED of Hot DOGs. The UV through far-IR SED of WISE J1036+0449 is shown in Figure 4, and the photometry is listed in Table 1. The figure shows archival optical photometry in the u¢r ¢g¢i¢z ¢ bands from Sloan Digital Sky Survey Data Release 12 (Alam et al. 2015) as well as the mid-IR photometry in the four WISE bands from the AllWISE data release (Cutri et al. 2012). The WISE images, as well as the SDSS r ¢ image, are shown in Figure 1. We also obtained additional photometry for this target at 350 μm with the SHARC II instrument (Dowell et al. 2003) at the Caltech Submillimeter Observatory (CSO). We observed the target for 50 minutes on UT 2012 March 21 and for 40 minutes on UT 2012 December 15. The data are shown in Figure 1. The observations were analyzed in the same manner as in Wu et al. (2012), and a total flux density of 31 11 mJy was measured for the source.38 The photometry is shown in Figure 4 and reported in Table 1. Figure 4 also shows the SED of WISE J1814+3412 and the mean IR SED of the 20 hot DOGs studied by Tsai et al. (2015), which include the most luminous ones known to date with LIR > 1014 L and cataloged as ELIRGs (none of which has so far been studied in the X-ray band). These objects are at significantly higher redshifts than WISE J1036+0449, spanning the range of z=2.668 and 4.601, with an average of ázñ = 3.3. Tsai et al. (2015) presented observations obtained with the Spitzer IRAC instrument and with the Herschel Space Observatory PACS and SPIRE instruments in the 3.6, 4.5, 70, 160, 250, 350, and 500 μm bands. The SED shape has been obtained as the average of the fluxes of each source, interpolated through power laws in the rest-frame 1 μm to 100 μm wavelength range (with some slight extrapolation. 2.2.2. SED Fitting. The fact that the mid-IR SED emission is dominated by radiation produced in an accreting SMBH is confirmed by fitting the data with the AGN template of Mullaney et al. (2011), following the procedure outlined in Stanley et al. (2015). To reproduce the emission with a physical model, we fit the restframe SED of WISEJ1036+0449 with a combination of AGN torus (e.g., Schartmann et al. 2008; Hönig & Kishimoto 2010; Stalevski et al. 2012, 2016) and modified blackbody (BB) SEDs. The torus component is supplied by the widely used CLUMPY models,39 introduced in Nenkova et al. (2002, 2008a, 2008b), and is comprised of a collection of dusty clouds, each with. 38. We used IRC +10216 as a calibrator and adopted a calibration uncertainty of 20%.. 39. 6. www.clumpy.org.
(7) The Astrophysical Journal, 835:105 (15pp), 2017 January 20. Ricci et al.. Figure 5. SED fitting and Bayesian inference of model parameters. Upper left: maximum a posteriori (MAP) composite model (in black), comprised of an AGN torus component (blue) and a modified BB (red), fitted to all available data of WISEJ1036+0449 (green squares with error bars). The purple circles show the IRAS upper limits (Neugebauer et al. 1984). Upper right: same, but fitted to IR data only. Lower panels: marginalized posterior of all model parameters for the all-data model (black histogram) and the IR-only model (gray histogram). The solid and dotted vertical lines indicate the MAP values of each parameter for the two respective models. The SED is in Fn for consistency with the fitting procedure of Nikutta (2012). A detailed description of the different parameters and of the results obtained by the SED fitting is presented in Appendices A and C.. optical depth tV > 1 in the visual band (0.55 mm ). A detailed description of this model can be found in Appendix A. The SED fitting method is described in Appendix B. In the upper panels of Figure 5 we illustrate the best-fit SED (the maximum a posteriori likelihood model, MAP), i.e., the minimum reduced c 2 composite model (torus + BB). In the left upper panel all the available data points were fitted, while the right panel only considers the IR data (1.6 mm rest frame and beyond). The need to run a fit without optical/UV data arises since these wavelength regions are possibly contaminated by the host galaxy contribution. This is the case for most hot DOGs, as can be seen in Assef et al. (2015) and R. J. Assef et al. (2016, in preparation). The confidence contours obtained are shown in Figure 9. A notable difference in the spectral shapes of the two models is that in the all-data fit, the torus component produces a 10 mm silicate feature in weak emission, while the MAP model obtained with IR data alone shows a clear silicate absorption feature at 10 mm . Obtaining a spectrally resolved SED in that wavelength region could thus greatly assist in constraining the range of likely models. The posterior distributions of all parameters are shown in the lower panels of Figure 5. The empty histograms are for the all-data model in the upper left panel, and the gray ones are for the IR-only model. Vertical lines indicate the MAP values of each parameter for the two respective models. It should be remarked that the IR-only model would predict a flux higher than that of the sources studied by Tsai et al. (2015) in the 15–70 μm range. A detailed description of the results obtained by the SED fitting is presented in Appendix C.. 3. X-RAY OBSERVATIONS 3.1. NuSTAR NuSTAR (Harrison et al. 2013) carried out three observations of WISE J1036+0449 between 2014 November 1 and December 22 (see Table 2). The data obtained by the two focal plane modules (FPMA and FPMB) were processed with NuSTAR Data Analysis Software NUSTARDAS v1.4.1 within Heasoft v6.16, using the calibration files released on UT 2015 March 16 (Madsen et al. 2015). For each observation, cleaned and calibrated event files, together with exposure maps, were produced using NUPIPELINE following the standard guidelines. For each focal plane module, we merged the images of the three observations in the 3–24 keV band using XIMAGE, taking into account the exposure maps. The total on-source exposure time is 68.5 and 68.4 ks for FPMA and FPMB, respectively. The source is detected in both the 3–10 keV and 10–24 keV bands (at 4.6σ and 3σ, respectively). In the combined 3–24 keV image (Figure 1) the source is detected at the ~6s level. The source spectra and light curves were extracted using the NUPRODUCTS task by selecting circular regions 45 arcsec in radius centered on the position of the source reported in the WISE catalog (R.A., decl.: 159°. 20133, 4°. 83086), while for the background spectra and light curves, we used an annular region centered on the source with inner and outer radii of 90 and 150 arcsec, respectively. The source and background spectra, together with the RMF and ARF files for the three observations, were merged using the ADDASCASPEC task for both FPMA and FPMB. We then merged the FPMA and FPMB spectra, background, and responses. The final NuSTAR spectrum of WISE J1036+0449 is shown in the left panel of Figure 6. The 7.
(8) The Astrophysical Journal, 835:105 (15pp), 2017 January 20. Ricci et al.. Table 2 X-Ray Observation Log (1). (2). 1 1 2 2 3 3. NuSTAR Swift/XRT NuSTAR Swift/XRT NuSTAR Swift/XRT. model is. (3). (4). (5). 2014 Nov 01 10:01:07 2014 Nov 01 23:08:58 2014 Nov 02 00:11:07 2014 Nov 02 00:46:58 2014 Dec 22 20:21:07 2014 Dec 22 22:05:59. 60001156002 00080818001 60001156004 00080818002 60001156006 00080818003. 11.2 1.0 36.1 1.0 21.2 1.9. TBABSGal (ZPHABS. ´. CABS. ´. ZPOWERLAW. +. PEXRAV).. The fit results in a Cash statistic of C = 173 for 170 degrees of freedom (DOF). The value of the line-of-sight column density +11.9 23 -2 obtained is NH = 5.34.8 ´ 10 cm , while the rest-frame 2–10 keV intrinsic luminosity is 4.1 ´ 10 44 erg s-1. Assuming higher (R = 1) or lower (R = 0.1) values of the reflection component produces consistent values of the column density +9.4 23 cm-2 , (NH 2.0 ´ 10 24 cm-2 or NH = 6.75.0 ´ 10 respectively). We also applied the PLCABS model (Yaqoob 1997), which reproduces absorption considering a uniform spherical distribution of matter:. Note. The columns report (1) the observation number, (2) the X-ray facility, (3) the UT observation date, (4) the observation ID, and (5) the exposure time (in ks).. two FPM cameras detected a total of ∼120 backgroundsubtracted counts.. TBABSGal (PLCABS. 3.2. Swift/XRT. +. PEXRAV).. This model also produces a good fit to the data C DOF = 173.4 170 , and the column density obtained is NH 2.41 ´ 10 24 cm-2 .. The X-ray telescope (XRT; Burrows et al. 2005) on board Swift (Gehrels et al. 2004) carried out three short (1–2 ks each) observations of WISE J1036+0449, approximately simultaneously with NuSTAR. Swift/XRT data analysis was performed using XRTPIPELINE following the standard guidelines. We inspected the combined Swift/XRT images in the 0.3–1.5 keV, 1.5–10 keV, and 0.3–10 keV bands (Figure 1) and did not find any evidence of a detection of the source.. 4.2. MYTorus Next, we applied the MYTORUS model (Murphy & Yaqoob 2009) to self-consistently reproduce absorption and reflection assuming a smooth torus with a half-opening angle of qOA = 60. The model is composed of three additive and exponential table models: the zeroth-order continuum (MYTORUSZ), the scattered continuum (MYTORUSS), and a component containing the fluorescent emission lines (MYTORUSL). In XSPEC the model we used is. 4. X-RAY SPECTRAL ANALYSIS X-ray spectral analysis was performed using XSPEC v.12.8.2 (Arnaud 1996). We added to all models Galactic absorption in the direction of the source (NHGal = 2.9 ´ 10 20 cm-2 ; Kalberla et al. 2005), using the TBABS model (Wilms et al. 2000). We set the abundances to solar values. Due to the low signal-tonoise ratio of the observations, we used the Cash statistic (Cash 1979) to fit the data. The source spectrum was binned to have two counts per bin in order to avoid issues related to empty bins in XSPEC. As a first test, we fitted the spectrum with a simple powerlaw model. This resulted in a photon index of G = 1.2 0.5, lower than the value typically found for unobscured AGNs (e.g., Nandra & Pounds 1994; Piconcelli et al. 2005; Ricci et al. 2011) and symptomatic of heavy line-of-sight obscuration.. ´ {MYTORUSZ ´ + MYTORUSL}.. TBABSGal. ZPOWERLAW. + MYTORUSS. Applying MYTORUS and fixing G = 1.9 and the inclination angle to qi = 90 (which corresponds to an edge-on view in this geometry), we obtained C=172.7 for 170 DOF and a value of the column density consistent with the one inferred +8.1 23 -2 using PEXRAV (NH = 7.15.1 ´ 10 cm ). The X-ray spectrum of WISE J1036+0449 and the model used for the fit (both assuming G = 1.9) are shown in Figure 6 (left and right panels, respectively). The rest-frame 2–10 keV intrinsic luminosity of the best-fit MYTORUS model is 6.3 ´ 10 44 erg s-1.. 4.1. Pexrav We then fitted the data with a model that consists of an absorbed power law with a photon index fixed to G = 1.9, consistent with the average intrinsic value of AGNs (e.g., Nandra & Pounds 1994; Piconcelli et al. 2005; Ricci et al. 2011), and unabsorbed reprocessed X-ray emission from a slab (PEXRAV in XSPEC; Magdziarz & Zdziarski 1995). In this scenario the outer part of the accretion disk is producing the bulk of the reprocessed radiation. The value of the reflection component was fixed to R=0.5, while the inclination angle was set to qi = 30. Obscuration was taken into account by combining Compton scattering (CABS) and photoelectric absorption (ZPHABS). Due to the low S/N of the spectra, the Fe Kα line (at ∼3.2 keV in the observed frame), expected to arise from the reprocessing of the primary X-ray radiation in the circumnuclear material (e.g., Shu et al. 2010; Ricci et al. 2014; Gandhi et al. 2015a), could not be detected. In XSPEC the. 4.3. Sphere We then applied the SPHERE model (Brightman & Nandra 2011), which assumes that the X-ray source is fully covered by the obscuring material. The physical scenario associated with this model is that the AGN is quasiisotropically expelling the circumnuclear material because of the high radiation pressure, as proposed by Díaz-Santos et al. (2016) for WISE J2246−0526. In XSPEC the model is TBABSGal (ATABLE {SPHERE0708.FITS}).. We fixed G = 1.9 and found this model to give a good fit (C=173.1 for 170 DOF), supporting the observation that the +6.9 23 -2 source is heavily obscured (NH = 6.54.7 ´ 10 cm ). The rest-frame 2–10 keV intrinsic luminosity obtained with SPHERE is 4.0 ´ 10 44 erg s-1. 8.
(9) The Astrophysical Journal, 835:105 (15pp), 2017 January 20. Ricci et al.. Figure 6. Left panel: combined NuSTAR FPMA and FPMB spectrum of WISE J1036+0449 fitted with the MYTORUS model (assuming G = 1.9; see Section 4). The bottom panel shows the ratio between the data and the model. Right panel: spectrum of the MYTORUS model with the parameters fixed to those obtained by fitting the combined NuSTAR FPMA and FPMB spectrum. The dotted lines represent the primary X-ray emission (upper part of the figure), the scattered component (lower part), and the fluorescent lines. In both plots, the energies are in the rest frame of the source.. Figure 7. Left panel: values of the column density NH obtained by assuming different values of the photon index of the primary X-ray radiation for the PEXRAV, MYTORUS, and SPHERE models. The points obtained with the last two models have been shifted by DG = 0.03 for visual clarity. The dashed line shows the value of NH obtained from E (B - V ) by using Equation (1) (see also Table 3). Right panel: confidence intervals of the intrinsic 2–10 keV luminosity and the column density for WISE J1036+0449 obtained using the MYTORUS model. The continuous, dashed, and dotted lines represent the 68%, 90%, and 99% confidence contours, respectively. The black cross represents the best-fit value of the parameters.. the value of NH varies between NH 1.2 ´ 10 24 cm-2 and NH 4.7 ´ 10 23 cm-2 (Figure 7). Steeper slopes imply higher values of the column density. As shown in the figure (see also Table 3), this range of NH is in agreement with the column density estimated from the extinction E (B - V ), assuming the relation. 5. DISCUSSION We have reported here on the results obtained from the study of one of the closest hot DOGs known, WISE J1036+0449. In the following we discuss the obscuration (Section 5.1) and X-ray (Section 5.2) properties of this object and of those of hot DOGs in general.. E (B - V ) = 1.5 ´ 10-23 cm2 mag NH. 5.1. Obscuration in Hot DOGs. (1 ). reported by Maiolino et al. (2001; see also Burtscher et al. 2016 for a recent discussion on the subject). A well-known correlation exists between the photon index and the Eddington ratio (lEdd ), with the slope varying depending on the range of lEdd probed (see Figure 1 of Zhou 2015). For values of lEdd in the range 10-2.6–1 the correlation is positive (e.g., Shemmer et al. 2006; Brightman et al. 2013, 2016). For log lEdd -0.7 the relation between Γ and lEdd seems to be different from that at lower values of lEdd , and the average photon index is G ~ 1.9 (e.g., Ai et al. 2011; Kamizasa et al. 2012; Ho & Kim 2016). Assef et al. (2015) have shown. Studying the luminosity function of hot DOGs, Assef et al. (2015) have shown that hot DOGs have a space density similar to that of the most luminous (LBol 10 47 erg s-1) unobscured quasars. It is therefore important to constrain the absorption properties of this significant population of obscured quasars. We have shown in Section 2 that WISE J1036+0449 and hot DOGs at higher redshifts have very similar multi-wavelength characteristics, and they belong to the same class of AGNs. For the three X-ray spectral models discussed in Section 4 we also tested values of G = 1.6, G = 2.2, and G = 2.5, finding that, depending on the shape of the X-ray continuum, 9.
(10) The Astrophysical Journal, 835:105 (15pp), 2017 January 20. Ricci et al.. Table 3 X-Ray Properties of Hot DOGs (1) Source W0204−0506a W1036+0449a W1814+3412b W1835+4355a W2207+1939b W2357+0328b. (2) Redshift. (3) Facility. 2.100 1.009 2.452 2.298 2.021 2.113. C N X X X X. (4) NH (10 23 cm-2 ). (5) NHExt. (10 23 cm-2 ). (6) E (B - V ) (mag). (7) logL2–10 (erg s-1). (8) L 6 mm (erg s-1). +8.1 6.32.1 +8.1 7.15.1 L 10 L L. 6.5±0.8 8.4±0.3 10.1±1.0 2.9±0.2 11.7±1.5 3.7±0.3. 9.7±1.2 12.6±0.4 15.1±1.1 4.4±0.3 17.6±2.3 5.5±0.4. 44.90 [44.78–45.34] 44.80 [44.52–45.09] 44.84 [44.61–44.98] 44.85 44.78 44.52 [44.20–44.65]. 46.86 46.61 47.30 46.95 46.92 46.70. (9) Reference Assef et al. (2016) This work Stern et al. (2014) L. Zappacosta et al. (2016, in preparation) Stern et al. (2014) Stern et al. (2014). Notes. The table reports (1) the list of hot DOGs that have been observed in the X-ray band, (2) the values of the spectroscopic redshift, (3) the facility used (C: Chandra; N: NuSTAR; X: XMM-Newton), (4) the column density inferred from the X-ray spectral analysis, (5) the column density obtained from E (B - V ) using Equation (1), (6) the extinction, (7) the intrinsic rest-frame 2–10 keV luminosity and the 68% confidence interval, (8) the rest-frame 6 μm luminosity, and (9) the reference. The objects reported in the table are typically at lower redshifts and have lower luminosities than those reported in Tsai et al. (2015). a Sources for which the column density and the intrinsic 2–10 keV luminosity were inferred from the X-ray spectral analysis. For WISE J1036+0449 we reported the value obtained using the MYTORUS model (see Section 4.2). b Sources for which the column density was obtained from E (B - V ) using Equation (1) and the intrinsic 2–10 keV rest frame luminosity was extrapolated as illustrated in Appendix D.. that, unless hot DOGs deviate significantly from the local M –s relation, they radiate above the Eddington limit, with typical values of lEdd 2 (see Figure 8 of Assef et al. 2015 and Tsai et al. 2015 for discussions on the subject). The bolometric luminosity of WISE J1036+0449 from the SED is LBol 8 ´ 10 46 erg s-1, and considering the black hole mass estimated from the broadened Mg II (MBH 2 ´ 108 M), we find that the source is accreting above the Eddington limit (lEdd 2.7). It should be stressed that even an outflow origin of the broadening of Mg II would imply that the source is accreting at high values of the Eddington ratio. Therefore, we expect that G ~ 1.9 is a reasonable assumption for WISE J1036+0449 and for hot DOGs in general. Although, by construction, the selection function of hot DOGs would not identify low-obscuration objects, it should be able to select objects with NH > 10 24 cm-2 . As discussed by Assef et al. (2015), considering the values of E (B - V ) obtained by their analysis and Equation (1), the typical column densities of hot DOGs are expected to be in the range 1.7 ´ 10 23 < NH < 1.4 ´ 10 24 cm-2 . This is very different from the intrinsic column density distribution of local, less luminous AGNs, with the NH distribution of the former showing a sharp peak in the log (NH cm-2) = 23–24 range and very few Compton-thick (CT, NH 10 24 cm-2 ) objects, while local AGNs have a significantly more uniform distribution and a fraction of 27% ±4% of CT AGNs (Ricci et al. 2015, see also Koss et al. 2016). It should be remarked, however, that Ricci et al. (2015) have also shown that the fraction of local hard X-ray selected CT AGNs decreases with increasing values of the luminosity. To date, only a few direct measurements of the line-of-sight column density of hot DOGs have been performed (see Table 3), and they seem to be consistent with what was inferred by Assef et al. (2015), albeit with large uncertainties. The hyperluminous quasar IRAS 09104+4109 (LIR 5.5 ´ 10 46 erg s-1), recently observed by NuSTAR, also shows a column density in a similar range (NH ~ 5 ´ 10 23 cm-2 ; Farrah et al. 2016), while the HyLIRG IRAS F15307+3252 is significantly more obscured (NH 2.5 ´ 10 24 cm-2 ; Hlavacek-Larrondo et al. 2017) and shows a strong Fe Kα line (EW ~ 1–3 keV). A possible explanation for the difference between the column density distribution of local AGNs and that of hot. DOGs obtained from E (B - V ) could be related to differences in the dust-to-gas ratios. The circumnuclear material in hot DOGs might in fact be significantly more gaseous due to the higher luminosity, which would cause most of the dust in the inner few parsecs to sublimate. Fitting the X-ray spectrum of WISE J1036+0449 with the SPHERE model and setting NH = 10 25 cm-2 , we found a worse fit (C=194.7 for 171 DOF) than that reported in Section 4.3. It should be remarked that Gandhi et al. (2016) have recently shown, after studying the broadband X-ray spectrum of the LIRG NGC 7674, that even objects with weak Fe Kα lines could be heavily obscured and reflection-dominated. The model Gandhi et al. (2016) used for NGC 7674 can well reproduce the spectrum of WISE J1036 +0449 (C=175.0 for 171 DOF). It might therefore be possible that WISE J1036+0449 and other hot DOGs are significantly more obscured than inferred by current X-ray spectral analysis. Another explanation for the different column density distributions could be the following. For a given mass of gas and dust and assuming a homogeneous distribution of the material, it is more difficult to have CT lines-of-sight if the inner radius of the absorbing material is at larger distances from the X-ray source than that for local AGNs. The inner radius of the dust around hot DOGs can be calculated from the dust sublimation radius (e.g., Nenkova et al. 2008b): ⎞0.5 ⎛ 1500 K ⎞2.6 ⎛ L R d 0.4 ⎜ 45 bol -1 ⎟ ⎜ ⎟ pc, ⎝ 10 erg s ⎠ ⎝ Tsub ⎠. (2 ). where Tsub is the sublimation temperature of the dust grains. Considering silicate dust grains (Tsub = 1500 K) and the average bolometric luminosity of hot DOGs reported by Assef et al. (2015; áL bolñ 5 ´ 10 47 erg s-1), we find that the inner radius of the dust is ~9 pc . This is much larger than the typical value expected for Swift/BAT AGNs (Rd ~ 0.1–0.4 pc, considering LBol ~ 10 44–10 45 erg s-1). It should be remarked that, while these distances might be systematically smaller by a factor of ∼3, as found by near-IR reverberation studies (Kishimoto et al. 2007), the ratio between the Rd of local AGNs and hot DOGs would be the same. Therefore, if hot DOGs have a dust mass comparable to that of local AGNs and 10.
(11) The Astrophysical Journal, 835:105 (15pp), 2017 January 20. Ricci et al.. gas and dust are strongly coupled, a difference in the column density distribution is expected. While there might be a significant fraction of dust-free material within the sublimation radius, this material is also likely to be highly photo-ionized by the very luminous AGN. Moreover, as shown by Díaz-Santos et al. (2016) for WISE J2246−0526, it is possible that in hot DOGs, due to the strong radiation pressure, the gas is being blown away isotropically. Hot DOGs could be very different from local, less luminous AGNs, where the bulk of the gas and dust is believed to be distributed in a torus-like structure, and might represent a shortlived transition phase between heavily obscured and unobscured AGNs (Bridge et al. 2013), similar to red quasars (e.g., Urrutia et al. 2008; Banerji et al. 2012; LaMassa et al. 2016). The idea that this phase might happen following a major merger is supported by the recent results of Fan et al. (2016b) based on Hubble Space Telescope/WFC3 images. In a study of SCUBA observations, Jones et al. (2015) showed that hot DOGs have an excess of SMG neighbors, which would increase the chances of a merger. These results are in agreement with the idea that the AGN unification model might not be valid at high luminosities, where galaxy mergers are more important than secular processes in triggering accretion onto the SMBH (e.g., Treister et al. 2012).. Figure 8. Rest-frame 6 μm luminosity vs. intrinsic rest-frame 2–10 keV luminosity for several samples of AGNs: Hot DOGs from this work (big red circles; the red arrow represents the upper limit for WISE J2207+1939), broadlined AGNs from the SEXSI survey (Eckart et al. 2010; open green squares), luminous quasars from Just et al. (2007; large solid blue circles), Compton-thin AGNs observed by NuSTAR (Alexander et al. 2013; Del Moro et al. 2014; purple crosses), quasars from SDSS DR5 (Young et al. 2009; small blue dots), and local Seyfert galaxies (Gandhi et al. 2009; Asmus et al. 2015; red crosses). The lines illustrate five L 6 mm –L 2 – 10 keV relations (see Section 5.2 for details). The mid-IR luminosities of Asmus et al. (2015) were obtained at 12 μm. The figure shows that hot DOGs are significantly weaker in the X-ray band than unobscured quasars in the same 6 μm luminosity range.. 5.2. Are Hot DOGs Intrinsically X-Ray Weak? AGNs show a strong positive correlation between the 2–10 keV and the mid-IR luminosity (at 6 μm or 12 μm; e.g., Lutz et al. 2004; Ichikawa et al. 2012; Mateos et al. 2015), as confirmed by high angular resolution (∼0.35 arcsec) mid-IR studies (e.g., Gandhi et al. 2009; Levenson et al. 2009; Asmus et al. 2015) of AGNs in the Seyfert regime (L 6 m m < 10 44 erg s-1). In the quasar regime (L 6 m m > 10 44 erg s-1), Stern (2015) found evidence of a flattening of the relationship for L 6 m m 10 46 erg s-1, with most sources being fainter than expected in the X-ray band, in agreement with what was found by Fiore et al. (2009) and Lanzuisi et al. (2009). To reproduce this trend, Stern (2015) proposed a revised formulation, using a second-order polynomial to fit the data. A deviation of the mid-IR/X-ray correlation at high luminosities might be expected, considering the following arguments. The flux in the mid-IR is believed to be due to the reprocessing of optical, UV, and extreme UV photons by the gas and dust in the putative molecular torus; therefore, the main driver of the mid-IR/X-ray correlation is the relation between the optical/UV and X-ray flux, which has been analyzed by studies focusing on two related quantities: (i) the optical to X-ray flux ratio (aOX ), which is the ratio between the monochromatic 2 keV and 2500 Å luminosities, and (ii) the 2–10 keV bolometric correction (k x ). Recent works have shown that both aOX (e.g., Lusso et al. 2010) and k x (e.g., Vasudevan & Fabian 2007) depend on lEdd , with the optical flux increasing with respect to the X-ray flux for higher values of lEdd . This effect could be related to the different physics of the accretion flow and corona or to the fact that the X-ray source is saturated by the high rate of optical/UV photons produced by the accretion flow. According to the relation of Stern (2015), the expected 2–10 keV luminosity of WISE J1036+0449 would be log (L 2 – 10 keV erg s-1) 45.25, a value ∼3 times as high as. that obtained by our X-ray spectral analysis [log (L 2 – 10 keV erg s-1) 44.80]. To constrain the relation between the 6 μm and 2–10 keV luminosities for the three objects from Stern et al. (2014) that have been observed so far by X-ray facilities but for which no spectral analysis could be performed because of a low significance of detections, we calculated the intrinsic 2–10 keV luminosity from the value of NH obtained from E (B - V ) and the 0.5–10 keV observed flux. The procedure adopted is described in Appendix D. The values of L 2 – 10 keV , L 6 m m , NH , and E (B - V ) for all hot DOGs observed in the X-rays are listed in Table 3. A possible caveat of this approach is that, as mentioned in Section 5.1, it is still largely unknown whether in the extreme environments of hot DOGs the relationship between E (B - V ) and NH is consistent with that found for local AGNs by Maiolino et al. (2001). However, it should be remarked that the values of the column density obtained for WISE J0204−0506 and WISE J1036+0449 through X-ray spectral analysis are in agreement with those extrapolated from E (B - V ) (see Table 3 and Figure 7). A possible exception is WISE J1835+4355, which is significantly more obscured than what would be predicted by E (B - V ) (L. Zappacosta et al. 2016, in preparation). As shown in Figure 8, the absorption-corrected X-ray luminosities of all the hot DOGs (red circles) observed by X-ray facilities are significantly lower than the values expected from mid-IR/X-ray correlation, which implies that they might be either intrinsically X-ray weak or significantly more obscured than estimated. Hot DOGs are also significantly less 11.
(12) The Astrophysical Journal, 835:105 (15pp), 2017 January 20. Ricci et al.. luminous in the X-ray band than the unobscured quasars with similar 6 μm luminosities shown in the figure (from Just et al. 2007). This is found in objects for which L 2 – 10 keV was obtained from spectral analysis as well as in those for which we used the indirect approach described in Appendix D. Considering the average bolometric luminosity of hot DOGs (Assef et al. 2015), áL bolñ 5 ´ 10 47 erg s-1, the Eddington ratio would be lEdd 1, even assuming an average black hole mass of MBH ~ 4 ´ 109 M. If so, k x would be 100 , a value 5–10 times as large as that for lEdd 0.1 (Vasudevan & Fabian 2009). For WISE J1036+0449 we found that lEdd 2.7, and considering the bolometric luminosity inferred from the SED (LBol 8 ´ 10 46 erg s-1), we found that k x 130 . It should be remarked that LBol was calculated by interpolating the WISE and CSO data with a power law, which might have underestimated the real value of the bolometric output for this source and therefore the value of k x . The variation of k x and aOX could therefore straightforwardly lead to the observed deviation in the mid-IR/X-ray correlation at high values of lEdd . X-ray weakness has been found to be rather common in broad absorption line quasars (e.g., Gallagher et al. 2001; Luo et al. 2013, 2014), and recently, it has been discussed that it might also be found in some ULIRGs (e.g., Teng et al. 2014, 2015). However, the mechanism responsible for the quenching of X-ray emission is still unknown. A possible explanation is that the black hole mass of hot DOGs is smaller than that of unobscured quasars with similar luminosities, which would lead to larger values of lEdd and therefore of k x and aOX . Luo et al. (2013, 2014) argued that the X-ray weakness of broad absorption line quasars would substitute the shielding material often invoked to prevent the over-ionization of the wind from the X-ray radiation, thus leading to the launching of more powerful winds. Proga (2005) proposed that outflows from the accretion disk could collide with the corona, suppressing the production of X-ray emission. This mechanism appears plausible considering the extreme luminosities and Eddington ratios of hot DOGs and also in light of the recent ALMA study of Díaz-Santos et al. (2016), who found evidence of extremely powerful winds in the most luminous hot DOG known.. 4. The intrinsic 2–10 keV luminosity of WISE J1036+0449 [log (L 2 – 10 keV erg s-1) ~ 44.80] is considerably lower than the value expected from the mid-IR/X-ray luminosity correlation, considering its 6 μm luminosity [log (L 6 m m erg s-1) ~ 46.61], and the 2–10 keV bolometric correction is k x 130 . Other hot DOGs are fainter than expected in the X-ray band (Figure 8), which might imply that X-ray weakness is a common characteristic of extremely luminous AGNs. X-ray weakness might be related to significantly larger values of lEdd (and therefore of k x and aOX ) or to the disruption of the X-ray corona caused by outflowing material. An alternative explanation is that hot DOGs are significantly more obscured than what is inferred by current studies based on X-ray spectroscopy and on the analysis of the SED. Future X-ray observations of hot DOGs at z 1 will be extremely important to understand whether these objects are intrinsically X-ray weak and to shed light on the conditions of the X-ray emitting plasma around SMBHs at the highest luminosities and accretion rates. We thank the referee for a very prompt report that helped to improve the article. This work makes use of data products from the Wide-Field Infrared Survey Explorer, which is a joint project of the University of California, Los Angeles, and the Jet Propulsion Laboratory/California Institute of Technology (Caltech). WISE is funded by the National Aeronautics and Space Administration (NASA). Some of the data presented herein were obtained at the W.M. Keck Observatory, which is operated as a scientific partnership between Caltech, the University of California, and NASA. Use of the observatory was made possible by the generous financial support of the W.M. Keck Foundation. This work makes use of data from the NuSTAR mission, a project led by Caltech, managed by the Jet Propulsion Laboratory, and funded by NASA. We thank the NuSTAR Operations, Software, and Calibration teams for their support with the execution and analysis of these observations. This research has made use of the NuSTAR Data Analysis Software, jointly developed by the ASI Science Data Center (Italy) and Caltech. This work has made use of the NASA/IPAC Infrared Science Archive and NASA/IPAC Extragalactic Database, which are operated by the Jet Propulsion Laboratory, Caltech, under contract with NASA. This material is based upon work supported by NASA under Proposal No. 13ADAP13-0092, issued through the Astrophysics Data Analysis Program. We thank M. Karouzos and C.S. Chang for their comments on the manuscript. We acknowledge financial support from CONICYT-Chile grants “EMBIGGEN” Anillo ACT1101 (C.R., E.T., F.E.B.); FONDECYT 1141218 (C.R., F.E.B.), 3140436 (R.N.), and 1151408 (R.A.); and Basal-CATA PFB– 06/2007 (C.R., F.E.B., E.T.) and from the Ministry of Economy, Development, and Tourism’s Millennium Science Initiative through grant IC120009, awarded to the Millennium Institute of Astrophysics (F.E.B.). C.R. acknowledges support from the China-CONICYT fund. P.G. thanks the STFC for their support [grant reference ST/J003697/2], and W.N.B. acknowledges financial support from NuSTAR subcontract 44A–1092750. P.B. is supported by an STFC studentship. A.C. acknowledges support from ASI/INAF grant I/037/12/0011/13 and the Caltech Kingsley visitor program. T.D.-S. acknowledges support from ALMA-CONICYT project 31130005 and FONDECYT 1151239. S.M.L. is supported by an appointment to the NASA Postdoctoral. 6. SUMMARY AND CONCLUSIONS We reported here on a multi-wavelength study of WISE J1036+0449, the first hot DOG detected by NuSTAR. The source was selected using new selection criteria that identify hot DOGs at redshifts lower than those at which they were previously discovered. We report below the main findings of our work. 1. The redshift of WISE J1036+0449 is z=1.009. The SED of the source is extremely similar to those of hot DOGs at z ~ 2 (Figure 4), validating the new method of selecting hot DOGs at z 1. 2. The source is detected in the X-ray band, which confirms the presence of a powerful AGN. We found that the source is obscured [NH (2–15) ´ 10 23 cm-2 ], with a column density consistent with that of the bulk of the hot DOG population. 3. If the broadening of the Mg II line is due to the gravitational field of the SMBH, then the black hole mass is MBH 2 ´ 108 M and the Eddington ratio is lEdd 2.7. 12.
(13) The Astrophysical Journal, 835:105 (15pp), 2017 January 20. Ricci et al.. PDF over all but one of the parameters in q yields so-called marginalized posteriors in 1d. In Nikutta (2012, appendix therein) it is also shown that given the observed SED and the spectral shapes of all model SED components, the relative normalizations of the components are not free parameters and can in fact be computed analytically. This is the approach employed by the code. The confidence contours obtained by the fit are shown in Figure 9.. Program at the NASA Goddard Space Flight Center, administered by the Universities Space Research Association under contract with NASA. Facilities:Chandra, NuSTAR, Swift, XMM-Newton, WISE, Keck. APPENDIX A CLUMPY TORUS MODEL In the CLUMPY model (Nenkova et al. 2002, 2008a, 2008b) the clouds are arranged around the central illuminating source in an axially symmetric configuration and exist across radial distances ranging from the dust sublimation radius Rd of the constituent dust grains (set by the source luminosity) to an outer radius Y · Rd , with Y as a free parameter. The local cloud number density (per unit length) varies with the radial and angular coordinates and is specified by N0, the mean number of clouds along a radial ray on the equatorial plane. In the radial direction it declines as r -q , with q as a free parameter. In the angular direction (equatorial plane to system axis) the cloud number per line-of-sight varies as a Gaussian of width σ. Finally, the observer’s viewing angle i, measured from the torus axis, is the only external model parameter. The modified BB component, with an emissivity exponent b = 1.5, is often used to parameterize star-formation contribution at far-IR wavelengths. The parameter β has a typical value in the interval 1 < b < 2 (Huang et al. 2014). The only free parameter of this component is the dust temperature TBB.. APPENDIX C RESULTS OF THE SED FITTING The MAP values and posterior medians with 1s confidence intervals are listed in Table 4. In both the all-data and IR-only cases, the prevalent viewing angles i of the torus (measured in degrees from the torus axis) are ∼65° and are compatible with the MAP values. The posterior distribution medians are also of similar value and have comparable 1s confidence intervals around them. Most other parameters react more strongly to the presence or lack of optical/UV data, except for σ, the torus polar height parameter, which is large in both cases. The median values of σ are around 60° (measured from the equatorial plane). In the IR-only fit, several posteriors are bimodal (e.g., tV , the optical depth of a single dust cloud at visual, or q, the index of the power law 1 r q that describes the radial distribution of clouds in the torus). It should be remarked that the IR-only fit results in an SED with a significantly stronger flux than the typical SED of ELIRGs (Tsai et al. 2015) between 15 and 60 μm. We must point out that the fit to IR data alone runs the risk of over-fitting, since the combined torus+blackbody model has seven free parameters, while there are only five data points fitted. In fact, we artificially set the number of DOF to unity in this case to avoid division by a negative number when computing the reduced c 2 . In the all-data fit, with 10 data points, this risk is eliminated. In the all-data fit, the temperature of the BB component +14.5 appears narrowly constrained at 119.549.5 K. This value, however, is higher than those in most other hot DOGs. Fan et al. (2016a) decomposed the SEDs of 20 hot DOGs with available WISE data and found for TBB a range of median values of 45–95 K, with their median being 72 K. Preliminary analysis of the 130 sources in the sample of C. W. Tsai et al. (2016, in preparation) have good to acceptable fits, and their BB temperatures span median values of 20–126 K, with their median being 69 K. We believe that the comparatively high BB temperature in our case arises as an artifact of the lack of data between 11 and 160 mm , i.e., our SED currently has no data points that could help constrain the position of the BB peak. Future studies of the SED of this interesting source with additional data points between 11 and 160 mm will allow us to improve the constraints on the parameters.. APPENDIX B SED FITTING APPROACH We employed a Bayesian approach for the fitting. Bayes’s theorem, here in a simplified notation, Posterior º p (q∣D) µ p (q ) p (D∣q ) º Prior ´ Likelihood, (3 ). provides a straightforward prescription to compute the soughtafter posterior probability density function (PDF) p (q∣D) of model parameter values q , given the observed data vector D (here, the observed SED flux densities). This multi-dimensional posterior is proportional to the product of a prior PDF p (q ) of the parameter values (before the data are seen) and the likelihood p (D∣q ) that the given parameter values generate a model that is compatible with the data. If the uncertainties on D are Gaussian, then p (D∣q ) µ exp (-c 2 2) (see, e.g., Trotta 2008). We used a Markov-chain Monte Carlo scheme to efficiently sample the seven-dimensional parameter volume. The code was first developed in Nikutta (2012) and has since been heavily expanded. At each sampling step a torus model SED is generated through multi-dimensional interpolation of the publicly available CLUMPY hypercube, while the BB SED is generated on the fly, given the randomly sampled BB temperature. We applied uniform prior PDFs for all model parameters, i.e., p (qi ) = (Dqi )-1, where Dqi is the range of parameter values spanned by any single parameter qi . The sampling chains are guaranteed to eventually converge toward the target distribution p (q∣D) (Metropolis et al. 1953; Hastings 1970). Finally, integration of the multi-dimensional posterior. APPENDIX D THE INTRINSIC X-RAY LUMINOSITY OF WISE 1814+3412, WISE 2207+1939, AND WISE 2357+0328 WISE 1814+3412, WISE 2207+1939, and WISE 2357 +0328 were observed by NuSTAR and XMM-Newton (Stern et al. 2014) but were either weak or completely undetected by XMM-Newton. In order to correct the observed X-ray luminosity for absorption, we used the following approach. 13.
(14) The Astrophysical Journal, 835:105 (15pp), 2017 January 20. Ricci et al.. Figure 9. Confidence plot for the SED fit carried out using the complete data set. The white contours are at 1%, 10%, 50%, and 90% of the peak pixel in each panel. Table 4 Results of the SED Fitting Parameter i (degrees) tV q N0 σ (degrees) Y TBB (K). MAP Value All Data. IR Data. 64.1 11.7 3.0 14.2 67.9 8.5 125.3. 64.5 34.1 0.4 6.8 53.9 51.0 125.3. the expected luminosity in the rest-frame 2–10 keV band. The values of the luminosities we obtained for these three objects are reported in Table 3.. Posterior Median 1s All Data IR Data +13.3 69.915.9 +2.4 12.61.8 +0.4 2.60.6 +1.1 13.51.3 +3.3 65.55.3 +11.0 6.71.7 +14.5 119.549.5. +16.4 66.817.3 +7.3 27.812.5 +1.5 1.30.8 +3.0 10.64.0 +8.2 60.412.4 +28.9 61.631.3 +44.0 82.036.0. REFERENCES Ai, Y. L., Yuan, W., Zhou, H. Y., Wang, T. G., & Zhang, S. H. 2011, ApJ, 727, 31 Alam, S., Albareti, F. D., Allende Prieto, C., et al. 2015, ApJS, 219, 12 Alexander, D. M., Bauer, F. E., Chapman, S. C., et al. 2005, ApJ, 632, 736 Alexander, D. M., Stern, D., Del Moro, A., et al. 2013, ApJ, 773, 125 Annuar, A., Gandhi, P., Alexander, D. M., et al. 2015, ApJ, 815, 36 Arévalo, P., Bauer, F. E., Puccetti, S., et al. 2014, ApJ, 791, 81 Arnaud, K. A. 1996, in ASP Conf. Ser. 101, Astronomical Data Analysis Software and Systems V, ed. G. H. Jacoby & J. Barnes (San Francisco, CA: ASP), 17 Asmus, D., Gandhi, P., Hoenig, S. F., Smette, A., & Duschl, W. J. 2015, MNRAS, 454, 766 Assef, R. J., Eisenhardt, P. R. M., Stern, D., et al. 2015, ApJ, 804, 27 Assef, R. J., Walton, D. J., Brightman, M., et al. 2016, ApJ, 819, 111 Baloković, M., Comastri, A., Harrison, F. A., et al. 2014, ApJ, 794, 111 Banerji, M., McMahon, R. G., Hewett, P. C., et al. 2012, MNRAS, 427, 2275 Bauer, F. E., Arévalo, P., Walton, D. J., et al. 2015, ApJ, 812, 116 Blain, A. W., Smail, I., Ivison, R. J., Kneib, J.-P., & Frayer, D. T. 2002, PhR, 369, 111 Bridge, C. R., Blain, A., Borys, C. J. K., et al. 2013, ApJ, 769, 91 Brightman, M., Masini, A., Ballantyne, D. R., et al. 2016, ApJ, 826, 93 Brightman, M., & Nandra, K. 2011, MNRAS, 413, 1206 Brightman, M., Silverman, J. D., Mainieri, V., et al. 2013, MNRAS, 433, 2485 Burrows, D. N., Hill, J. E., Nousek, J. A., et al. 2005, SSRv, 120, 165. Note. MAP values of all model parameters as well as posterior medians of the same and the 1s confidence intervals around them for the all-data and IRdata-only models shown in Figure 5.. We adopted as an X-ray spectral template the X-ray spectrum of WISE J1036+0449, considering the MYTORUS model discussed in Section 4. We fixed the value of the line-of-sight column density to that obtained from E (B - V ) using Equation (1) (see Table 3), set the value of the redshift to that reported in Stern et al. (2014), and calculated the correction factor in the 2–10 keV band by changing the inclination angle to 30◦. We then extrapolated, using the X-ray spectral template, 14.
Figure


+4


Documento similar