Cross taxon congruence and environmental conditions
9
0
0
Texto completo
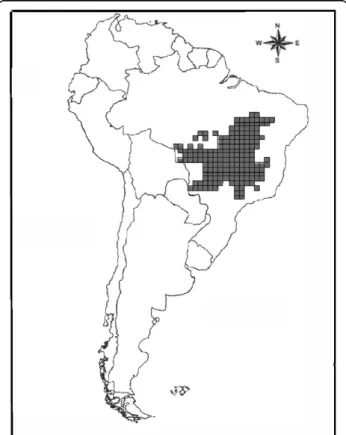
(2) Toranza and Arim BMC Ecology 2010, 10:18 http://www.biomedcentral.com/1472-6785/10/18. determined by shared biogeographic history; and those that propose a common response to local environmental conditions. The former group includes the effect of trophic interactions on predator or prey diversity, to which particular attention has been devoted in the ecological literature [11-14]. However, empirical patterns of association between prey and predator diversity have shown inconsistent results [15-18]. Other mechanisms relate the diversity of one group to the resource availability, habitat and refuges that they provide for other groups, directly affecting their diversity [11,18,19]. Another explanation for cross-taxon congruence is based on their similar biogeographic history [20]. Allopatric speciation is typically related to a geographic structure that could simultaneously affect different taxa [21]. Geographic connection of areas previously isolated [22] or the long term variation in climatic conditions, produce large scale movements of several taxa which could generate congruent spatial distribution patterns among them [23,24]. A final set of explanations for spatial covariation in diversity patterns is rooted in their common response to environmental variability [3,25,26]. Climatic conditions have been broadly proposed as a major determinant of diversity patterns through their control over the availability of water and energy [1]. In this sense, species-energy theory [27] predicts that available energy determines viability of rare species and consequently community richness [14,28]. In addition, temperature could determine richness through its effects on vital rates [29,30]. In this framework, the observed crosstaxon congruence in diversity patterns would be a by-product of the similar response to spatial climatic variability. The large amount of evidence regarding the role of the environment as a determinant of geographic variations in diversity [17,25,31,32], lend support to common response to environmental conditions as a main explanation for cross-taxon congruence. A global study on the species richness determinants, showed that in 83 out of 85 studies, more than 60% of the spatial variability in species richness was explained by variables related with energy, water or their interaction [31]. However, the complex interaction among environmental variables constrains our ability to disentangle the determinants of variation in diversity within and among taxa [33,34]. In this article we focus on the evaluation of this mechanism as the main determinant of cross-taxon congruence, accounting for the complex nature of interaction among environmental variables which affect diversity. The Brazilian Cerrado is the largest savannah of South America and has been recognized as one of the 25 biodiversity hotspots of the world [35]. A considerable number of studies have been conducted in this. Page 2 of 9. ecosystem analyzing its biogeographic patterns [36-38] and conservation status [39,40]. In the particular case of birds and mammals, a recent study showed that diversity of both groups is spatially correlated, showing a common latitudinal trend [41]. The results of this study also provide evidence for an important role of actual evapotranspiration as a common predictor of avian and mammal diversity patterns. In this article, path analysis has been used to move forwards in the identification of the effect of environmental variables on avian and mammal richness, accounting for the potential existence of complex associations among variables. Once we had identified the independent effect of environment on taxon richness, we explored if environment could explain common spatial variations between taxa, as was proposed, or if this covariation should be accounted by additional factors.. Methods Database. The Cerrado (Brazilian Savanna), occupies an extension of approximately 2.000.000 km2, and represents the second largest biome of Brazil (Figure 1). This is the richest and most threatened savannah of the world [37]. Following previous studies the whole region was divided in. Figure 1 Map of the Brazilian Cerrado with the used grid. Map of the 181 grid cells (1° × 1°) over Brazilian Cerrado region..
(3) Toranza and Arim BMC Ecology 2010, 10:18 http://www.biomedcentral.com/1472-6785/10/18. 181 grid cells of one degree of spatial resolution [40,42,43]. For each grid cell we worked with the total species richness of birds and mammals. These richness values were estimated from the extent of occurrence of each species [44,45]. It was stated that spatial patterns of richness at the Cerrado could be affected by biases in data records associated with human occupancies. However, concerns for data quality are important for amphibians [46,47] but not so for the birds and mammals species used in this study [41,48]. In addition, the following environmental variables that could affect species richness were considered: mean temperature (Tmean), potential evapotranspiration (PET), normalized difference vegetation index (NDVI), annual relative humidity (ARH), and actual evapotranspiration (AET) [42]. The first three variables are typically used as alternative proxies of available energy in the environment. They are intended to represent the major hypotheses in the context of the species-energy theory [31]. Tmean and PET may be interpreted as a measure of crude ambient energy, although Tmean basically represents heat, and PET depends on a degree of relative humidity [1]. NDVI is a measure of productivity, and so it is a surrogate of the amount of energy that actually enters the food chains. The fourth variable is closely associated with water availability, and the last one represents the interaction between water and energy [43]. In addition, we also considered latitude-centre point of each grid cell-as a potential determinant of diversity, which encapsulates the variation in several environmental variables [34]. Analysis. Our principal aim was to achieve a plausible causal structure connecting latitude, environment, birds and mammal richness and the correlation between them. We started by exploring the association between pairs of key variables, such as the association between avian and mammal diversity and the latitudinal trends of these taxa. The role of environmental variables was first analyzed with Ordinary Least Square (OLS) regression and Simultaneous Autoregressive (SAR) models. This analysis identified a set of variables that could be causal determinants of diversity patterns. We used those models as a starting point for the analysis of the association between birds and mammals diversity after accounting for environmental effects. We evaluated the importance of this mammals-birds link with two complementary approaches, whole covariance matrix path analysis [49] and d-separation [50]. The association between avian and mammal richness and latitudinal trends in diversity were explored by second order polynomic regressions [51]. Consideration of the second order term allows the detection of a wide range of non-linear relationships including U-shaped,. Page 3 of 9. unimodal, and monotonic trends [52]. We performed multiple regression analyses, also including quadratic terms for each independent variable, selecting models from ranked Akaike Information Criterion (AIC) values [53]. It has been highlighted that the result of macroecological analysis could be sensible to spatial autocorrelation in data [50,54]. For that reason we contrasted the results of the OLS regression with those observed in a SAR analysis [55]. Multiple regressions are limited in the range of causal structure that they can represent, and could even suggest a wrong model when a complex causality is involved [50]. Starting with the causal structure suggested by the previous regressions, we tested for alternative causal models using path analysis. This analysis proves the congruence of the whole causal model with observations and the significance of all proposed paths [50]. The whole model was evaluated with a maximum likelihood approach, using chi-square distribution (c2) to statistically evaluate the congruence between observed and expected covariance with the proposed model. A significant result implies a lack of congruence between model and observations. The potential existence of a causal link between mammal and avian diversity patterns is particularly important in the context of this study. If this link remains significant, in spite of having accounted for the existence of common determinants of diversity–environmental variables, available energy, and latitude–this implies that there is some other mechanism(s) determining the observed association. On the other hand, if the Structural Equation Model (SEM) is not improved for the inclusion of this link and/or the link is not significant this means that co-variation between higher taxa diversity could be fully accounted by geographic trends in environmental variables. We further evaluated the relevance of this link after considered spatial autocorrelation using d-separation [50]. For that, we explored the association between the residuals of SAR analysis for mammals and birds.. Results Species richness of birds and mammals was positively associated in the Cerrado biome (r2 = 0.574, P < 0.05, N = 181), as had been previously noted in a study on the spatial patterns of vertebrate diversity in this region [41]. The relationship between taxon richness was mainly positive and non-linear, but tended to be independent at high values of richness (Figure 2). Species richness of birds (r 2 = 0.292, P < 0.05, N = 181) and mammals (r2 = 0.689, P < 0.05, N = 181) showed a positive latitudinal trend in the Brazilian Cerrado region. This result is consistent with diversity trends previously reported in this biome for amphibians [47] and birds.
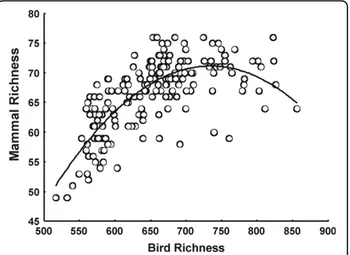
(4) Toranza and Arim BMC Ecology 2010, 10:18 http://www.biomedcentral.com/1472-6785/10/18. Page 4 of 9. Figure 2 Cross-taxon congruence of avian and mammal richness within the Cerrado region. Relationships between avian and mammal richness in the Brazilian Cerrado. Line indicate the polynomic regression fit between groups (r2 = 0.574, P < 0.05, N = 181).. [43]. The functional form of the latitudinal trend was different for birds and mammals. Mammal richness presented a positive but non-linear monotonic pattern (Figure 3a), while avian richness showed a positive linear relationship with latitude (Figure 3b). OLS regression indicates an effect of latitude and its quadratic term, PET, mean temperature and its quadratic value, over both taxa. In addition, NDVI was only associated with avian diversity; while the annual relative humidity, was only related with mammal diversity (Table 1). It should be highlighted that the potential role of AET was evaluated in all multiple regression models, but its inclusion always implied a significant decrease in model performance–e.g. more than two units of difference in AIC value between models. The results of SAR models were largely congruent with previous OLS results (see Table1). However, OLS showed a significant spatial structure on residuals which was removed in the SAR when the spatial components were considered (Figure 4a y 4b). We identified a structural model congruent with observations, accounting for the interactions of the environmental variables and their roles as determinants of avian and mammal richness. The whole model was not significant (p < 0.353), indicating a good adjustment with the observations. This model explained 73% and 76% of geographical variability of birds and mammals (Figure 5). This final model retains an explicit connection between the taxa, once abiotic variability is controlled for. It should be highlighted that all alternative models analyzed were incongruent with observations if this path was not considered (Figure 5). Finally, it is important to state that significant paths between. Figure 3 Correlation of mammal and avian richness with Latitude in the Brazilian Cerrado. Latitudinal trend of mammal (a) and birds (b) richness, within the Cerrado (Brazil).Lines indicates the regression fit of avian (r2 = 0.292, P < 0.05, N = 181) and mammal diversity (r2 = 0.689, P < 0.05, N = 181) with latitude.. environmental variables were suggested by some models. This suggests the potential existence of some complex interaction among environmental variables. However, all these causal models were significantly different from the data, strongly supporting the final model. The d-separation analysis of the mammals -birds’ link was congruent with path analysis results. Residuals of the SAR models for each taxon were significantly associated (F2,178 = 10.86, P < 0.001). However, this analysis highlights that the nature of this relationship could be humped, being negative for the larger values of bird richness (Figure 4c).. Discussion Environmental variables have been broadly recognized as main determinants of geographic diversity patterns. Previous studies, using alternative methodologies, identified: temperature, elevation range, and actual or.
(5) Toranza and Arim BMC Ecology 2010, 10:18 http://www.biomedcentral.com/1472-6785/10/18. Page 5 of 9. Table 1 Exploratory analyses of the effects of environment on diversity of birds and mammals. OLS coeff. SAR coeff. Std. Coeff Std. Error P-value Birds Latitude. 10.555. 10.741. 0.681. 1.448. <0.001. Latitude 2 PET. -0.733 -1.998. -0.736 -2.006. -0.221 -0.39. 0.228 0.532. 0.002 <0.001. Tmean. 28.322. 28.079. 0.683. 5.407. <0.001. Tmean 2. 7.774. 7.666. 0.504. 1.169. <0.001. NDVI. 16.275. 16.062. 0.17. 5.13. <0.001. Latitude. 1.043. 1.058. 0.783. 0.088. <0.001. Latitude 2. -0.123. -0.12. -0.419. 0.014. <0.001. PET Tmean. -0.093 1.331. -0.088 1.27. -0.2 0.36. 0.032 0.32. 0.006 <0.001. Tmean 2. 0.133. 0.132. 0.101. 0.07. <0.001. ARH. 0.271. 0.272. 0.197. 0.052. <0.001. Mammals. Birds R2 (SAR): 0.515 Mammals R2 (SAR): 0.745 Spatial autoregressive analyses exploring the role of environmental conditions on avian richness and mammal richness. Lat = latitude, Lat2 = quadratic term of latitude, PET = potential evapotranspiration, Tmean = mean temperature, Tmean2 = quadratic term of mean temperature, NDVI = normalized difference vegetation index and ARH = annual relative humidity.. potential evapotranspiration as determinants of avian and mammal richness [31,32]. Our analyses corroborate a main influence of environmental conditions and latitude over these groups diversity [41]. Explanations for cross-taxon congruence based on common response to environmental conditions propose that the spatial concordance in diversity patterns is a consequence of the congruent response to environmental determinants [3,56,57]. Therefore, once the effect of environment on taxa diversity has been accounted for, such covariation should not persist [50]. The prevalence of a significant association among taxa, after considering environmental determinants, could indicate both the need to incorporate additional ecological mechanisms and the existence of a shared trend in the sampling bias among taxa and regions. Spatial association in the data record is a typical source of biases in geographic databases [58-61]. Spatial biases are primarily generated by higher sampling effort along riversides and roads, as well as around populated centres [59,62,63]. At least for anurans, this has been shown to be a relevant problem in the Cerrado region [47]. These biases are expected to be lower in birds and mammals in this region, given that their accumulation curves were early saturated (Diniz-Filho, pers. comm. 2010). However, the existence of large areas poorly sampled and others very well recorded, could produce artificial shared trends in diversity patterns and hence cross-taxon congruence. The detection of a significant association between taxa, not related to environmental. conditions, suggests that spatial biases in sampling could be determining the observed patterns. It should be highlighted that this explanation for cross-taxon congruence is not usually considered, despite spatial biases in databases being a common feature. Recent studies have also shown the persistence of cross-taxon congruence when the environmental effects on taxa diversity have been controlled [19,64-67]. This evidence suggested the existence of a functional links between plant and vertebrate richness and among vertebrate groups. In this sense, a recent analysis of crosstaxon congruence at a global scale reported the presence of a strong link between avian and mammal diversity [65]. However, links between these groups’ diversity and diversity of vascular plants and other vertebrate taxa were weak [65]. All these studies support two basic ecological hypotheses, the diversity-trophic structure hypothesis [14] and the vegetation structure hypothesis [68]. These hypotheses attempt to explain the diversity of certain groups as an effect of other group diversity. In the particular case of birds and mammals at the Brazilian Cerrado, habitat supply from one taxon to the other does not appear as plausible explanation. However, indirect effects on landscape attributes as generation of habitat heterogeneity or particular habitat condition could be involved in the observed pattern. In addition, trophic interaction could be playing a role in this case. In spite of representing a small number of the total species in both groups, top down effects from raptors and predatory mammals have the potential to determine prey diversity. In this sense, we are not considering a priority effect of one group’s diversity on the other but the persistence of their association after accounting for the effect of the shared environment. Although the effect of available energy was considered in the analysis, bottom up processes could be implicated because the availability of some resources may be poorly represented by gross measures of productivity [69]. Particularly, the response of some guilds composed of birds and mammals to variations in resources may originate spatial covariation between taxa [70,71]. Common biogeographic history could cause the persistence of cross-taxon congruence. The role of biogeographic history as a determinant of current spatial patterns of diversity is increasingly recognized [21-24,72,73]. In the particular case of South America, evidence has been compiled about the effects of past climate fluctuations in the contraction and expansions of tropical and temperate habitats [74], and the consequences of these changes on regional taxa diversity [20,38,75,76]. Further, it has been postulated that the Quaternary climatic and vegetational changes have been an important driver of the process of speciation in the forests and savannah in South America [37]. The.
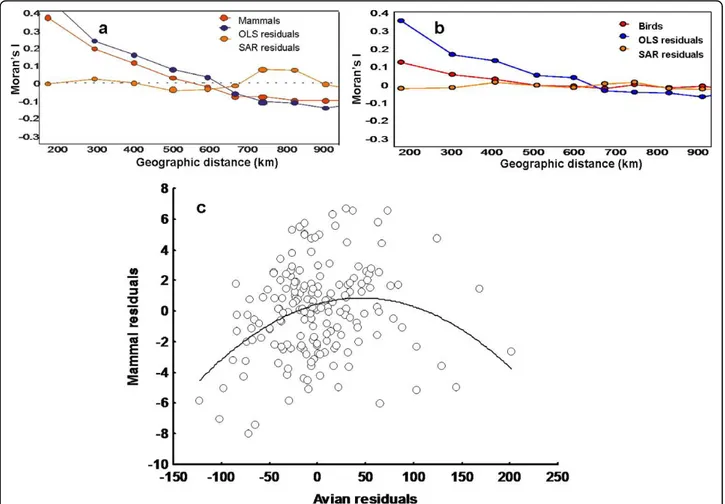
(6) Toranza and Arim BMC Ecology 2010, 10:18 http://www.biomedcentral.com/1472-6785/10/18. Page 6 of 9. Figure 4 Cross-taxon congruence in birds and mammals after accounting for the effect of the environment and spatial structure. Spatial correlograms of mammals (a) and birds (b) richness red lines-richness data; blue lines-OLSs residuals and orange lines-SARs residuals; (c) association between residuals of SARs analyses for mammals and birds (r2 = 0.109, P < 0.05, N = 181).. evidence for the expansion and contraction of the savannas and dry forests in the Cerrado and Caatinga [36,38], suggest a potential influence of biogeographic history on the cross-taxon congruence herein reported. The set of mechanisms discussed above represents a plausible explanation for cross-taxon congruence between birds and mammals. However, it remains to be considered why these groups present a common response to these mechanisms, determining cross-taxon congruencies that are larger that those observed with any other group of vertebrates [65]. The most important attribute shared by birds and mammals is endothermy [77]. Endothermy implies a very expensive lifestyle, consuming energy at higher rates than reptiles [78]. In addition, endothermy is related to different ecological attributes than is vertebrate ecothermy [77]. This is the case for density [30], reproductive behavior [79], efficiency in translation of available resources to reproduction [77], the strength of predator-prey size differences [80], a hierarchy in which endotherms prey on ecthoterms [81], maximum body size and trophic position. [82], molecular evolution [83] and current extinction rates [84]. The distinctive ecology of endotherms could be involved in the similar response of birds and mammals to ecological and evolutionary processes. Indeed, high cross-taxon congruence also has been observed among ectothermic vertebrate, reptiles and amphibians in terrestrial ecosystems [24,41,65]. Although that for most of the data considered the association between mammal and bird richness was positive, observed richness in both groups tended to be independent at higher richness (Figure 2), or, even became negative when residuals of SAR regressions were considered (Figure 4). This puts the attention on those mechanisms proposed to explain observed incongruence in both groups’ diversity in some regions of the Cerrado. In this sense, previous studies have suggested that differences in birds’ and mammals’ diversity patterns can be based in the more restricted distribution ranges of mammals in southern and western zones of the biome [41] or could be produced as a consequence of difference in ecological requirements related to habitat use [43]. In summary,.
(7) Toranza and Arim BMC Ecology 2010, 10:18 http://www.biomedcentral.com/1472-6785/10/18. Page 7 of 9. Figure 5 Causal structure connecting environmental conditions, latitude, and diversity of mammals and birds. Structural equation model connecting environmental conditions, latitude, and diversity of mammals and birds.The overall model was non significant indicating good congruence between the proposed causal structure and observations. Path model with the environmental determinants of bird (NDVI, HRA, PET, Tmean, Lat) and mammal richness (HRA, PET, Tmean, Lat and Lat2) and the remaining direct link between biological groups. Above the arrows it is shows the path coefficients, with its standard error in parentheses.. several hypotheses have been proposed for the incongruence in diversity of birds and mammals at some points of the Cerrado. However, the potential existence of negative trends among groups diversity have been poorly considered as a general phenomenon. Since cross-taxon congruence is usually invoked as a theory that supports the implementation of reserves based on groups that act as surrogates for the diversity of other taxa [35], more attention should be put on the determinants of these negative trends (see also [67]). In the case of common environmental determinants the most frequent methodological approach has been multiple regression models [31,34,85]. Despite the fact that this approach represents a breakthrough in the analysis of associations between environment and diversity at broad spatial scales, it has limited potential to identify complex causal structures [86]. The use of structural equation models allows the detection of these intricate structures [49,50], which combined with statistics that account for spatial autocorrelation, could significantly improve our understanding of the mechanisms determining diversity patterns. In the present study, these analyses allowed us to identified the role of environmental variables as determinants of observed richness, as well as to discard a common environmental effect as the only determinant of avian and mammal covariation.. Conclusions The role of environment as a main determinant of diversity within particular taxa has been identified as the primary cause of spatial congruence between different groups. diversity. Contradicting previous expectations, the analysis of cross-taxon congruence in different systems suggests that a common response to environmental variables cannot completely account for the observed associations among taxa diversity [64,65]. The identification of those mechanisms that, in addition to environment, determine cross-taxon congruence has important implications for the understanding of ecological patterns, and ongoing process as global change, species extinction and conservation. Acknowledgements The authors thanks to Thiago Fernando L. V. B. Rangel, José Alexandre Felizola Diniz-Filho and Luis Mauricio Bini for making available the database used in this study. We also appreciate the help of Meredith Root-Bernstein for English language revision. Both authors thank Andrés Canavero for his collaboration and support. We also want to thank three anonymous reviewers and to Hans Zauner (Scientific Editor of BMC) for his valuable contributions that helped us to improve our work. MA is grateful for support from FONDAP-FONDECYT 1501-0001 and FCE 2007- 054. Author details 1 Instituto de Ecología y Ciencias Ambientales, Facultad de Ciencias, Universidad de la República, Uruguay, Iguá 4225 Piso 8 Sur, Montevideo, Uruguay. 2Departamento de Ecología y Evolución, Facultad de Ciencias, Universidad de la República, Uruguay, Iguá 4225 Piso 9 Sur, Montevideo, Uruguay. 3Center for Advanced Studies in Ecology and Biodiversity, Pontificia Universidad Católica de Chile, PO Box 114-D, Santiago, Chile. Authors’ contributions Both authors contributed to the conception and design of the study. Also, CT and MA were involved in the statistical data analyses and interpretation, drafting and revising the article. All authors approve the article’s publication. Authors’ information CT is currently in the Institute of Ecology and Environmental Sciences, Universidad de la República, Montevideo, Uruguay. MA is currently in the Department of Ecology and Evolution, Universidad de la República,.
(8) Toranza and Arim BMC Ecology 2010, 10:18 http://www.biomedcentral.com/1472-6785/10/18. Montevideo, Uruguay and is an associated researcher in the Center for Advanced studies in Ecology and Biodiversity, Pontificia Universidad Católica de Chile. Received: 13 September 2009 Accepted: 16 July 2010 Published: 16 July 2010 References 1. Currie DJ: Energy and Large-Scale Patterns of Animal- and Plant-Species Richness. The American Naturalist 1991, 137:27-49. 2. Kerr JT, Sugar A, Packer L: Energy and Large-Scale Patterns of Animaland Plant-Species Richness. Conservation Biology 2000, 14:1726-1734. 3. Gaston KJ: Global patterns in biodiversity. Nature 2000, 405:220-227. 4. Pearson DL, Carroll SS: The influence of spatial scale on cross-taxon congruence patterns and prediction accuracy of species richness. Journal of Biogeography 1999, 26:1079-1090. 5. Reid WV: Biodiversity hotspots. Trends in Ecology and Evolution 1998, 13:275-280. 6. Wolters V, Bengtsson J, Zaitsev A: Relationship among species richness of different taxa. Ecology 2006, 87(8):1886-1895. 7. Rahbek C: The role of spatial scale and the perception of large-scale species-richness patterns. Ecology Letters 2005, 8:224-239. 8. van Rensburg BJ, Chown SI, Gaston KJ: Species Richness, Environmental Correlates, and Spatial Scale: A Test Using South African Birds. The American Naturalist 2002, 159(5):566-577. 9. Fraser R: Vertebrate species richness at the mesoscale: relative roles of energy and heterogeneity. Global Ecology and Biogeography 1998, 7(3):215-220. 10. Pearson R, Dawson T: Predicting the impacts of climate change on the distribution of species: are bioclimate envelope models useful? Global Ecology and Biogeography 2003, 12(5):361-367. 11. Hairston NG, Smith FE, Slobodkin LB: Community structure, population control, and competition. American Naturalist 1960, 94:421-425. 12. Polis GA, Sears ALW, Huxel GR, Strong DR, Maron J: When is a trophic cascade a trophic cascade? Trends in Ecology and Evolution 2000, 15:473-475. 13. Lafferty KD, Allesina S, Arim M, Briggs CJ, De Leo G, Dobson AP, Dunne JA, Johnson PTJ, Kuris AM, Marcogliese DJ, Martinez ND, Memmott J, Marquet PA, McLaughlin JP, Mordecai EA, Pascual M, Poulin R, Thieltges DW: Parasites in food webs: the ultimate missing links. Ecology Letters 2008, 11(6):533-546. 14. Hutchinson GE: Homage to Santa Rosalia or why are there so many kinds of animals? American Naturalist 1959, 93:145-159. 15. Arnold SJ: Species densities of predators and their prey. The American Naturalist 1972, 106(948):220-236. 16. Siemann E, Tilman D, Haarstad J, Ritchie M: Experimental Tests of the Dependence of Arthropod Diversity on Plant Diversity. The American Naturalist 1998, 152:738-750. 17. Hawkins BA, Porter EE: Productivity and history as predictors of the diversity gradient of terrestrial birds. Ecology 2003, 84(6):1608-1623. 18. Meerhoff M, Iglesias C, Texeira de Mello F, Clemente JM, Jensen E, Lauridsen TL, Jeppsen E: Effects of habitat complexity on community structure and predator avoidance behaviour of littoral zooplankton in temperate versus subtropical shallow lakes. Freshwater Biology 2007, 52:1009-1021. 19. Kissling W, Field R, Böhning-Gaese K: Spatial patterns of woody plant and bird diversity: functional relationships or environmental effects? Global Ecology and Biogeography 2008, 17:327-339. 20. Cracraft J, Prum RO: Pattern and processes of diversification: speciation and historical congruence in some Neotropical birds. Evolution 1988, 42:603-620. 21. Williams SE, Pearson RG: Historical rainforest contractions, localized extinctions and patterns of vertebrate endemism in the rainforest of Australia’s wet tropics. Proceeding of the Royal Society B 1997, 264:709-716. 22. Wiens JJ, Donague MJ: Historical biogeography, ecology and species richness. Trends in Ecology and Evolution 2004, 19:639-644. 23. Ricklefs RE: History and diversity: explorations at the intersection of ecology and evolution. The American Naturalist 2007, 170:S56-S70. 24. Araújo MB, Nogués-Bravo D, Diniz-Filho JAF, Haywood AM, Valdes PJ, Rahbek C: Quaternary climate changes explain diversity among reptiles and amphibians. Ecography 2008, 31:8-15.. Page 8 of 9. 25. Willig MR, Kaufman DM, Stevens RD: Latitudinal gradients of biodiversity: pattern, process, scale, and synthesis. Annual Review of Ecology, Evolution and Systematic 2003, 34:273-309. 26. Hawkins BA, Diniz-Filho JAF, Jaramillo CA, Soeller SA: Climate, Niche Conservatism, and the Global Bird Diversity Gradient. American Naturalist 2007, 170:S16-S27. 27. Currie DJ, Paquin V: Large-scale biogeographical patterns of species richness of trees. Nature 1987, 329:326-327. 28. Brown JH: Two Decades of Homage to Santa Rosalia: Toward a General Theory of Diversity. American Zoologist 1981, 21(4):877-888. 29. Allen A, Gillooly JF, Brown JH: Recasting the species-energy hypothesis: the different roles of kinetic and potential energy in regulating biodiversity. Scaling biodiversity Cambridge: Cambridge University PressStorch D, Marquet P, Brown J 2003, 1:500. 30. Brown JH, Gillooly JF, Allen AP, Savage VM, West GB: Toward a metabolic theory of ecology. Ecology 2004, 85:1771-1789. 31. Hawkins BA, Field R, Cornell HV, Currie DJ, Guégan JF, Kaufman DM, Kerr JT, Mittelbach GG, Oberdorff T, O’Brien EM, Porter EE, Turner JRG: Energy, water, and broad-scale geographic patterns of species richness. Ecology 2003, 84(12):3105-3117. 32. Ruggiero A, Kitzberger T: Environmental correlates of mammal species richness in South America: effects of spatial structures, taxonomy and geographic range. Ecography 2004, 27:401-416. 33. Currie DJ, Francis AP: Some general proposition about the study of spatial patterns of species richness. Ecoscience 1999, 6:392-399. 34. Jansson R, Davies TJ: Global variation in diversification rates of flowering plants: energy vs. climate change. Ecology Letters 2008, 11:173-183. 35. Myers N, Mittermeier RA, Mittermeier CG, da Fonseca GAB, Kent J: Biodiversity hotspots for conservation priorities. Nature 2000, 403:853-858. 36. Jhonson MA, Saraiva PM, Cohelo D: The role of gallery forest in the distribution of Cerrado mammals. Brazilian Journal of Biology 1999, 59:421-427. 37. Cardozo da Silva JM, Bates JM: Biogeographic Patterns and Conservation in the South American Cerrado: A Tropical Savanna Hotspot. BioScience 2002, 52:225-233. 38. Costa L: The historical bridge between the Amazon and the Atlantic Forest of Brazil: a study of molecular phylogeography with small mammals. Journal of Biogeography 2003, 30:71-86. 39. Ratter JA, Ribeiro JF, Bridgewater S: The Brazilian Cerrado Vegetation and Threats to its Biodiversity. Annals of Botany 1997, 80:223-230. 40. Plaza Pinto M, Diniz-Filho JAF, Bini LM, Blamires D, Rangel TFLVB: Biodiversity surrogate groups and conservation priority areas: birds of the Brazilian Cerrado. Diversity and Distributions 2008, 14:78-86. 41. Diniz-Filho JAF, Bini LM, Vieira CM, Blamires D, Terribile LC, Pereira Bastos R, de Oliveira G, de Souza Barreto B: Spatial patterns of terrestrial vertebrate species Richness in the Brazilian Cerrado. Zoological Studies 2008, 47(2):146-157. 42. Rangel TFLVB, Diniz-Filho JAF, Bini LM: Towards an integrated computational tool for spatial analysis in macroecology and biogeography. Global Ecology and Biogeography 2006, 15:321-327. 43. Blamires D, de Oliveira G, de Souza Barreto B, Diniz-Filho JAF: Habitat use and deconstruction of richness patterns in Cerrado birds. Acta Oecologica 2008, 33:97-104. 44. Patterson B, Ceballos G, Sechrest W, Tognelli M, Brooks T, Luna L, Ortega P, Salazar I, Young B: Digital Distribution Maps of the Mammals of the Western Hemisphere. Virginia, USA: NatureServe 2007, version 3.0. 45. Ridgely R, Allnutt T, Brooks T, McNicol D, Mehlman D, Zook R: Digital Distribution Maps of the Birds of the Western Hemisphere. Virginia, USA: NatureServe 2007, versión 3.0. 46. Bini LM, Diniz-Filho JAF, Rangel TFLV, Pereira-Bastos R, Plaza Pinto M: Challenging Wallacean and Linnean shortfalls: knowledge gradients and conservation planning in a biodiversity hotspot. Diversity and Distributions 2006, 12(5):475-482. 47. Diniz-Filho JAF, Pereira Bastos R, Rangel TFLVB, Bini LM, Carvalho P, Silva RJ: Macroecological correlates and spatial patterns of anuran description dates in the Brazilian Cerrado. Global Ecology and Biogeography 2005, 14:469-477. 48. de Oliveira G, Diniz-Filho JAF, Bini LM, Rangel TFLV: Conservation biogeography of mammals in the Cerrado biome under the unified theory of macroecology. Acta Oecologica 2009, 35(5):630-638..
(9) Toranza and Arim BMC Ecology 2010, 10:18 http://www.biomedcentral.com/1472-6785/10/18. 49. Kline RB: Principlies and practice of structural equation modeling. New York: Guilford press, second 2005. 50. Shipley B: Cause and correlation in biology. A user’s guide to path analysis structural equation and causal inference. Cambridge: Cambridge University Press 2000. 51. Sokal RR, Rohlf FJ: Biometry. New York, NY.: Freeman and Co, 3 1995. 52. Arim M, Jaksic FM: Productivity and food web structure: association between productivity and link richness among top predators. Journal of Animal Ecology 2005, 74(1):31-40. 53. Hilborn R, Mangel M: The ecological detective: confronting models with data. Monographs in Population Biology. New Jersey: Princeton University Press 1997. 54. Dormann CF, McPherson JM, Araújo MB, Bivand R, Bolliger J, Carl G, Davies R, Hirzel A, Jetz W, Kissling WD, Kühn I, Ohlemüller R, Peres-Neto PR, Reineking B, Schröder B, Schurr FM, Wilson R: Methods to account for spatial autocorrelation in the analysis of species distributional data: a review. Ecography 2007, 30:609-628. 55. Bini LM, Diniz-Filho JAF, Rangel TFLV, Akre TSB, Abaladejo RG, Albuquerque FS, Aparicio A, Araújo MB, Baselga A, Beck J, Bellocq MI, Böhning-Gaese K, Borges PAV, Castro-Parga I, Chey VK, Chown SL, de Marco P Jr, Dobkin DS, Ferrer-Castán D, Field R, Filloy J, Fleishman E, Gómez JF, Hortal J, Iverson JB, Kerr JT, Kissling WD, Kitching IJ, LeónCortés JJ, Lobo JM, et al: Coefficient shifts in geographical ecology: an empirical evaluation of spatial and non-spatial regression. Ecography 2009, 32:193-204. 56. Nogués-Bravo D, Martínez-Rica JP: Factors controlling the spatial species richness pattern of four groups of terrestrial vertebrates in an area between two different biogeographic regions in northern Spain. Journal of Biogeography 2004, 31:629-640. 57. Rodríguez MA, Belmontes JA, Hawkins BA: Energy, water and large-scale patterns of reptile and amphibian species richness in Europe. Acta Oecologica 2005, 28:65-70. 58. Kadmon R, Farber O, Danin A: Effect of Roadside Bias on the Accuracy of Predictive Maps Produced by Bioclimatic Models. Ecological Applications 2004, 14(2):401-413. 59. Graham CH, Ferrier S, Huettman F, Moritz lC, Peterson A: New developments in museum-based informatics and applications in biodiversity analysis. Trends in Ecology and Evolution 2004, 19(9):497-503. 60. Brose U, Martinez N, Williams R: Estimating species richness: sensitivity to sample coverage and insensitivity to spatial patterns. Ecology 2003, 84(9):2364-2377. 61. Dennis R, Sparks T, Hardy P: Bias in butterfly distribution maps: the effects of sampling effort. Journal of Insect Conservation 1999, 3:33-42. 62. Ferrier S, Watson G, Pearce J, Drielsma M: Extended statistical approaches to modelling spatial pattern in biodiversity in northeast New SouthWales. I. Species-level modelling. Biodiversity and Conservation 2002, 11:2275-2307. 63. Dennis R, Thomas C: Bias in butterfly distribution maps: the influence of hot spots and recorder’s home range. Journal of Insect Conservation 2000, 4:73-77. 64. Jetz W, Kreft H, Ceballos G, Mutke J: Global associations between terrestrial producer and vertebrate consumer diversity. Poceedigs of the Royal Society B: Biological Sciences 2008, 276:269-278. 65. Qian H, Ricklefs RE: Global concordance in diversity patterns of vascular plants and terrestrial vertebrates. Ecology Letters 2008, 11(6):547-553. 66. Qian H: Relationships between Plant and Animal Species Richness at a Regional Scale in China. Conservation Biology 2007, 21(4):937-944. 67. Greyner R, Orme C, Jackson S, Thomas G, Davies RG, Davies T, Jones K, Olson V, Ridgely RS, Rasmussen PC, Tzung-Su D, Bennett PM, Blackburn TM, Gaston KJ, Gittleman JL, Owens IPF: Global distribution and conservation of rare and threatened vertebrates. Nature 2006, 444(2):93-96. 68. MacArthur RH, MacArthur JW: On bird species diversity. Ecology 1961, 42:594-598. 69. Paruelo JM, Lauenroth WK, Burke I, Sala OE: Grassland Precipitation-Use Efficiency Varies Across a Resource Gradient. Ecosystems 1999, 2(1):64-68. 70. Davidson DW, Inouye RS, Brown JH: Granivory in a Desert Ecosystem: Experimental Evidence for Indirect Facilitation of Ants by Rodents. Ecology 1984, 65:1780-1786. 71. Brown JS, Kotler BP, Mitchell WA: Competition between birds and mammals: A comparison of giving-up densities between crested larks and gerbils. Evolutionary Ecology 1997, 11(6):757.. Page 9 of 9. 72. Webb SD: A History of Savanna Vertebrates in the New World. Part II: South America and the Great Interchange. Annual Review of Ecology and Systematics 1978, 9:393-426. 73. Lessa EP, Cook JA, Patton JL: Genetic footprints of demographic expansion in North America, but not Amazonia, during the Late Quaternary. PNAS 2003, 100(18):10331-10334. 74. Pennington RT, Lavin M, Prado DE, Pendry CA, Pell SK, Butterworth CA: Historical climate change and speciation: Neotropical seasonally dry forest plants show patterns of both Tertiary and Quaternary diversification. Philosophical Transactions of the Royal Society of London B 359 2004, 359:515-537. 75. Mayr E, O’Hara RJ: The Biogeographic evidence supporting the Pleistocene forest refuge hypothesis. Evolution 1986, 40(1):55-67. 76. Rangel TFLVB, Diniz-Filho JAF: An evolutionary tolerance model explaining spatial patterns in species richness under environmental gradients and geometric constraints. Ecography 2005, 28:253-263. 77. McNab BK: The Physiological Ecology of Vertebrates. New York: Cornell University Press 2002. 78. Koteja P: The evolution of endothermy in birds and mammals. Physiological and biochemical zoology 2004, 77(6):1043-1050. 79. Angilleta WJ, Sears MW: The metabolic cost of reproduction in an oviparous lizard. Functional Ecology 2000, 14(1):39-45. 80. Brose U, Jonsson T, Berlow EL, Warren P, Banasek-Richter C, Bersier LF, Blanchard JL, Brey T, Carpenter SR, Cattin Blandenier M-F, Cushing L, Dawah HA, Dell T, Edwards F, Harper-Smith S, Jacob U, Ledger ME, Martinez ND, Memmott J, Mintenbeck K, Pinnegar JK, Rall BC, Rayner TS, Reuman DC, Ruess L, Ulrich W, Williams RJ, Woodward G, Cohen JE: Consumer-resource body-size relationships in natural food webs. Ecology 2006, 87:2411-2417. 81. Cohen JE, Pimm SL, Yodzis P, Saldaña J: Body size of animal predator and animal prey in food webs. Journal of Animal Ecology 1993, 62:67-78. 82. Burness GP, Diamond J, Flannery TF: Dinosaurs, dragons, and dwarfs: The evolution of maximal body size. Proceeding of the National Academy of Sciences 2001, 98:518-523. 83. Martin AP, Palumbi SR: Body size, metabolic rate, generation time, and the molecular clock. Proceeding of the National Academy of Sciences 1993, 90:4087-4091. 84. May RM, Lawton JH, Stork NE: Assessing extinction rates. Extinction Rates New York: Okford University PressLawton JH, May RM 1995, 233. 85. Hawkins BA, Porter EE, Diniz-Filho JAF: Productivity and history as predictors of the diversity gradient of terrestrial birds. Ecology 2003, 84(6):1608-1623. 86. Currie DJ: Disentangling the roles of environment and spaces in ecology. Journal of Biogeography 2007, 34:2009-2011. doi:10.1186/1472-6785-10-18 Cite this article as: Toranza and Arim: Cross-taxon congruence and environmental conditions. BMC Ecology 2010 10:18.. Submit your next manuscript to BioMed Central and take full advantage of: • Convenient online submission • Thorough peer review • No space constraints or color figure charges • Immediate publication on acceptance • Inclusion in PubMed, CAS, Scopus and Google Scholar • Research which is freely available for redistribution Submit your manuscript at www.biomedcentral.com/submit.
(10)
Figure
Documento similar
In the preparation of this report, the Venice Commission has relied on the comments of its rapporteurs; its recently adopted Report on Respect for Democracy, Human Rights and the Rule
Early-life environmental influences, such as nutrition, chemical exposures and stress are suggested to interact with the genetic predisposition and later environmental influences
When consumers do not do everything in their power to take care of the environment and see the benefits that could be achieved with everyday actions (using rechargeable
Following these recommendations, the present study aims to further explore the relation between environmental attitudes and green purchase behaviour by taking into account
There are other factors in the development of cancer such as genetic, environmental, as well as the role of oxidative stress and free radicals in response to damage caused by
As mentioned before, a greener product helps lessen the environmental impact, maybe because its friendly environmental production or because of the reuse of
On the other hand, the mediating variables were attitudes and environmental benefits as perceived by the consumers of sustainable craft products, and the moderating variables were
As such, this study proposed five variables: (1) Promoting environmental sustainability through the mission of the university; (2) Assessment of universities’
