Effect of high salinitu, water stress and different sources of nitrogen on citrus physology
50
0
0
Texto completo
(2) TFG | Alma Nebot Vaya. Contents Abstract ________________________________________________________________________________________ 1 Resumen _______________________________________________________________________________________ 2 1. Introduction _________________________________________________________________________________ 3 1.1. Spain and the ci trus industry ____________________________________________________________________________ 3 1.2. Mineral nutrition _________________________________________________________________________________________ 3 1.3. Plant stress________________________________________________________________________________________________ 3 1.3.1. Water stress __________________________________________________________________________________________ 4 1.3.2. Salinity stress ________________________________________________________________________________________ 4 1.4. Hormones _________________________________________________________________________________________________ 5 1.4.1. ABA ___________________________________________________________________________________________________ 5 1.4.2. JA______________________________________________________________________________________________________ 5 1.2.3. SA _____________________________________________________________________________________________________ 5. 2. Objectives and work plan ____________________________________________________________________ 7 2.1. Study of the phisiology of citrus plants in conditions of combined stresses _________________________ 7 2.2 Work plan__________________________________________________________________________________________________ 7 2.3 Previuos studies ___________________________________________________________________________________________ 8 2.3.1. Dissolution stability study __________________________________________________________________________ 8 2.3.2. Watering level test ___________________________________________________________________________________ 9. 3. Equipment and methods ___________________________________________________________________ 11 3.1 Material and methods __________________________________________________________________________________ 11 3.2. Preparation of the Nutritive Solution _________________________________________________________________ 11 3.3. Physiological parameters ______________________________________________________________________________ 13 3.3.1. Gas exchange parameters _________________________________________________________________________ 13 3.4. Biochemical parameters _______________________________________________________________________________ 13 3.4.1. MDA concentration ________________________________________________________________________________ 13 3.4.2. Proline concentration _____________________________________________________________________________ 14 3.5. Hormonal analysis______________________________________________________________________________________ 14 3.5.1. ABA, JA and SA _____________________________________________________________________________________ 14 3.6. Nutricional analysis ____________________________________________________________________________________ 15 3.7. Statistical treatment. ___________________________________________________________________________________ 15.
(3) TFG | Alma Nebot Vaya. 4. Results and discussion _____________________________________________________________________ 16 4.1. Gas exchange parameters ______________________________________________________________________________ 16 4.1.1. Transpiration (E) __________________________________________________________________________________ 16 4.1.2. Stomatal conductance (g S) ________________________________________________________________________ 17 4.2. MDA _____________________________________________________________________________________________________ 18 4.3. Proline___________________________________________________________________________________________________ 19 4.4. Hormones _______________________________________________________________________________________________ 20 4.4.1. ABA _________________________________________________________________________________________________ 20 4.4.2. SA ___________________________________________________________________________________________________ 22 4.3.3. JA____________________________________________________________________________________________________ 23 4.5. Nutritional analysis ____________________________________________________________________________________ 24 4.5.1. Sulphur _____________________________________________________________________________________________ 24 4.5.2. Calcium _____________________________________________________________________________________________ 25 4.5.3. Chlori nes ___________________________________________________________________________________________ 26 4.5.5. Phosphorus ________________________________________________________________________________________ 28 4.5.6. Magnesium _________________________________________________________________________________________ 29 4.5.7. Total Nitrogen______________________________________________________________________________________ 30 4.5.8. Potassium __________________________________________________________________________________________ 31 4.5.9. Sodium _____________________________________________________________________________________________ 33 4.5.10. Boron _____________________________________________________________________________________________ 34 4.5.11. Copper ____________________________________________________________________________________________ 35 4.5.12. Iron________________________________________________________________________________________________ 37 4.5.13. Manganes e________________________________________________________________________________________ 38 4.5.14. Molybdenum _____________________________________________________________________________________ 39 4.5.15. Zinc ________________________________________________________________________________________________ 41 4.5.16. Sap pH ____________________________________________________________________________________________ 42 4.5.17. Sap conductivity__________________________________________________________________________________ 42. 5. Conclusions ________________________________________________________________________________ 44 6. Bibliography _______________________________________________________________________________ 46.
(4) TFG | Alma Nebot Vaya. Abstract Citrus are a key part in the Valencian economy. Every year millions of Euros are spent and recovered in this industry. One of the farmer’s worst nightmares are pests, diseases and damage due to abiotic factors, such as water, temperature, salinity, nutrition… One of the easiest factors to control is nutrition and fertilization. In citrus trees, these are key factors affecting directly both yield and quality. If they are controlled and carried on correctly, the benefits for the trees are many, but very damaging effects can be observed if fertilization is not adequate. Negative disturbances may be shown in similar ways, although they may be caused by very different reasons at a physiological, biochemical and hormonal level. To find out and study these differences, we analysed the effects of different abiotic stresses in leaves, roots and xylem sap of two year old Carrizo citrange plants (Citrus sinensis (L.) Osb. X Poncirus trifoliatg (L.) Raf). MDA, proline, hormones (ABA, SA and JA), and even nutritional analysis were carried out. The results obtained were varied and in mainly erratic. In most cases the oxidative stress results were not as high as expected bearing in mind the results from previous works consulted, but it’s probable that this may be due to the good initial state of the plants. The hormone results were consistent with previous works done, in which they accumulated as the oxidative stress damage increased. The results obtained from the nutritional analysis weren’t very clarifying. Just in some cases, like in for example sodium, were the results useful to make sure the experiment was carried out correctly.. 1.
(5) TFG | Alma Nebot Vaya. Resumen Los cítricos son un factor clave en la economía de la Comunidad Valenciana. Cada año millones de euros son invertidos y recuperados en esta industria. Uno de los mayores sufrimientos de los agricultores son las plagas, las enfermedades y los daños causados por factores abióticos como el agua, temperatura, sal, nutrición mineral… Uno de estos factores más fáciles de controlar son la fertilización y la nutrición. En cítricos son factores clave que afectan directamente en la producción y el rendimiento. Si son controlados y llevados a cabo correctamente, los programas nutricionales son muy beneficiosos para las plantaciones, pero muy perjudiciales si no. Estas alteraciones negativas se manifiestan externamente de maneras muy similares, pero pueden tener causas muy diferentes a niveles bioquímicos, hormonales y fisiológicos. Para encontrar y estudiar estas diferencias, se analizaron los diferentes efectos de los estreses abióticos en hojas, raíces y savia en plantas de citrange carrizo (Citrus sinensis (L.) Osb. X Poncirus trifoliatg (L.) Raf.) de dos años de edad. Se llevó a cabo MDA, prolina, hormonas (ABA, SA y JA) así como análisis nutricional. Los resultados obtenidos fueron variados y en su mayoría erráticos. En muchos de los resultados el estrés oxidativo no fue tan alto como era de esperar, teniendo en cuenta los resultados previos consultados, pero es posible que esto se debiese al correcto estado fisiológico de las plantas al inicio del experimento. Los resultados hormonales fueron más consistentes con resultados de ensayos previos, en los que al igual que este ensayo, se acumularon a medida que el estrés oxidativo aumentaba. Los datos obtenidos en el análisis nutricional no fueron muy esclarecedores. Sólo en algunos casos, como por ejemplo en sodio, fueron útiles para comprobar que el experimento se realizó correctamente.. 2.
(6) TFG | Alma Nebot Vaya. 1. Introduction 1.1. SPAIN AND THE CITRUS INDUSTRY Spain is known as the fruit store of Europe and Valencia is Spain’s leading producer of citrus fruit, including oranges, tangerines, grapefruit and lemons, which represents 65% of the total volume, followed by the regions of Murcia and Andalusia with 21.8% and 7.2% respectively (MAGRAMA, 2015). In 2014 fruits represented the 11% of the total exports of the region of Valencia, meaning a total income of 2.764 million euros. Among these fruits, citrus are the ones that stand out, representing a 72% of the exports more than 1,982 million euros. The first destiny of these fruits is Germany, followed by France and United Kingdom. The Valencian citrus sector managed to close 2012/2013 season with a record of foreign sales, by placing nearly three million tons of mandarins and oranges, increasing this value by 4,3%. But the production for the 2014/2015 season was of 3.415.105 tons, meaning a 2,4% decrease compared to the record season of 2012/2013. This crop reduction in mandarins and oranges is mainly due to faults in flowering, caused by the high temperatures suffered in winter and the abandoning of traditional varieties surface. However, the quality of the fruit increases every year, ensuring excellent calibre and sufficient quantity to be able to supply the growing demand. Just to highlight, Castellon stands out as the main producer of mandarins, being a 42% of the total production yield of the Valencian region (IVACE, 2015).. 1.2. MINERAL NUTRITION Nutrients are essential for the plants development. Both deficit and excess of nutrients and mineral leads to a reduction in crop yield, along with a decrease in fruit quality. These nutrient deficits and excesses are shown off most of the times on leaves, fruits and roots. If we focus on nitrogen, for example, a good control on it induces a correct development of the plant, along with an increase of flower production and fruit number. But an excess of nitrogen causes an excessive vegetative growth, which ends up damaging the final yield of the crop (HAIFA, 2017). Most of the mineral elements required by citrus to reach a correct nutritional state and yield come from the organic fraction of the soil or the decomposition of organic material that mineralises, but when the soil’s nutritional state becomes insufficient is when the fertilization plans come in. The nutritive elements given up by these fertilizers can be divided into macronutrients: primary (N, P, K) and secondary (Ca, Mg, S,) and micronutrients (Davies and Albrigo, 1994). Most of the farmers know that to be able to achieve high yields without losing quality and quantity, nutritional inputs have to be done with fertilizers. They are so important that reach to be up to 15-20% of the production cost (Rodríguez et al., 2005).. 1.3. PLANT STRESS Plant stress has been defined by Lichtenthaler (1996) as ‘any unfavourable condition or substance that affects or blocks a plant’s metabolism, growth or development’, by Strasser as ‘a condition caused by factors that tend to alter an equilibrium’, and by Larcher as ‘changes in. 3.
(7) TFG | Alma Nebot Vaya. physiology that occur when species are exposed to extraordinary unfavourable conditions that need not represent a threat to life but will induce an alarm response (Kranner et al., 2010). But what does all of this mean? Plants as humans and animals have stress. Maybe not in the same way as we do, but they are stressed by many different things, small changes unnoticeable to us, but critical for them. The first symptoms of stress at eye-sight may be very similar: dwarfism, change in colour, leave loss, flower loss, fruit loss and even death in the most severe cases, although they may be due to very different causes. At the least, when a plant suffers stress there will be a decrease in the production yield of that season, and it could even affect the production of the coming years if not detected and taken care of correctly. Plants are sessile and prone to multiple stresses in the changing environmental conditions. Of the several strategies adopted by plants to counteract the adverse effects of abiotic stress, phytohormones provide signals to allow plants to survive under stress conditions. They are one of the key systems integrating metabolic and developmental events in the whole plant and the response of plants to external factors and are essential for many processes throughout the life of a plant and influence the yield and quality of crops (Wani et al., 2016; Argamasilla et al., 2013). 1.3.1. Water stress. Water, comprising 80-90% of the biomass of non-woody plants, is the central molecule in all physiological processes of plants, as it is the major medium for transporting metabolites and nutrients. Drought is a situation that lowers plant water potential and turgor to the extent that plants face difficulties in executing normal physiological functions (Lisar et al.., 2012). Drought is an abiotic stress which takes place when the external conditions avoid the absorption of water being enough for the plant to recover from the losses of water due to transpiration. (Davies and Albrigo, 1994). Citrus plants are very sensitive to water deficit and its effects are various, which include leave loss, reduction in CO 2 assimilation, stomatal conductance, water potential and transpiration (Arbona et al., 2005). As a result, cell enlargement decrease leading to growth inhibition and reproductive failure (Lisar et al., 2012). All of this results in severe economic loses for the farmer and the industry (Rodríguez-Gamir et al., 2010). Plants adapt themselves to drought conditions by various physiological, biochemical, anatomical, and morphological changes, including transitions in gene expression. The main mechanism in which plants limit their water loss through transpirations in drought conditions is by closing the stomata, which results in the decreasing of the net assimilation of CO2 (GarcíaSánchez et al., 2007). In citrus plants it has been observed that under drought conditions proline is accumulated with the only objective to regulate the osmotic potential and compensate water deficit (Molinari et al., 2004). 1.3.2. Salinity stress. Salt stress is a condition where excessive salts in soil solution cause inhibition on the plant’s growth or even plant death. There is no other toxic substance on nature that restricts plant growth more than salt does. The over salinity of the soil is the main factor that limits the spreading of vegetal species in their natural habitat. Each year, salt stress represents a bigger threat to plant agriculture, as the new techniques of irrigation, along with poor drainage fires off the salt content in the agricultural land (Zhu, 2007).. 4.
(8) TFG | Alma Nebot Vaya. The effects of salt stress are observed at a cellular, organ and whole plant level and throughout the whole lifespan of the plant: from the osmotic phase up to the ionic phase. Under these conditions, physiological and metabolic activities of plants are impaired by osmotic stress, ionic stress, nutritional imbalances or combination of these factors. This results in the excessive accumulation of Na+ in the older leaves, which leads to premature senescence (Muchate et al., 2016).. 1.4. HORMONES Vegetal hormones or phytohormones are a group of growth regulating compounds which main function is to respond against environmental stresses (Eyidogan et al., 2012). Phytohormones are known to play vital roles in the ability of plants to acclimatize to varying environments, by mediating growth, development, source/sink transitions and nutrient allocation (Shah Fahad, 2014). Among this hormonal compounds involved in the response of plants against stress, the main ones are ABA, JA and SA (Eyidogan et al., 2012; Gómez-Cadenas et al., 1996). 1.4.1. ABA Abscisic acid (ABA) is a sesquiterpene known to regulate environmental stress responses in angiosperms, such as water-loss-induced stomatal closure, development of seed desiccation tolerance during maturation, and salt-, desiccation-, and freezing-stress tolerance of vegetative tissues. ABA has been proposed to play an important role in stress responses and/or adaptation as ABA mediated signalling is known to regulate the expression of salt-responsive-genes under salinity. ABA is often regarded as the stress hormone as it acts as the major internal signal enabling plants to survive adverse environmental conditions. It is now well thought-out as a plant stress hormone because different stresses tend to induce ABA synthesis (Fahad, 2014). Stomatal closure and induction of the expression of multiple genes involved in defence against water stress are known functions of ABA (Lisar et al., 2012; Arbona et al., 2012; de Ollas et al., 2013). 1.4.2. JA The cyclopentanone phytohormones derived from the metabolism of membrane fatty acids including primarily methyl jasmonate (MeJA) and its free acid jasmonic acid (JA) are collectively called jasmonates (JAs) and are widespread in the plant kingdom (Wani et al., 2016). They are vital cellular regulators involved in diverse plant development processes, including seed germination, callus growth, primary root growth, flowering, formation of gum and bulb, and senescence. Biosynthesis of JA occurs in leaves and there is proof of a similar pathway in roots. These are known to activate the plant defence responses to various biotic and abiotic stresses. Along with ABA they have been related acting on the citrus fruit against these stresses (Fahad, 2015; Wani et al., 2016; de Ollas et al., 2013). 1.2.3. SA Salicylic acid is an endogenous growth (Fahad, 2014) and pathogenesis-associated protein expression regulator (Wani et al., 2016) and belongs to a group of phenol compounds. It. 5.
(9) TFG | Alma Nebot Vaya. participates in the regulation of physiological processes and also provides protection against biotic and abiotic stress such as salinity. One of the main roles of SA in the plants is the control and regulation of responses to biotic stresses; however, a large body of literature now suggests that SA is also involved in responses to several abiotic stresses including salt stress (Fahad, 2014). SA along with ABA is involved in the regulation of drought response (Wani et al., 2016).. 6.
(10) TFG | Alma Nebot Vaya. 2. Objectives and work plan 2.1. STUDY OF THE PHISIOLOGY OF CITRUS PLANTS IN CONDITIONS OF COMBINED STRESSES The objective of this project is to study the common and specific responses in Carrizo citrange plants after being grown in different conditions of nutrition, salinity and water deficit. To do this, each of these three factors were applied alone or combined with the others to investigate how they interfered all together on the plant’s development. There were 9 different nutritive solutions, each one with a different content of mineral salts. During the 2 weeks of the experiment, each group of plants were watered with their own nutritive solution. Once the 2 weeks ended, leaves, roots and sap from all the plants within the different groups were randomly sampled. From these samples, responses at a physiological, biochemical and hormonal level were characterized and compared.. 2.2 WORK PLAN The plants were sorted into 9 different groups: 1 100% nitric 5 plants 2 100% nitric + 15 meq NaCl 6 plants 3 100% nitric + 30 meq NaCl 6 plants 4 100% ammonium 5 plants 5 100% ammonium + 15 meq NaCl 6 plants 6 100% ammonium + 30 meq NaCl 6 plants 7 50% nitric + 50% ammonium 5 plants 8 50 % nitric + 50% ammonium + 15 meq NaCl 6 plants 9 50% nitric + 50% ammonium + 30 meq NaCl 6 plants ⇨ Total number of plants: 51 ⇨ 9 thesis In each of this thesis there were 2 different watering levels: o Control (100% water requirement) 0,5 L o Water deficit (50% water requirement) 0,25 L The watering schedule was: Monday, Wednesday and Friday always around the same hour (1112 a.m.).. 7.
(11) TFG | Alma Nebot Vaya. The plants were sorted out randomly on the greenhouse table, but to be able to identify them to apply the nutritive solution to each plant with the watering level stated, the scheme bellow was followed:. A B C D. 1 9b 6b 5b. 2 5b 2b 7b 8b. 3 1b 8a 4b 9a. 4 3b 9b 7a 6b. 5 8a 6b 2b 1b. 6 7b 6b 5b 4b. 7 8b 1a 9a 3b. 8 2a 5a 6a 7a. 9 7b 9b 4a 3a. 10 8b 1b 6b 5b. 11 9a 4b 3b 2b. 12 5a 6a 7a 8a. 13 1a 2a 3a 4a. Figure 1. Distribution of the different plants on the greenhouse table. The letter “a” is to identify the watering level at 50% and “b” at 100%.. 2.3 PREVIUOS STUDIES 2.3.1. Dissolution stability study The dissolutions of ammonium sulphate with DMPP, combined with the product named Alcaplant, may have problems of precipitate appearing at a low pH. To find out how each solution could react with this reactive, a sample of each was prepared and tested. N-P 205 -K2 O-CaO-MgO (94:30:70:80:30) [gr/L] (NH4)2SO4 +DMPP. H6NO4 P. K2SO4. Mgso4. Alcaplant. NaCl. 100% 0,42 0,05 0,14 0,19 0,228 ammonium 100% ammonium 0,42 0,05 0,14 0,19 0,228 0,8 + 15 meq NaCl 100% ammonium 0,42 0,05 0,14 0,19 0,228 1,7 + 30 meq NaCl Table 1. Salts and weights used to carry out the dissolution stability study.. Three solutions were prepared and left to mix in continuous stirring during 5 minutes. The pH was then measured and left to settle down to see if any precipitate appeared. Precipitates appeared in every sample, but just after the addition of the Alcaplant. To verify it was only when the Alcaplant was added, the test was repeated but only adding the following salts: 1- 1L water + 0,420 gr ammonium sulphate. 2- 1L water + 0,420 gr ammonium sulphate + 0,05 monoammonium phosphate. 3- 1L water + 0,420 gr ammonium sulphate + 0,05 monoammonium phosphate + 0,140 potassium sulphate. 4- 1L water + 0,420 gr ammonium sulphate + 0,05 monoammonium phosphate + 0,140 potassium sulphate + 0,190 magnesium sulphate. 5- 1L water + 0,420 gr ammonium sulphate + 0,05 monoammonium phosphate + 0,140 potassium sulphate + 0,190 magnesium sulphate + 0,8 sodium chloride. 6- 1L water + 0,420 gr ammonium sulphate + 0,05 monoammonium phosphate + 0,140 potassium sulphate + 0,190 magnesium sulphate + 0,8 sodium chloride + 1,7 sodium chloride.. 8.
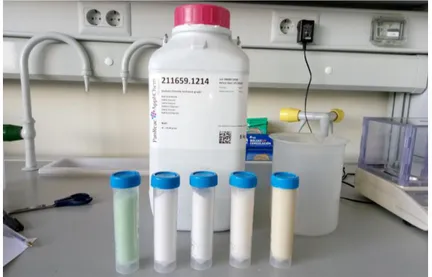
(12) TFG | Alma Nebot Vaya. None of the dissolutions prepared precipitated, so it was the Alcaplant the one that made the precipitate appear. A pH test was also carried out, to find out at which pH the precipitates appeared: - 100% ammonium without Alcaplant: 7,64 - 100% ammonium with Alcaplant: 9,08 In none of the two dissolutions adding phosphoric acid until pH=2 produces precipitate. -. 100% ammonium + 15 meq NaCl: 8,95 100% ammonium + 30 meq NaCl: 8,99. Picture 1. Example of one of the solutions prepared to carry out the dissolution stability test on continuous stirring.. 2.3.2. Watering level test The watering level test was carried out two times, one in March to be able to find out the amount of salts needed and then another one in April to make sure that the rise in temperature didn’t affect the results obtained in March. Four plants of the experiment that were already settled in the greenhouse were randomly selected and separated. Each of these plants were set on an individual tray. The plants were then watered with 2L of water. After 15 minutes all the water on the tray was recollected and measured, so the correct amount of watering level could be found out. The results obtained on both test were very similar: - Water stressed: 0,250 L - Control: 0,500 L Knowing these amounts, we could calculate the total amount of nutritive solution needed to prepare for the whole test.. 9.
(13) TFG | Alma Nebot Vaya. Picture 2. Watering level test carried out in the greenhouse.. 10.
(14) TFG | Alma Nebot Vaya. 3. Equipment and methods 3.1 MATERIAL AND METHODS In the experiments described below, 2 year-old plants of the rootstock Carrizo citrange (Citrus sinensis (L.) Osb. X Poncirus trifoliatg (L.) Raf ) were used. The plants were grown in 2 L pots, with a mixture of peat, perlite and vermiculite (80:10:10) as soil. Before the beginning of the experiments, the plants were settled in the greenhouse with a natural photoperiod and daytime temperature of 20.0±3.0ºC and 17.0±3.0ºC at night. The plants were watered 3 times per week with 0,5L of nutritive solution of Hoagland (Arbona et al., 2009). The experiments were carried out during the month of May.. 3.2. PREPARATION OF THE NUTRITIVE SOLUTION From the results gathered from the watering level test and the known concentrations of the different salts the nutritive solutions were prepared following the table below: Salt weight [gr/L] Nutritive solution 100% nitric 100% nitric + 15 meq NaCl 100% nitric + 30 meq NaCl. Monopotasic phosphate. Potasic nitrate. Calcium nitrate. Ammonium Monoamonic sulphate phosphate. Potasic sulphate. Magensium sulphate. Alcaplant. Ammonium Sodium nitrate chloride. 0,06. 0,11. 0,30. 0,30. 0,06. 0,11. 0,30. 0,30. 0,80. 0,06. 0,11. 0,30. 0,30. 1,70. 100% ammonium 100% ammonium + 15 meq NaCl 100% ammonium + 30 meq NaCl 50% nitric + 50% ammonium 50% nitric+ 50% ammonium + 15 meq NaCl 50 % nitric + 50 %ammonium + 30 meq NaCl. Magnesium nitrate. 0,42. 0,05. 0,14. 0,19. 0,23. 0,42. 0,05. 0,14. 0,19. 0,23. 0,80. 0,42. 0,05. 0,14. 0,19. 0,23. 1,70. 0,02. 0,05. 0,12. 0,19. 0,23. 0,25. 0,02. 0,05. 0,12. 0,19. 0,23. 0,25. 0,80. 0,02. 0,05. 0,12. 0,19. 0,23. 0,25. 1,70. Table 2. Salt weights used to prepare each nutritive solution in gr/L.. 11.
(15) TFG | Alma Nebot Vaya. Picture 3. Some of the mineral salts used to prepare the different nutritive solutions.. After the nutritive solutions were prepared, we measured pH and electric conductivity.. Figure 2. pH and electric conductivity of the different nutritive solutions prepared.. 12.
(16) TFG | Alma Nebot Vaya. As it was expected, the electric conductivity increased as the amount of salt present in the nutritive solution increased. In the case of pH, it was the combination of nitric and ammonium in the nutritive solution the cause of the pH increase.. 3.3. PHYSIOLOGICAL PARAMETERS 3.3.1. Gas exchange parameters. All along the experimental period, gas exchange parameters were measured two times. To take these measurements, an Lcpro+ portable infrared gas analyser (ADC bioscinetific Ltd., Hoddesdon, RU) was used. An artificial radiation of 1000 µmol m-2 s-1 and air flow was established at 150 µmol s-1. All the measurements were done at room temperature under ambient CO2 and moisture. After the settlement of the machine, various leaves of each plant were chosen. These leaves had to be from the middle part of the plant and of medium size.. Picture 4. Lcpro+ portable infrared gas analyser.. 3.4. BIOCHEMICAL PARAMETERS 3.4.1. MDA concentration. To find out the the oxidative damage caused due to the oxidative stress of the water deficit, the method described in Arbona et al. (2008) was followed, but with the extraction of MDA through ultrasounds. 0,2 g of tissue were homogenized in 2 mL of ethanol at 80% (Panreac S.A., Barcelona, Spain). Homogenated were centrifuged at 4000 rpm during 30 minutes at 4ºC.. 13.
(17) TFG | Alma Nebot Vaya. Different aliquots of supernatant wer mixed either with 20% TCA (Panreac) or with a mixture of 20% TCA and and 0.5% TBA (Sigma-Aldrich, St.Louis, MO). Both mixtures were left to react at 900C in water bath for 1 hour. After this samples were cooled in an ice bath for 15 minutes and centrifuged at 2000 rpm during 10 minutes at 40C. Finally, the absorbance was read at 440, 532 and 600 nm for the mixture with both TCA and TBA; and at 532 and 600 nm for the reaction with only TCA. The concentration of MDA was found out using the following formula: 1) [(Abs 532+TBA)-(Abs 600+TBA)-(Abs 532-TBA-Abs 600-TBA)] = X 2) [(Abs 440+TBA-Abs 600+TBA)·0.0571] = Y 3) Equivalents of MDA (nmol ml-1) = (X-Y/157000) ·106. Picture 5. Cubes with the extracts used for MDA determination. 3.4.2. Proline concentration. To find out the concentration of proline, the protocol described by Arbona et al. (2003) was followed, with a few modifications. 0,05g of tissue were extracted in 5mL of 3% sulfosalicylic acid (Panreac) using the ultrasound bath. The mixture was centrifuged at 4000 rpm during 45 minutes at 40C and 1 mL of the supernatant was recovered, that was then dissolved in a combination of glacial acetic acid (Panreac) and ninhydrin reagent in a 1:1 (v/v) ratio. Following this, the mixture was incubated at 100ºC in a water bath for 1 hour. When the time finished, the mixture was left to cold out in an ice bath and afterwards it was centrifuged at 2000 rpm during 10 minutes at 40C. Absorbance at 520 nm was measured. A standard curve was performed with stardad proline (Sigma-Aldrich; Madrid, Spain).. 3.5. HORMONAL ANALYSIS 3.5.1. ABA, JA and SA. To study the phytohormones the protocol of Durgbanshi et al. (2005) and Arbona et al., (2008) were followed. 0,2g of vegetal material was weighed (leaves and roots) and mixed with intern patrons: 100 ng of [2H6]-ABA, [13C6)]-SA and dihydrojasmonic acid. Plant material was extracted. 14.
(18) TFG | Alma Nebot Vaya. in 2 ml of ultrapure water 5 mL of milli-Q water in a ball mill (MillMix20, Domel, Železniki, Slovenija). After centrifuging the samples at 4700 rpm at 40C the supernatant was collected and the pH was adjusted to 3.0 with 30% acetic acid. Two dilutions with 2 ml of ethylic ether (Panreac). The organic phase was recovered and evaporated under vacuum in a centrifuge concentrator (Speed-Vac, Jouan, Saint-Herblain, France). The dry residue resultant is resuspended in a solution of water:methanol (90:10) and passed through a regenerated cellulose filter with a pore size of 0.2 µm and injected into an ultra-performance liquid chromatography system (Acquity SDS, Waters Corp., Milford, MA, USA) then injected in the HPLC equipment (Alliance 2695 Water Corp. Milford, EEUU) . Chromatographic separations were carried out on a reversed-phase C18 column (Gravity, 50 × 2.1 mm 1.8-μm particle size, Macherey-Nagel GmbH, Germany) using a methanol:water (both supplemented with 0.1 % acetic acid) gradient at a flow rate of 300 μL min−1. Hormones were quantified with a triple quadrupole mass spectrometer (Micromass, Manchester, UK) connected online to the output of the column though an orthogonal Z-spray electrospray ion source.. 3.6. NUTRICIONAL ANALYSIS The samples of sap, leaves and roots were freezed and sent to an external laboratory which carried out the nutritional analysis. The lab was Agrama, located in Seville. To sample the sap from the plants, Scholander’s chamber was used.. Picture 6. Pressure chamber similar to Scholander’s chamber used to extract sap to carry out the tests.. 3.7. STATISTICAL TREATMENT. The results were analysed with the program InfoStat (Di Rienzo et al., 2012). To analyse the results a comparison of means was done (Tukey method, p< 0,05).. 15.
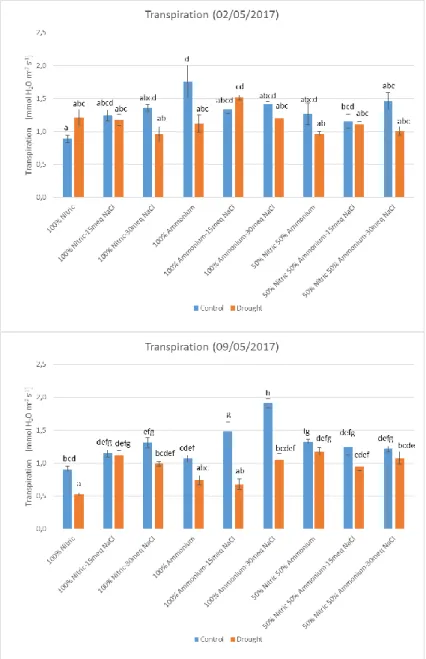
(19) TFG | Alma Nebot Vaya. 4. Results and discussion 4.1. GAS EXCHANGE PARAMETERS 4.1.1. Transpiration (E). In Figure 3. transpiration along the experimental period is represented. No significant differences can be observed between the two graphs. In general, in both days, transpiration was higher in control plants than water stressed plants. Just to stand out, the highest transpiration value for the first day is ammonium 100% control plants and for the second it changed into 100% ammonium + 30 meq NaCl control plants.. Figure 3. Transpiration in leaves for plants watered with different nutritive solutions. In each figure, blue bars stand for control and orange bars stand for drought conditions. Each bar has at least 3 independent determinations ± ES.. 16.
(20) TFG | Alma Nebot Vaya. 4.1.2. Stomatal conductance (gS). Along with E, gs was measured and represented in Figure 4. It didn’t show significant differences between the two measuring dates. As for E, on day 09/05 practically all control plants have higher values of stomatal conductance than water stressed plants, for all the different nutritive solutions. On the first day, it stands out that for the 50:50 solution all the control plants had higher values for stomatal conductance than water stressed plants.. Figure 4. Stomatal conductance in leaves for plants watered with different nutritive solutions. In each figure blue bars stand for control and orange bars stand for drought conditions. Each bar has at least 3 independent determinations ± ES.. The results obtained from these measurements were consistent with previous works which compared the physiological effects of water stressed plants. Both E and gs, which are gas exchange parameters, decreased in the plants which were in water stress. 17.
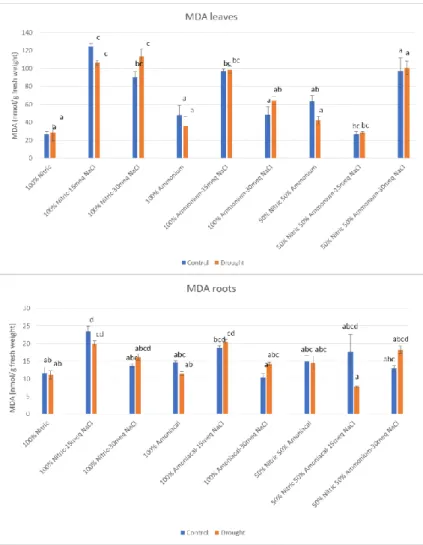
(21) TFG | Alma Nebot Vaya. conditions and watered with nutritive solutions containing NaCl. It is known that watering with NaCl has the same physiological effect that keeping the plants in drought conditions (García-Sáchez et al., 2007; Arbona et al., 2009).. 4.2. MDA MDA levels in leaves and roots are shown in the Figure 5. In leaves, this oxidative stress marker increased in the groups which were watered with NaCl in which the main source of nitrogen was in the nitric form and the ones watered with 15 meq of NaCl as the ammonium nitrogen source. 50:50 nitrogen source mixture combined with salinity seems to have an effect on the MDA increase. Plants watered with the solutions with both nitric and ammonium, MDA increased when they were watered with 30 meq NaCl. In roots there were no big differences observed between the MDA levels within the different treatments. Only in the case of the plants watered with the 50:50 + 15 meq NaCl solution significant differences were observed. It’s important to highlight the big difference of MDA percentage between leaves and roots.. Figure 5. MDA concentration in leaves and roots for plants watered with different nutritive solutions. In each figure, blue bars stand for control and orange bars stand for drought conditions. Each bar has at least 3 independent determinations ± ES. Different letters show off statistical significant differences, according to Tukey’s test (p ≤ 0.05).. 18.
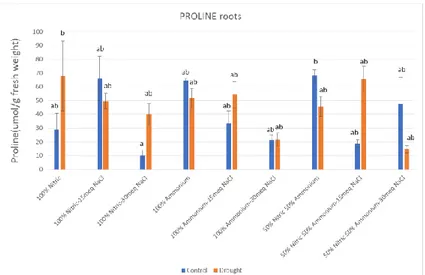
(22) TFG | Alma Nebot Vaya. In all types of abiotic stress, the main effect is the increase on the production of ROS, which result in oxidative damage to the plant. This damage is increased as the stress pressure on the plant increases, therefore correlating positively with the sensitivity to a determined stress condition (Arbona et al., 2003; 2008). In this work, oxidative damage was measured through the accumulation of MDA. Although there were no significant differences between control and stressed plants, it could be seen that in most cases, MDA levels were higher on control plants watered with the nutritive solution containing NaCl. This shows that the oxidative damage was higher on plants watered with the correct amount of water, but containing a high amount of salt than on water stressed plants. There is a big difference between the MDA content on leaves and roots, which means that the stress is showed off in leaves.. 4.3. PROLINE Proline levels in leaves and roots are shown in Figure 6. In leaves no significant differences were found between control and water stressed plants. For roots, there were many differences between thesis, control and water stressed plants. In some groups as plants watered with nitric solution with 30 meq NaCl and 50:50 with 15 meq, proline was significantly higher in water stressed plants than well-watered plants.. 19.
(23) TFG | Alma Nebot Vaya. Figure 6. Proline concentration in leaves and roots for plants watered with different nutritive solutions. In each figure, blue bars stand for control and orange bars stand for drought conditions. Each bar has at least 3 independent determinations ± ES. Different letters show off statistical significant differences, according to Tukey’s test (p ≤ 0.05).. Proline acts as a compatible osmolyte, which helps the plant cope with different abiotic stress through: osmotic adjustment, osmoprotection, ROS detoxification, cytosolic acidity regulation and C and N reserve after the stress recuperation (Arbona et al., 2003, 2008; Vendruscolo et al., 2007). It can be also involved in scavenging of free radicals, thereby protecting cellular structures against oxidative damage (García-Sánchez et al., 2007). In our experiment, the increase of proline may be related to an increase of stress caused by the water stress conditions or the salt present in the nutritive solutions, as in most cases, the proline content (in leaves) increases as the amount of salt in the solution increases.. 4.4. HORMONES 4.4.1. ABA. ABA content in leaves, roots and sap are shown on Figure 7. In leaves, this phytohormones was significantly higher on the control plants watered with the nutritive solution of 100% ammonium and 100% nitric + 15 meq NaCl. For roots, ABA concentration was similar in most groups of control plants while in water stressed plants was significantly high in the groups watered with 100% nitric, 100% nitric + 30 meq NaCl, 100% ammonium + 15 meq NaCl and 50:50 nutritive solutions. ABA contents in sap were high for both control and water stressed plants for the ones watered with the 100% nitric + 30 meq NaCl. It was also significantly high for the water stressed plants watered with 100% nitric nutritive solution and for the control plants watered with 50:50 + 15 meq NaCl. All the other ones had no significant differences between the control and water stressed plants.. 20.
(24) TFG | Alma Nebot Vaya. Figure 7. ABA content in leaves, roots and xylem sap for plants watered with different nutritive solutions. In each figure, blue bars stand for control and orange bars stand for drought conditions. Each bar has at least 3 independent determinations ± ES. Different letters show off statistical significant differences, according to Tukey’s test (p ≤ 0.05).. 21.
(25) TFG | Alma Nebot Vaya. 4.4.2. SA. SA levels of leaves, roots and sap can be observed in Figure 8. In leaves, there were significant differences between the plants watered with 100% nitric + 15 meq NaCl and 50:50 solutions, being the control plants the ones with higher values. In the case of roots, there were many significant differences between groups, being the control plants watered with 100% ammonium the one with the higher value and 50:50 + 15 meq NaCl water stressed plant the one with the lower value. In sap there were no significant differences, except for the high value of the water stressed plant watered with 100% ammonium solution.. 22.
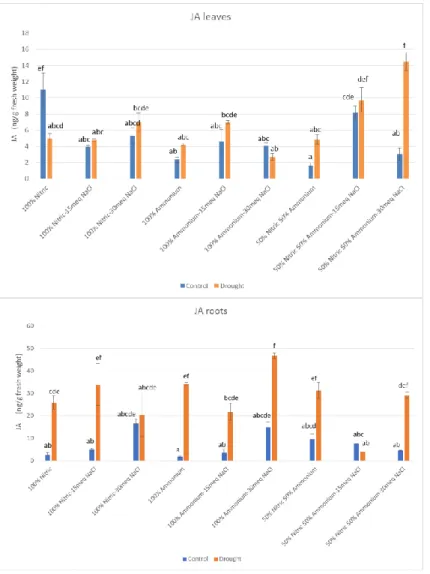
(26) TFG | Alma Nebot Vaya. Figure 8. SA content in leaves, roots and sap for plants watered with different nutritive solutions. In each figure, blue bars stand for control and orange bars stand for drought conditions. Each bar has at least 3 independent determinations ± ES. Different letters show off statistical significant differences, according to Tukey’s test (p ≤ 0.05).. 4.3.3. JA. JA contents of leaves, roots and sap are shown on Figure 9. In leaves, there were significant differences between the control and water stressed plants watered with 100% nitric, 50:50 + 15 meq NaCl and 50:50 + 30 meq NaCl, being plants of the group which combines the two sources of nitrogen, salinity and water stress the ones with higher results of this phytohormone. In roots, all the water stressed plants had higher JA levels than the control plants, being especially high the one watered with 100% ammonium + 30 meq NaCl. In the control plants there weren’t big differences between different nutritive solutions. In the case of sap, the content of JA was high for both control and water stressed plants watered with the nutritive solution of 100% ammonium + 15 meq NaCl. It was also significantly high the JA content in control plants watered with 100%nitric + 30 meq and water stressed plants watered with 100% ammonium.. 23.
(27) TFG | Alma Nebot Vaya. Figure 9. JA content in leaves, roots and sap for plants watered with different nutritive solutions. In each figure, blue bars stand for control and orange bars stand for drought conditions. Each bar has at least 3 independent determinations ± ES. Different letters show off statistical significant differences, according to Tukey’s test (p ≤ 0.05).. Phytohormones have a key role in the adaptation of plants into abiotic stress conditions, and within all of them, ABA is the most studied hormone of all (Eyidogan et al., 2012). JA has been traditionally associated to the response to pathogens and wounds, although recently it has been related to the response regulations to abiotic stress (Arbona and Gómez-Cádenas, 2008; de Ollas et al., 2013). And SA is related to the regulation of plant growth, development, ripening, flowering, thermogenesis and responses to abiotic stresses (Gómez-Cádenas et al., 2015). As mentioned earlier, the higher accumulations of these three phytohormones are found on leaves. These results are concordant with the results published by de Ollas et al. (2013) in which JA had a very similar behavior to ABA, and both are accumulated in leaves after a long period of water stress. Also, cumulative evidence suggests that the crosstalk between SA and ABA is important for adaptation of plants to combination of abiotic and biotic stress cues (GómezCádenas et al., 2015). So this proves once more the existing relationship between JA, ABA and SA and their physiologic response to abiotic stresses.. 4.5. NUTRITIONAL ANALYSIS 4.5.1. Sulphur. Sulphur contents on leaves and roots are represented on Figure 10. The % of sulphur found on roots was in many cases double than the one found on leaves. In leaves there were no differences between control and water stressed plants waters with different nutritive solutions. On the other hand, on roots, the % of sulphur was higher on water stressed plants than on the controls. The percentage of sulphur was especially high on the plants watered with the 3 nitric based nutritive solutions, along with the 100% ammonium + 15 meq NaCl and the 50:50 + 30 meq NaCl.. 24.
(28) TFG | Alma Nebot Vaya. Figure 10. Sulphur content in leaves, roots and sap for plants watered with different nutritive solutions. In each figure, blue bars stand for control and orange bars stand for drought conditions. Each bar has at least 3 independent determinations ± ES.. 4.5.2. Calcium. Calcium found on leaves, roots and sap is represented on Figure 11. In leaves, there were no big differences between control and water stressed plants. Between the different nutritive solutions, for each combination of nitrogen source, it seems that there is a decreasing tendency in calcium content with the increase of NaCl concentration. In roots, well watered plants didn’t show big differences between groups but in water stressed plant calcium increased as salinity did. In sap the levels of calcium generally were higher in water stressed plants than in their controls. The highest values of calcium correspond to the water stressed plants watered with the 3 nutritive solutions based on nitric as its nitrogen source and the one with 100%.. 25.
(29) TFG | Alma Nebot Vaya. Figure 11. Calcium content in leaves, roots and sap for plants watered with different nutritive solutions. In each figure, blue bars stand for control and orange bars stand for drought conditions. Each bar has at least 3 independent determinations ± ES.. 4.5.3. Chlorines. Chlorine levels found on leaves, roots and sap are represented on Figure 12. Due to a problem in the external lab which carried out the nutritive analysis of the samples of leaves, roots and. 26.
(30) TFG | Alma Nebot Vaya. sap, some results of chlorine for leaves were not given. There are no significant differences between water stressed plants and control plants in any case. Just to mention the high value of chlorines % found on leaves for the control plants watered with 100%ammonium + 15 meq NaCl. In the three cases, the shape of the graph is very similar for the 100% nitric solution having water stressed plants a slightly higher content of chlorines in leaves, roots and sap. Although the total content of chlorines cannot be compared, the graphics for roots and sap follow in most cases the same pattern.. 27.
(31) TFG | Alma Nebot Vaya. Figure 12. Chlorine content in leaves, roots and sap for plants watered with different nutritive solutions. In each figure, blue bars stand for control and orange bars stand for drought conditions. Each bar has at least 3 independent determinations ± ES.. 4.5.5. Phosphorus. Phosphorus contents of leaves, roots and sap are shown on Figure 13. In leaves of well-watered plants there was a trend to increase phosphorus percentage as NaCl increased depending on the nitrogen source. In general, control plants showed higher percentage than water stressed plants. In roots such differences cannot be seen, being only noticeable the difference between control and water stressed plants watered with the 50:50 + 30 meq NaCl nutritive solution. The same happens with sap, as only significant differences could be observed between the control and water stressed plants watered with 100% nitric solution and 100% nitric + 30meq NaCl solution.. 28.
(32) TFG | Alma Nebot Vaya. Figure 13. Phosphorus content in leaves, roots and sap for plants watered with different nutritive solutions. In each figure, blue bars stand for control and orange bars stand for drought conditions. Each bar has at least 3 independent determinations ± ES.. 4.5.6. Magnesium. Magnesium levels of leaves, roots and sap are represented on Figure 14. On leaves, there were significant differences between the different nutritive solutions, being the ones with NaCl the ones with higher % of magnesium. In roots there were no significant differences between water stressed plants, control and nutritive solutions. The amount of magnesium found on sap was always higher on water stressed plants than on control plants, being the plants watered with the nutritive solutions of nitric as its nitrogen source, the ones with higher values.. 29.
(33) TFG | Alma Nebot Vaya. Figure 14. Magnesium content in leaves, roots and sap for plants watered with different nutritive solutions. In each figure, blue bars stand for control and orange bars stand for drought conditions. Each bar has at least 3 independent determinations ± ES.. 4.5.7. Total Nitrogen. The total % of nitrogen found on leaves and roots is represented on Figure 15. In leaves, except for the plants watered with the 100% nitric nutritive solution, all the rest control plants had. 30.
(34) TFG | Alma Nebot Vaya. higher values of total nitrogen than the water stressed plants. In the combinations 100% nitric + 15 meq NaCl, 100% ammonium, 100% ammonium + 15 meq NaCl and 50:50 nitric/ammonium water stressed plants showed approximately a reduction of 50% related to their controls. In roots the difference between control and water stressed plants was smaller. In water stressed plants watered with the combination nitric/ammonium there was an increase in the total amount of nitrogen.. Figure 15. Total nitrogen content in leaves and roots for plants watered with different nutritive solutions. In each figure, blue bars stand for control and orange bars stand for drought conditions. Each bar has at least 3 independent determinations ± ES.. 4.5.8. Potassium. Potassium content on leaves, roots and sap is found on Figure 16. There were no differences in any of the graphs. Just to stand out, the content of potassium in sap was always higher for water stressed plants, but not for the ones watered with the 100% nitric and 50:50 + 15 meq NaCl solutions.. 31.
(35) TFG | Alma Nebot Vaya. Figure 16. Potassium content in leaves, roots and sap for plants watered with different nutritive solutions. In each figure, blue bars stand for control and orange bars stand for drought conditions. Each bar has at least 3 independent determinations ± ES.. 32.
(36) TFG | Alma Nebot Vaya. 4.5.9. Sodium. Sodium contents found on leaves, roots and sap are represented on Figure 17. In leaves, the highest % correspond to the water stressed plants watered with 100% ammonium as nitrogen source solution. There were no visible correlation between the content of NaCl in the nutritive solution used to water the plants and the % of Na found on the leaves. In the case of roots, the control plants watered with 100% nitric + 30 meq NaCl, 100% ammonium + 30 meq NaCl and 50:50 + 30 meq NaCl had the higher % of NaCl. It’s also noticeable that the control plants watered with the nutritive solutions without NaCl had very low values of Na, but their water stressed plants had much higher % of Na. In sap, the water stressed plants have always higher values of Na except for the ones watered with 100% nitric + 30meq NaCl and 50:50 + 15 meq NaCl. There were also big differences between the water stressed plants values and its controls for the plants watered with ammonium or nitric +15 meq NaCl and the combination of nitric/ammonium with 30 meq NaCl.. 33.
(37) TFG | Alma Nebot Vaya. Figure 17. Sodium content in leaves, roots and sap for plants watered with different nutritive solutions. In each figure, blue bars stand for control and orange bars stand for drought conditions. Each bar has at least 3 independent determinations ± ES.. 4.5.10. Boron. Boron contents in leaves, roots and sap are shown in Figure 18. The amount of boron found on leaves is higher than the amount found on roots or sap. In general there were no differences between control and water stressed plants in any of the three cases.. 34.
(38) TFG | Alma Nebot Vaya. Figure 18. Boron content in leaves, roots and sap for plants watered with different nutritive solutions. In each figure, blue bars stand for control and orange bars stand for drought conditions. Each bar has at least 3 independent determinations ± ES.. 4.5.11. Copper. Levels of copper found on leaves, roots and sap are represented on Figure 19. In leaves, the amount of copper was high on control plants watered with 100% ammonium + 15 meq NaCl, 50:50 + 30 meq NaCl and water stressed plants watered with 100% nitric and ammonium + 30 meq NaCl. For the rest of the plants the results were low and with no differences. In roots, it seems to be a trend in which, for every source of nitrogen and the mix of nitric with ammonium, there was an increase of this ion as salinity did. In sap, the only plants showing off any relevant difference were the control plants watered with 100% nitric solution.. 35.
(39) TFG | Alma Nebot Vaya. Figure 19. Copper content in leaves, roots and sap for plants watered with different nutritive solutions. In each figure, blue bars stand for control and orange bars stand for drought conditions. Each bar has at least 3 independent determinations ± ES.. 36.
(40) TFG | Alma Nebot Vaya. 4.5.12. Iron. Iron levels found on leaves, roots and sap are described in Figure 20. For leaves, the content of iron increased in plants watered with nitric solution + 30 meq NaCl in both well watered and water stressed plants. In plants watered with ammonium solution and the ones watered with 50:50 + 15 meq NaCl solution this ion increased in water stressed plants. In the case of roots, as in leaves, plants watered with ammonium solution with salt showed high content of iron in control and water stressed plants. Water stressed plants watered with 100% nitric + 15 meq NaCl was the one showing off the highest levels. It’s noticeable that the levels of iron found in roots are more than double the ones found on leaves for any plant. In sap the only ones with a significant difference compared to the other plants were the water stressed plants watered with 100% nitric solution.. 37.
(41) TFG | Alma Nebot Vaya. Figure 20. Iron content in leaves, roots and sap for plants watered with different nutritive solutions. In each figure, blue bars stand for control and orange bars stand for drought conditions. Each bar has at least 3 independent determinations ± ES.. 4.5.13. Manganese. Manganese levels found on leaves, roots and sap are shown on Figure 21. The amount of manganese found on leaves was much lower than the amount found on roots. In leaves there were no relevant differences, to highlight water stressed plants watered with ammonium alone or with salt and with the combination of nitric and ammonium showed more content of manganese than their controls. In roots only the high value of control plants watered with 100% ammonium + 30 meq NaCl stand out. In sap the results obtained had no big differences except for the plants watered with 100% nitric solution.. 38.
(42) TFG | Alma Nebot Vaya. Figure 21. Manganese content in leaves, roots and sap for plants watered with different nutritive solutions. In each figure, blue bars stand for control and orange bars stand for drought conditions. Each bar has at least 3 independent determinations ± ES.. 4.5.14. Molybdenum. The levels of molybdenum found on leaves, roots and sap are shown on the Figure 22. It stands out the high amounts of molybdenum found on roots compared to the amounts found on leaves. In neither of these two cases relevant differences show off. In sap, there were differences between the plants watered with 100% nitric, 100% nitric + 15 meq NaCl, 100% ammonium + 30 meq NaCl and 50:50 + 30 meq NaCl. For the rest of the plants the results have no considerable differences between them.. 39.
(43) TFG | Alma Nebot Vaya. Figure 22. Molybdene content in leaves, roots and sap for plants watered with different nutritive solutions. In each figure, blue bars stand for control and orange bars stand for drought conditions. Each bar has at least 3 independent determinations ± ES.. 40.
(44) TFG | Alma Nebot Vaya. 4.5.15. Zinc. Zinc levels for leaves, roots and sap are shown on Figure 23. In leaves the only result that stands out is the high result obtained for control plants watered with 100% ammonium + 15 meq NaCl. The rest of the plats for leaves had very little differences between them. In roots, the results were more varied, but the only significant difference was between the control and water stressed plant watered with 100%ammonium + 30 meq NaCl. For sap, the higher results corresponded to the water stressed watered with 100% nitric, 100%nitric + 30 meq NaCl and 100% ammonium solutions.. 41.
(45) TFG | Alma Nebot Vaya. Figure 23. Zinc content in leaves, roots and sap for plants watered with different nutritive solutions. In each figure, blue bars stand for control and orange bars stand for drought conditions. Each bar has at least 3 independent determinations ± ES.. 4.5.16. Sap pH. The changes of sap pH between plants is shown on Figure 24. All the pH ere between 6,1 and 6,8 which shows that there were little differences between the sap’s pH of the controls, water stressed plants and the different thesis. Just to mention, the pH level of the control plants watered with the different nutritive containing NaCl is in most cases higher, except for the solution containing 50% nitric + 50% ammonium.. Figure 24. Sap pH at 25ºC for plants watered with different nutritive solutions. In the figure, blue bars stand for control and orange bars stand for drought conditions. Each bar has at least 3 independent determinations ± ES.. 4.5.17. Sap conductivity. Sap’s electric conductivity measured at 25ºC is shown in Figure 25. The values go from 600 to nearly 1000 µS. The values of water stressed plants is higher than for control plants, except the plants watered with 100% nitric, 50:50 +30 meq NaCl and 50:50 meq NaCl.. 42.
(46) TFG | Alma Nebot Vaya. Figure 25. Sap electric conductivity at 25ºC for plants watered with different nutritive solutions. In the figure, blue bars stand for control and orange bars stand for drought conditions. Each bar has at least 3 independent determinations ± ES.. Mineral analysis is key to plan out a correct fertilizing program. Traditionally the only minerals which were paid any attention were Nitrogen, Potassium and Phosphorus, but nowadays we know they are not the only ones important in the wellbeing of a crop. Sulphur for example is involved in the synthesis of essential amino acids cysteine and methionine. Magnesium is a central part of chlorophyll molecule, and Iron is directly involved in its synthesis. Manganese is necessary in the photosynthesis process and Boron is involved in cell wall formation, development of pollen tube, and metabolism and transport of sugars. Zinc helps in auxin synthesis and Copper influences in the metabolism of N and carbohydrates. And last but not least, Molybdenum is a key component of the nitrate-reductase and nitrogenase enzyme (HAIFA, 2016). It has been seen that plants subjected to nutrient starvation are more sensitive to high irradiance, salt stress or other environmental factors. As this state of mineral shortage seems to be common in natural environments, plants have developed during their evolution several mechanisms to cope with it. (Arbona and Gómez-Cadenas, 2012). This is why it’s very important to follow an adequate fertilizing program, as many of these elements are key to essential processes the plant needs to carry out to survive. Many of the stresses studied during the experiment are not fatal if the plant has a correct mineral balance, but if this is not done correctly, a slight change in just one of them or any other abiotic stress will end up with it.. 43.
(47) TFG | Alma Nebot Vaya. 5. Conclusions Although there is no clear absolute tendency in the results, in general, transpiration for plants treated with ammonium as its nitrogen source is higher than for the ones treated with nitric. This is clearly observed for the 2nd of May control plants treated with ammonium and for the 9th of May plants treated with ammonium + NaCl comparing them with their equivalents treated with nitric. A similar situation, although with no such significant differences, occurs with stomatal conductance, which makes sense from a physiological point of view. In any of the cases there is a decrease in any of the parameters due to the stress conditions tested, which may be due to the correct initial physiological conditions of the plants or that the stress conditions weren’t severe enough, and the physiological effects were delayed. In the tested conditions of the experiment, high salinity caused oxidative damage in plants, as the MDA results graphics show. It’s important to highlight that the water stress didn’t cause an increase in this oxidative damage or has any synergic effect. Furthermore, oxidative damage was only observed in leaves, not in roots. This also makes sense from a physiological point of view, as it’s in leaves where the photosynthetic process takes place. Messing up with the photosystem due to saline stress turns out to rapidly generate ROS and oxidative damage could appear. Proline results were not as expected, as in none of the organs studied (leaves and roots) proline accumulation takes place. It doesn’t respond to the different nitrogen sources, nor saline stress nor osmotic stress, which doesn’t follow the tendencies of previous works done by our group, were they obtained a peak in proline accumulation 7 days after salt treatment when watering the plants with 30 meq NaCl solutions. ABA concentration in leaves follows an erratic behavior, from which no conclusive results can be analyzed. Despite this, in roots an ABA accumulation is observed as a response to water stress in most of the thesis studied, which follows the tendency of previous works form our group. In these works, ABA accumulates as the oxidative damage in the plant increases, which may be caused by flooding, salt… The accumulation in roots is backed up by the levels of ABA found on sap, which follows a very similar pattern. So it seems that the plants just started to perceive these stress conditions, and the hormonal signals started to burst out. Weather the plants were watered with ammonium or nitric as the nitrogen source seems to have no effect what so ever in ABA concentrations in any of the organs studied. Neither salt stress has any effect in this hormone’s levels. The same pattern is followed by SA and JA, in which no conclusive results were obtained, but slight tendencies can be observed. In roots, SA accumulation is observed as a response to the combinations of salinity and water stress. This tendency is much more accused again in roots, but for JA. Both of these hormones are involved in the protection of the plant against different stresses, both biotic and abiotic. These tendencies are backed up by results obtained in previous studies from colleagues in our group, in which flooding stresses was studied, but the abiotic stress results were consistent with the results obtained in this experiment: stress caused transient increase in leaf JA concentration. The accumulation of all these different hormones seems to be linked with the plant’s ability to at least delay the oxidative damage. This is consistent with the results obtained, as in many cases, the oxidative indicators used to measure the oxidative stress were much lower than the ones described in previous reports.. 44.
(48) TFG | Alma Nebot Vaya. The results obtained in the nutritional analysis were varied and in many cases non conclusive. In most of the graphs no direct responses in leaves are observed, it’s in roots and sap where the clearest tendencies appear. In most of the cases there are no clear differences between the control and the water stressed plants. One of the most relevant results is sodium: in roots, the results obtained can be grouped according to their nitrogen source. Within these groups, in both control and water stressed plants, the percentage of sodium found increases as the content of NaCl in the nutritive solution increases. These results make sense and backs up all the other results. The same tendency repeats with the copper roots results. It’s also important to highlight that the different sources of Nitrogen used to build up the fertilizing solution seemed to have no effect on the different stresses, as no correlation appeared between them and salt or water stress. The results obtained in leaves for Total Nitrogen show in the majority of the cases higher content of N in control plants that in water stress plants, as control plants were the ones which obtained higher amounts of total nitrogen when watered with the fertilizing solution.. 45.
(49) TFG | Alma Nebot Vaya. 6. Bibliography Arbona, V., Flors, V., Jacas, J., García-Agustín, P., Gómez-Cadenas, A. (2003) Enzymatic and nonenzymatic antioxidant responses of Carrizo citrange, a salt-sensitive citrus rootstock, to different levels of salinity. Plant Cell Physiol. 44:388-394. Arbona, V., Gómez-Cadenas, A. (2012) Antioxidant system in citrus under nutrient stress conditions: latest developments. En: Advances in Citrus Nutrition, ed. A.K. Srivastava, pp. 13-. 24. Arbona, V., Hossain, Z., López-Climent, M.F., Pérez-Clemente, R.M., Gómez-Cadenas, A. (2008) Antioxidant enzymatic activity is linked to waterlogging stress tolerance in citrus. Physiol. Plant. 132:452-466 Arbona, V., Iglesias, D.J., Jacas, J., Primo-Millo, E., Talón, M., Gómez-Cadenas, A. (2005) Hydrogel substrate amendment alleviates drought effects on young citrus plants. Plant Soil, 270:73-82. Arbona, V., López-Climent, M.F., Pérez-Clemente, R.M., Gómez-Cadenas, A. (2009) Maintenance of a high photosynthetic performance is linked to flooding tolerance in citrus. Environ. Exp. Bot. 66:135-142. Argamasilla, R., Gómez-Cadenas, A., Arbona, V. (2013) Metabolic and regulatory responses in citrus rootstocks in response to adverse environmental conditions. J. Plant Growth Regul. DOI 10.1007/s00344-013-9359-z. Davies, F.S., Albrigo, L.G. (1994) Citrus. C. A. B. International, Great Britain. de Ollas, C., Hernando, B., Arbona, V., Gómez-Cadenas, A. (2013) Jasmonic acid transient accumulation is needed for abscisic acid increase in citrus roots under drought stress conditions. Physiol. Plant. 147:296-306. Di Rienzo, J.A., Casanoves, F., Balzarin,i M.G., González, L., Tablada, M., Robledo, C.W. (2012) InfoStat. Grupo InfoStat, FCA, Universidad Nacional de Córdoba, Argentina. URL http://www.infostat.com.ar Durgbanshi, A., Arbona, V., Pozo, O., Miersch, O., Sancho, J.V., Gómez-Cadenas, A. (2005) Simultaneous determination of multiple phytohormones in plant extracts by liquid chromatography-electrospray tandem mass spectometry. J. Agric. Food Chem. 53:8437-8442. Eyidogan, F., Oz, M.T., Yucel, M., Oktem, H.A. (2012) Signal transduction of phytohormones under abiotic stresses. En: Phytohormones and abiotic stress tolerance in plants, eds. N.A. Khan, R. Nazar, N. Iqbal, N.A. Anjum, Springer, Berlin, pp. 1-48. Fahad, S., Marloob, A., Khan, F.A., Khaliq, A., Hussain, S., Saud, S., Hassan, S., Shan, D., Khan, F., Ullah, N., Faiq, M., Khan, M.R., Tareen, A.K., Kahn, Ullah, A., Huang, J. (2015) Phytohormones and plant responses to salinity stress: a review. Plant Growth Regulation, 75(2): 391-404. García-Sánchez, F., Syvertsen, J.P., Gimeno, V., Botía, P., Pérez-Pérez, J.G. (2007) Responses to flooding and drought stress by two citrus rootstock seedlings with different water-use efficiency. Physiol. Plant. 130:532-542.. 46.
(50) TFG | Alma Nebot Vaya. Gómez-Cadenas, A., Vives, V., Zandalinas, S.I., Manzi, M., Sánchez-Pérez, A.M., Pérez-Clemente, R., Arbona, V., (2015) Abscisic Acid: A Versatile Phytohormones in Plant Signaling and Beyond. Current Protein and Peptide Science. 413-434. Gómez-Cadenas, A., Tadeo, F.R., Talón, M., Primo-Millo, E. (1996) Leaf abscission induced by ethylene in water-stressed intact seedlings of cleopatra mandarin requires previous abscisic acid accumulation in roots. Plant Physiol. 112:401-408. HAIFA GROUP, Nutritional recommendations for Citrus (2017).. IVACE, Cítricos de la Comunitat Valenciana (2015). Kranner, I., Minibayeva, F.V., Beckett, R.P., Seal, C.E. (2010) What is stress? Concepts, definitions and applications in seed science. New Phytologist. 188: 655-673. Lisar Seyed Y. S. Lisar, Rouhollah Motafakkerazad, Mosharraf M. Hossain and Ismail M. M. Rahman (2012). Water Stress in Plants: Causes, Effects and Responses, Water Stress. In: Introductory chapter, ed. by Prof. Ismail Md. Mofizur Rahman, pp. 1-15. MAGRAMA (2015) Ministerio de Agricultura, Alimentación y Medio Ambiente. Anuario de Estadística 2015. Molinari, H.B.C., Marur, C.J., Filho, J.C.B., Kobayashi, A.K., Pileggi, M., Júnior, R.P.L., Pereira, L.F.P., Vieira, L.G.E. (2004) Osmotic adjustment in transgenic citrus rootstock Carrizo citrange (Citrus sinensis Osb. x Poncirus trifoliata L. Raf.) overproducing proline. Plant Sci. 167:1375-1381. Muchate, N.S., Nikalje, G.C., Rajurkar, N.S., Suprasanna, P., Nikam, T.D. (2016) Plant Salt Stress: Adaptive Responses, Tolerance Mechanism and Bioengineering for Salt Tolerance. The Botanical Review, 82(4): 371-406. Rodríguez-Gamir, J., Primo-Millo, E., Forner, J.B., Forner-Giner, M.A. (2010) Citrus rootstock responses to water stress. Scientia Hortic. 126:95-102. Rodríguez, V.A., Martínez, G.C., Mazza, S.M., Piccoli, A.B., Ortiz, M.L. (2005) Efecto de una nueva formulación de fertilizante sobre la productividad de naranja Valencia late. UNNE: resumen A015. Vendruscolo, E.C.G., Schuster, I., Pileggi, M., Scapim, C.A., Molinari, H.B.C., Marur, C.J., Vieira, L.G.E. (2007) Stress-induced synthesis of proline confers tolerance to water deficit in transgenic wheat. Plant Physiol. 164:1367-1376. Wani, S.H., Kumar, V., Shriram, V., Kumar Sah, S. (2016) Phytohormones and their metabolic engineering for abiotic stress tolerance in crop plants. The Crop Journal: 4(3):162-176. Zhu, J.-K. (2007). Plant Salt Stress. Encyclopedia of Life Science, ed. Wiley Online Library.. 47.
(51)
Figure


+7


Documento similar
There was no significant difference in the content of inorganic nitrogen between L1 and L2 lots with manure application and both lots were significantly different
Olive leaf extracts have also been obtained through supercritical techniques using water, ethanol or a hydroalcoholic mixture (50:50) (v/v), but the greatest extract yield and
In this research, the environmental impact of different rates of wheat residues (no residues, 25, 50, 75, and 100%) in corn silage cultivation was evalu- ated using the life
The reaction mixture was diluted with AcOEt (50 mL) and washed with water (3 × 50 mL), dried (Na 2 SO 4 ) and concentrated in vacuo and the crude mixture was purificated by
If, in addition, the intensity of origin 7 is reduced 50% and it is shifted about 50 cm −1 in order to get much closer to the superposition of the second phonons of origins 5 and 6,
Water potential ( Ψ w ) and relative water content (RWC) of the flag leaves in well-watered (WW) and water-stressed (WS) plants of durum wheat (Triticum turgidum L. durum) grown
Total soluble sugars content in the leaves of Arbequina, Arbosana and Chetoui cultivars under Control (100%ETC) and PRD irrigation treatments (100% PRD, 75% PRD,50% PRD) during
In the present work, the supercritical fluid extraction of heather, marigold and the combined extraction of both plants (50:50 heather + marigold) was carried out, the concentration
