A New Multiresponse Optimization Approach in Combination With a D-Optimal Experimental Design for The Determination of Biogenic Amines in Fish by Hplc-Fld A. Herrero, S. Sanllorente, C. Reguera, M.C. Ortiz, L.A. Sarabia
PII: S0003-2670(16)31161-8 DOI: 10.1016/j.aca.2016.10.001 Reference: ACA 234820
To appear in: Analytica Chimica Acta
Received Date: 26 July 2016 Revised Date: 27 September 2016 Accepted Date: 2 October 2016
Please cite this article as: A. Herrero, S. Sanllorente, C. Reguera, M.C. Ortiz, L.A. Sarabia, A New Multiresponse Optimization Approach in Combination With a D-Optimal Experimental Design for The Determination of Biogenic Amines in Fish by Hplc-Fld, Analytica Chimica Acta (2016), doi: 10.1016/ j.aca.2016.10.001.
M
AN
US
CR
IP
T
AC
CE
PT
ED
A NEW MULTIRESPONSE OPTIMIZATION APPROACH IN COMBINATION WITH A D-OPTIMAL EXPERIMENTAL DESIGN FOR THE DETERMINATION
OF BIOGENIC AMINES IN FISH BY HPLC-FLD
A. Herrero1, S. Sanllorente1, C. Reguera1, M.C. Ortiz1,*, L.A. Sarabia2
1
Dept. of Chemistry, 2Dept. of Mathematics and Computation Faculty of Sciences, University of Burgos
Plaza Misael Bañuelos s/n, 09001 Burgos (Spain)
Abstract
A new strategy to approach multiresponse optimization in conjunction to a D-optimal design
for simultaneously optimizing a large number of experimental factors is proposed. The
procedure is applied to the determination of biogenic amines (histamine, putrescine,
cadaverine, tyramine, tryptamine, 2-phenylethylamine, spermine and spermidine) in
swordfish by HPLC-FLD after extraction with an acid and subsequent derivatization with
dansyl chloride. Firstly, the extraction from a solid matrix and the derivatization of the extract
are optimized. Ten experimental factors involved in both stages are studied, seven of them at
two levels and the remaining at three levels; the use of a D-optimal design leads to optimize
the ten experimental variables, significantly reducing by a factor of 67 the experimental effort
needed but guaranteeing the quality of the estimates. A model with 19 coefficients, which
includes those corresponding to the main effects and two possible interactions, is fitted to the
peak area of each amine. Then, the validated models are used to predict the response (peak
area) of the 3456 experiments of the complete factorial design. The variability among peak
areas ranges from 13.5 for 2-phenylethylamine to 122.5 for spermine, which shows, to a
certain extent, the high and different effect of the pretreatment on the responses. Then the
percentiles are calculated from the peak areas of each amine. As the experimental conditions
are in conflict, the optimal solution for the multiresponse optimization is chosen from among
those which have all the responses greater than a certain percentile for all the amines. The
developed procedure reaches decision limits down to 2.5 µg L-1 for cadaverine or 497 µg L-1
for histamine in solvent and 0.07 mg kg-1 and 14.81 mg kg-1 in fish (probability of false
positive equal to 0.05), respectively.
Keywords: Multiresponse optimization, D-optimal design, biogenic amines, HPLC-FLD,
derivatization, fish.
*
M
AN
US
CR
IP
T
AC
CE
PT
ED
1. Introduction
Usually, when developing an analytical procedure, several responses have to be
simultaneously optimized, and the optimum experimental conditions found for the different
analytical responses may be in conflict. In these cases, a decision needs to be made which
usually involves choosing a good alternative from several possibilities. In this context,
different methods have been established to carry out the simultaneous optimization of
multiple responses. For example, applications of the desirability method generalized by
Derringer and Suich [1] can be found in multianalyte chemical analysis [2–4] and, more
recently, of the Pareto optimal front approach [5,6].
These multiresponse methods are based on fitted mathematical models which relate responses
and experimental variables or factors. Although response surface or complete factorial
designs would be more suitable designs for estimating the coefficients of these models
(usually the variance inflation factors, VIFs, of the coefficients of the models are equal or
close to 1 in these cases), the number of experiments required to perform this type of designs
may be too large, depending on the number of experimental factors implied. Thus, to use
strategies to reduce the experimental effort, such as D-optimal design methodology, is almost
mandatory. D-optimal designs [7] make it possible the study of several experimental factors
with a reduced number of experiments and enable the adaptation of the design to each
analytical problem by independently setting the required levels for each factor as well as the
needed interactions. D-optimal designs have already been successfully used for solving this
kind of analytical issues [2,8,9].
In this work, a new strategy to approach multiresponse optimization is proposed. The
developed method is simpler and more affordable than others in literature since no complex
software algorithms are required once the models which relate experimental factors and
responses are fitted and suitably validated, and has provided reliable results when applied to
the optimization of the determination of biogenic amines (BAs) in swordfish (Xiphias
gladius) by HPLC-FLD.
BAs are nitrogen compounds of low molecular weight and biological activity coming
M
AN
US
CR
IP
T
AC
CE
PT
ED
if ingested over relatively high levels [11]. Histamine (HIS), putrescine (PUT), cadaverine
(CAD), tyramine (TYR), tryptamine (TRP), 2-phenylethylamine (PHE), spermine (SPM) and
spermidine (SPD) are considered to be the most important biogenic amines occurring in
foods; they have been found in cheese [12], wine [13], fish [14–17] or meat products [18,19],
among others. Their determination is really important in the case of fish and fish products not
only from the toxicological point of view but also because BAs are frequently related to the
quality of food as a sign of lack of freshness or inadequate hygienic storage conditions or
degradation of processed or fermented products [20]. Although many BAs have been found
in fish, only histamine has an established legal limit for the human consumption. EU [21] has
fixed maximum levels of histamine in fishery products from some particular fish species at
200 mg histamine kg-1 (400 mg histamine kg-1 in the case of fish sauce produced by
fermentation), whereas 50 mg histamine kg-1 is the maximum allowable histamine level
recommended by the Food and Drug Administration (FDA).
Several methods have been developed to determine BAs in foods [22,23], many of them
based on liquid chromatography [24] with various detection techniques, ultraviolet or
fluorescent detection being the most frequently used. Due to the lack of chromophores in
most of BAs, derivatization is absolutely essential for carrying out their detection in both
cases. Furthermore, previous separations are often necessary when complex matrices are
analyzed.
In this work, the quantitative determination of the mentioned eight BAs is carried out by
HPLC-FLD with a gradient elution program after extraction with an acid aqueous solution
and subsequent derivatization with dansyl chloride (Dns-Cl) since these amines do not exhibit
native fluorescence. In addition, the study of the matrix effect, avoided in many of the papers
found in literature, has been performed. The determination of BAs in this kind of matrices
requires stages previous to the analysis (derivatization, extraction, etc.), which usually
involve many experimental factors, and interactions among them can be expected, so their
optimization usually implies a considerable number of experiments. For that reason, the
multiresponse optimization strategy proposed here is performed in conjunction to a
D-optimal design for efficiently and simultaneously handling the large number of experimental
factors involved, significantly reducing the economic, time and environmental cost of the
M
AN
US
CR
IP
T
AC
CE
PT
ED
2. Experimental
2.1 Reagents
Hystamine dihydrochloride (CAS no. 56-92-8; 99% minimum purity), putrescine
dihydrochloride (CAS no. 333-93-7; 98% minimum purity), spermidine trihydrochloride
(CAS no. 334-50-9; 98% minimum purity), Dansyl chloride (CAS no. 605-65-2; 99%
minimum purity) were purchased from Sigma (Steinheim, Germany). Tyramine (CAS no.
51-67-2; 99% purity), tryptamine hydrochloride (CAS no. 343-94-2; 99% purity), cadaverine
(CAS no. 462-94-2; 95% purity), 2-phenylethylamine (CAS no. 64-04-0; 98% minimum
purity), 1,7-diaminoheptane (CAS no. 646-19-5; 98% purity), were supplied by Aldrich.
Spermine dehydrate (CAS no. 403982-64-9; 99.5% minimum purity) was obtained from
Fluka (Barcelona, Spain).
Acetonitrile (CAS no. 75-05-8; LiChrosolv isocratic grade for liquid chromatography) was supplied by Merck (Darmstadt, Germany). All other reagents used were of analytical grade.
Deionised water was obtained by using the Milli-Q gradient A10 water purification system
from Millipore (Bedford, MA, USA).
2.2 Standards and samples
Stock solutions of each biogenic amine and 1,7-diaminoheptane (IS, internal standard) were
individually prepared in 0.1 M hydrochloric acid at a concentration around 1000 mg L-1.
Standards were prepared in 0.4 M perchloric acid from the stock solutions. All these solutions
were stored at low temperature (4 ºC) and protected from light. The Dns-Cl solution was
prepared daily in acetone.
Fish samples were purchased from local food stores.
2.3 Instrumental
Analyses were carried out on an Agilent 1260 Infinity HPLC system (Agilent Technologies,
M
AN
US
CR
IP
T
AC
CE
PT
ED
autosampler (G1329B), a thermostatted column compartment (G1316A) and a fluorescence
detector (G1321B). A Kinetex® C18 100A (150 mm length × 4.6 mm i.d., 5.0 µm particle
diameter) analytical column (Phenomenex, Torrance, CA, USA) was used for the separation
of the derivatized amines. A Velp Scientifica RX3 Vortex shaker (Milan, Italy), a water bath
equipped with a Digiterm 200 immersion thermostat (JP Selecta S.A., Barcelona, Spain), and
a Sigma 2-16K refrigerated centrifuge (Osterode, Germany) were used.
2.4 Experimental procedure
Fish samples were homogenized using a commercial blender. 5 g of the sample were
transferred to a centrifuge tube and extracted with VExtr mL of Extractant with concentration
CExtr by vortex mixing for tvortex min, next the supernatant was centrifuged at a rotational
speed (scentr) for a time (tcentr) at 4ºC and filtered through Whatman No. 1 filter paper. The
residue was extracted again in equal conditions and both supernatants were combined and
made up to 25 mL with the extraction solution. Then 10 mL of the extract were neutralized
with 10 M sodium hydroxide followed by addition of 2 mL of 0.5 M
carbonate-hydrogencarbonate buffer (pH). 2 mL of Dns-Cl solution (%Dansyl, prepared in acetone)
were added to 1 mL of the buffered solution and the reaction mixture was left for tderiv min in
the darkness at Tderiv ºC for derivatization of amines.
The levels of the experimental variables involved in the optimization (in italics in the text
above) are in Table 1, and the details of the optimization procedure will be given in the
Results and discussion Section.
The procedure after optimization was as follows: each sample was extracted twice with 10
mL of 0.4 M perchloric acid by vortex mixing for 2 min, being the combined extracts
centrifuged at 5000 g for 10 min; whereas derivatization was performed on the buffered
extracts (pH=10.5) with 0.5% Dns-Cl for 30 min at 40 ºC.
Before the addition of 100 µL of 25% ammonium hydroxide to remove the surplus dansyl
chloride, the mixture was cooled to room temperature for 30 min in the darkness and made up
to 5 mL with acetonitrile, centrifuged at 3000 g for 5 min and the supernatant filtered through
M
AN
US
CR
IP
T
AC
CE
PT
ED
several months except in the case of SPM which may be stored in these conditions only for a
little over a month.
After derivatization, standards (buffered and derivatized as above) and extracts were injected
into the HPLC-FLD system. The extraction procedure gave a final solution representing 33
mg of the commodity per mL of extract. The injection volume was 10 µL. The mobile phases
were water (A) and acetonitrile (B). The gradient conditions were as follows: B was
increased from 40 to 70% over 12.5 min and held at 70% for 1.5 min, after which B was
increased to 100% over 2 min and then decreased to 40% over 4 min (20 min run time). The
flow rate was set to 1 mL min-1 and the column compartment to 40ºC. The excitation and
emission wavelengths of the fluorescence detector were set at 350 nm and 520 nm,
respectively.
2.5 Software
Experimental designs were built and analysed with NEMRODW [25]. MATLAB version
7.10 (The MathWorks) was used to perform the multiresponse optimization [26]. The least
squares regression models were fitted with STATGRAPHICS Centurion XVI [27] and the
least median of squares (LMS) regression models were fitted with PROGRESS [28].
Decision limit, CCα, and detection capability, CCβ, were determined using the DETARCHI
program [29].
3. Results and discussion
3.1 Optimization of the experimental procedure
3.1.1 Experimental design
On the basis of some methods found in bibliography [18,30,31] and previous experience, a
procedure of analysis was raised. Firstly, the simultaneous optimization of the extraction and
the derivatization stages was performed. The 10 experimental variables in Table 1, which
were involved in both stages, were included in the optimization analysis. Seven of the factors
M
AN
US
CR
IP
T
AC
CE
PT
ED
three factors (pH, Tderiv and tderiv) at 3 levels, and possible interactions between CExtr and VExtr
and between Tderiv and tderiv were also studied. The levels of these factors and their
codification are shown in Table 1.
A mathematical model with 19 coefficients, Eq. (1), which includes those corresponding to
the main effects and the two interactions was fitted for each amine.
ε
The binary variables xiA, for the factors at two levels i=1,…, 7, have the value of 1 when the
i-th factor is at level A and of -1 for level B. In the case of a 3-level factor (i=8, 9, 10), the
variables xiA and xiB have respectively the values 1 and 0 when the i-th factor is at level A, 0
and 1 when the factor is at level B and -1 and -1 when the factor is at level C.
Therefore, the interpretation of coefficients in Eq. (1) depends on the levels of all factors. For
example, only the term ' 1A 1A
β x is related to factor 1, which is at 2 levels A and B. Taking into account the sum of all other terms in Eq. (1), say K (corresponding to the fixed levels of the
remaining factors), the interpretation is as follows: when factor 1 is at level A, the response y
will be ' factors, at their corresponding fixed levels, when factor 8 is at level A, considering the values
M
AN
US
CR
IP
T
AC
CE
PT
ED
' 8A
β = −2.5 and ' 8B
β =2, the responses, when changing the factor levels, would be K−2.5, K+2
and K+0.5, which shows a quadratic effect. The interpretation of the coefficients of the
interaction terms are described in Table S1 of the supplementary material.
A complete factorial design would have required 3456 experiments, whereas the selected
D-optimal design has only 23. The quality of the estimates was guaranteed since the VIFs of the
coefficients of the model in this last case ranged from 1.2 to 2.1 (1.8 was the largest VIF of
the model coefficients for the complete factorial design), which means precise estimates of
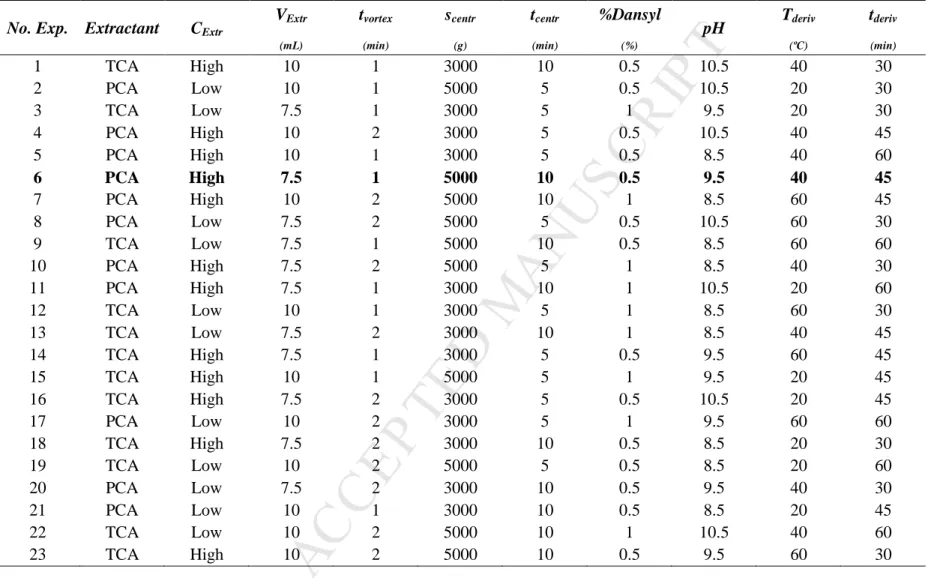
the coefficients. Table 2 shows the experimental plan (5 replicates of experiment 6 were also
conducted to validate the fit of the model).
Twenty-eight fish samples were fortified with 44.4 mg kg-1 of the BAs (444.4 mg kg-1 of HIS
since the analytical procedure is considerably less sensitive in this case) and 44.4 mg kg-1 of
IS. Next the samples were treated, following the experimental procedure described in Section
2.4, according to the experimental plan in Table 2 (in random order), and a chromatogram
was obtained for each experiment. Figure 1 shows the chromatogram obtained for one of the
replicates of experiment 6.
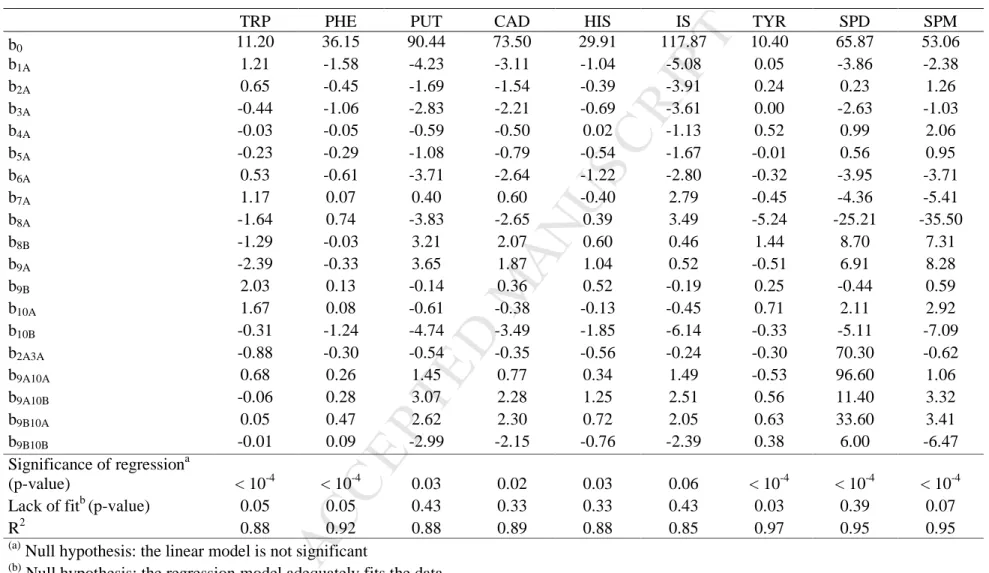
The peak areas of the chromatograms were used as response to fit a model for each amine.
Table 3 shows the coefficients and statistics of the models fitted. All the models were
significant at 0.05 significance level (except for IS, with a p-value equal to 0.06) and did not
have significant lack of fit at 95% confidence level (p-values > 0.05). Residuals were
randomly distributed and followed a normal distribution. Therefore, the models were valid
and suitably explained the variability of the responses (the nine peak areas) since the
coefficients of determination ranged from 0.85 to 0.97.
3.1.2 Multiresponse optimization
Once the models fitted were validated, they were used to estimate the responses, i.e. the peak
areas for each amine, of the 3456 experiments of the complete factorial design. This is a
different method of carrying out the optimization by considering not only the effect of factors
and possible interactions on the responses through the significant coefficients, which is the
M
AN
US
CR
IP
T
AC
CE
PT
ED
factors to the models through all the coefficients for the subsequent multiresponse
optimization.
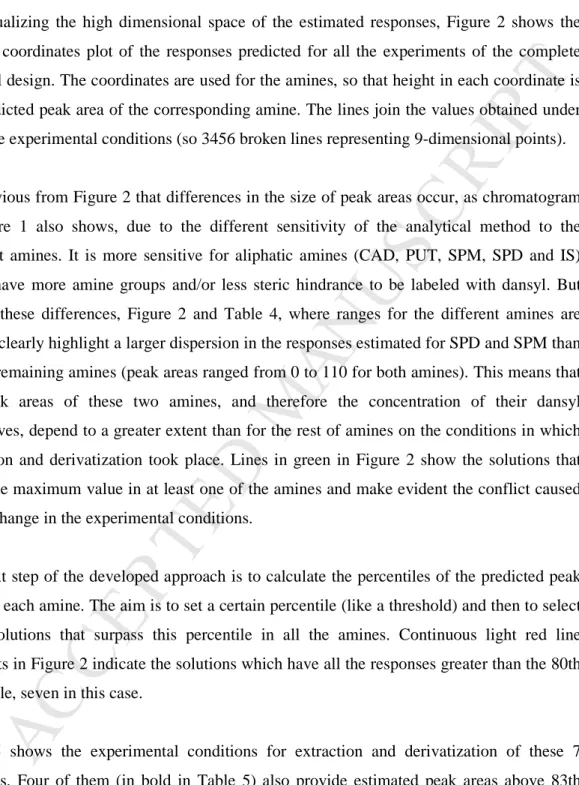
For visualizing the high dimensional space of the estimated responses, Figure 2 shows the
parallel coordinates plot of the responses predicted for all the experiments of the complete
factorial design. The coordinates are used for the amines, so that height in each coordinate is
the predicted peak area of the corresponding amine. The lines join the values obtained under
the same experimental conditions (so 3456 broken lines representing 9-dimensional points).
It is obvious from Figure 2 that differences in the size of peak areas occur, as chromatogram
in Figure 1 also shows, due to the different sensitivity of the analytical method to the
different amines. It is more sensitive for aliphatic amines (CAD, PUT, SPM, SPD and IS)
which have more amine groups and/or less steric hindrance to be labeled with dansyl. But
despite these differences, Figure 2 and Table 4, where ranges for the different amines are
shown, clearly highlight a larger dispersion in the responses estimated for SPD and SPM than
for the remaining amines (peak areas ranged from 0 to 110 for both amines). This means that
the peak areas of these two amines, and therefore the concentration of their dansyl
derivatives, depend to a greater extent than for the rest of amines on the conditions in which
extraction and derivatization took place. Lines in green in Figure 2 show the solutions that
reach the maximum value in at least one of the amines and make evident the conflict caused
by the change in the experimental conditions.
The next step of the developed approach is to calculate the percentiles of the predicted peak
areas of each amine. The aim is to set a certain percentile (like a threshold) and then to select
those solutions that surpass this percentile in all the amines. Continuous light red line
segments in Figure 2 indicate the solutions which have all the responses greater than the 80th
percentile, seven in this case.
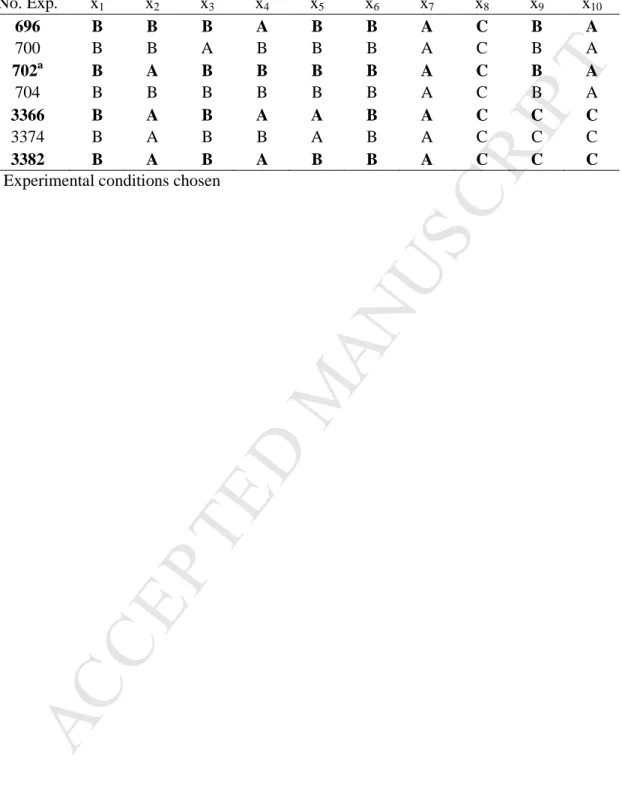
Table 5 shows the experimental conditions for extraction and derivatization of these 7
solutions. Four of them (in bold in Table 5) also provide estimated peak areas above 83th
percentile (no experimental conditions were found with larger percentiles for the 9 responses
simultaneously). As there were no distinct differences (in areas) between these last four
solutions (the highest light red line segments in Figure 2), the optimal solution was then
M
AN
US
CR
IP
T
AC
CE
PT
ED
derivatization (level A in x10). That is, the multiresponse optimization approach led to choose
experiment 702 in Table 5, which corresponds to the following conditions: x1 (Extractant) =
PCA, x2 (CExtr) = 0.4 M, x3 (VExtr) = 10 mL, x4 (tvortex) = 2 min, x5 (scentr) = 5000 g, x6 (tcentr) =
10 min, x7 (%Dansyl) = 0.5%, x8 (pH) = 10.5, x9 (Tderiv) = 40 ºC, and x10 (tderiv) = 30 min.
3.2 Performance criteria
3.2.1 Matrix effect and recovery
Two calibration lines were performed with standards and matrix-matched standards
(standards in blank matrix subjected to the entire treatment) to study the possible existence of
matrix effect and to calculate the recovery of the analytical procedure, relating standardized
areas and concentrations in the first case and increase of standardized area and added
concentrations in the second one. For both analysis, 15 solutions, with concentrations ranged
0 to 0.44 mg L-1 of PHE, PUT, CAD, SPD and SPM, from 0 to 1.77 mg L-1 of TRP and TYR,
from 0 to 17.73 mg L-1 of HIS, and 0.13 mg L-1 of IS, were prepared.
Robust regression models [28], based on the LMS regression, were previously fitted to detect
outliers (data with absolute value of standardized residual above 2.5). The least squares (LS)
models fitted once outliers were removed explained significantly at a 95% confidence level
the experimental responses (p-values < 0.05). The coefficients of correlation ranged from
0.98 to 1.00.
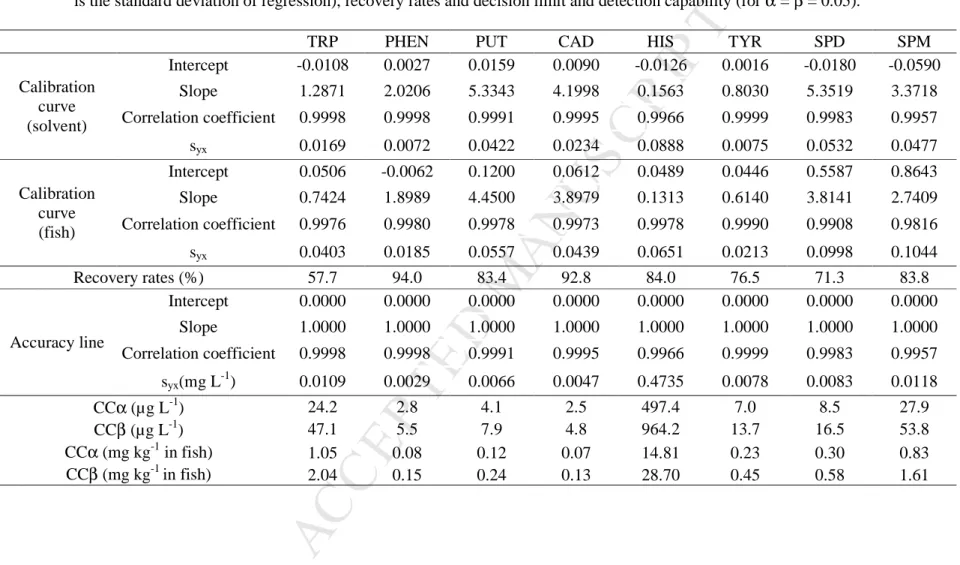
The slopes and the intercepts of the standard and matrix-matched calibration models were
statistically compared, Table 6 shows these results. Slopes were significantly different at a
95% confidence level for all the amines, clearly showing the matrix effect of the swordfish
components on the analytical responses. On the other hand, for, biogenic amines present in
the analysed swordfish samples, intercepts were also significantly different at the same
confidence level.
The recovery of the optimized procedure was calculated by properly comparing the slopes of
the fitted models. Since the slopes of the calibration lines obtained are exactly the same as
those that would have been obtained if the regression models “increase of standardized peak
M
AN
US
CR
IP
T
AC
CE
PT
ED
calculated as the ratio of the slopes of the calibration lines in matrix and in solvent [32].
Table 6 shows also the recovery rates found, that were over 70% in all the cases except for
TRP, for which a 58% of recovery rate was reached.
3.2.2 Accuracy
Trueness and precision were determined from the accuracy lines, i.e. regression models
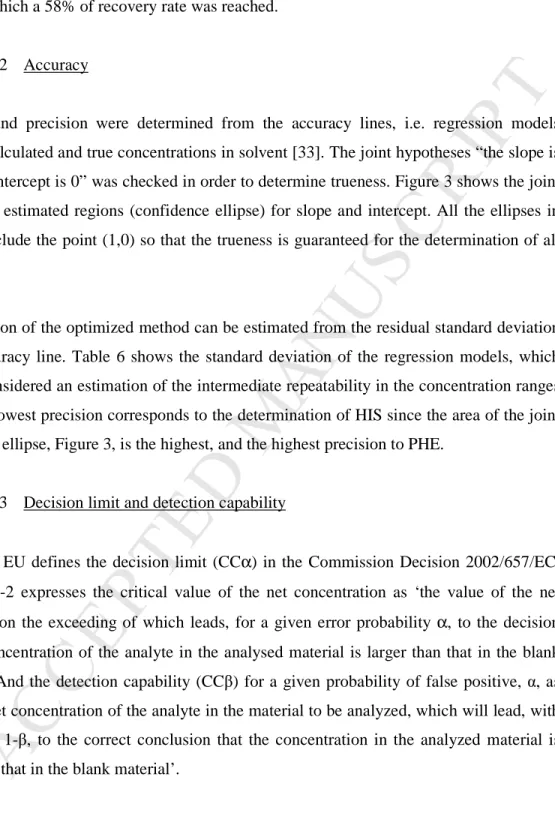
between calculated and true concentrations in solvent [33]. The joint hypotheses “the slope is
1 and the intercept is 0” was checked in order to determine trueness. Figure 3 shows the joint
confidence estimated regions (confidence ellipse) for slope and intercept. All the ellipses in
the plot include the point (1,0) so that the trueness is guaranteed for the determination of all
the BAs.
The precision of the optimized method can be estimated from the residual standard deviation
of the accuracy line. Table 6 shows the standard deviation of the regression models, which
may be considered an estimation of the intermediate repeatability in the concentration ranges
[34]. The lowest precision corresponds to the determination of HIS since the area of the joint
confidence ellipse, Figure 3, is the highest, and the highest precision to PHE.
3.2.3 Decision limit and detection capability
As well as EU defines the decision limit (CCα) in the Commission Decision 2002/657/EC, ISO 11483-2 expresses the critical value of the net concentration as ‘the value of the net
concentration the exceeding of which leads, for a given error probability α, to the decision
that the concentration of the analyte in the analysed material is larger than that in the blank
material’. And the detection capability (CCβ) for a given probability of false positive, α, as
‘the true net concentration of the analyte in the material to be analyzed, which will lead, with
probability 1-β, to the correct conclusion that the concentration in the analyzed material is
larger than that in the blank material’.
The decision limits and capabilities of detection of the optimized procedure were calculated
through the regression curves fitted with the first 9 standards in all the cases. The values
estimated are shown in the four last lines of Table 6 and are expressed both in concentration
M
AN
US
CR
IP
T
AC
CE
PT
ED
positive (α) and false negative (β) equal to 0.05, down to around 150 µg of CAD or PHE per kg of fish whereas, in the case of HIS, 28.7 mg kg-1 are reached. This means that the
procedure is less sensitive for HIS than for the rest of BAs analysed, as is has been pointed
out above. However, the detection capability found is far below the limit established by EU
[21] for HIS in some fresh fishery products, 200 mg kg-1 in fish.
3.3 Analysis of fish samples
The quantitative determination of the BAs under consideration was performed applying the
experimental procedure described in Section 2.4 to swordfish samples. All the analytical
procedure was carried out in sextuplicate, taking into account the standardized peak areas. In
the fish samples, no chromatographic peaks were obtained for TRP, PHE, HIS and TYR, but
the following contents for the rest of BAs were found: PUT, 0.27 ± 0.09 mg kg-1; CAD, 1.41
± 0.04 mg kg-1; SPD, 3.02 ± 0.17 mg kg-1; and SPM, 7.15 ± 0.93 mg kg-1 (semi-intervals
were calculated at 95% confidence level).
4. Conclusions
The use of the D-optimal design methodology has led to significantly reduce, by a factor of
67, the experimental effort required to optimize 10 experimental variables implied in two
steps of the analytical procedure.
The multiresponse optimization approach developed for optimizing simultaneously the 9
responses (peak areas) is very efficient and easier to perform over other methods. It has
enabled one to consider all contributions to the models, i.e. not only the significant
coefficients but the complete models.
The validated procedure has allowed to reach detection capabilities down to 70 µg L-1 for
CAD (which means 130 µg kg-1 in fish) and 14.8 mg L-1 for HIS (which means 28.7 mg kg-1
M
AN
US
CR
IP
T
AC
CE
PT
ED
5. Acknowledgements
The authors thank the financial support provided by the MINECO (CTQ2014-53157-R) and
FEDER funds.
6. References
[1] G.C. Derringer, R. Suich, Simultaneous Optimization of Several Response Variables,
J. Qual. Technol. 12 (1980) 214–219.
[2] A. Herrero, C. Reguera, M.C. Ortiz, L.A. Sarabia, Determination of dichlobenil and its
major metabolite (BAM) in onions by PTV-GC-MS using PARAFAC2 and
experimental design methodology, Chemom. Intell. Lab. Syst. 133 (2014) 92–108.
doi:10.1016/j.chemolab.2013.12.001.
[3] C. Reguera, M.C. Ortiz, A. Herrero, L.A. Sarabia, Optimization of a FIA system with
amperometric detection by means of a desirability function. Determination of
sulfadiazine, sulfamethazine and sulfamerazine in milk, Talanta. 75 (2008) 274–283.
doi:10.1016/j.talanta.2007.11.030.
[4] D. Arroyo, M.C. Ortiz, L.A. Sarabia, Multiresponse optimization and parallel factor
analysis, useful tools in the determination of estrogens by gas chromatography-mass
spectrometry, J. Chromatogr. A. 1157 (2007) 358–368.
doi:10.1016/j.chroma.2007.04.056.
[5] M.C. Ortiz, L.A. Sarabia, A. Herrero, M.S. Sánchez, Vectorial optimization as a
methodogical alternative to desirability function, Chemom. Intell. Lab. Syst. 83 (2006)
157–168. doi:10.1016/j.chemolab.2005.11.005.
[6] C. Reguera, M.S. Sánchez, M.C. Ortiz, L.A. Sarabia, Pareto-optimal front as a tool to
study the behaviour of experimental factors in multi-response analytical procedures,
Anal. Chim. Acta. 624 (2008) 210–222. doi:10.1016/j.aca.2008.07.006.
[7] R. Phan-Tan-Luu, M. Sergent, Nonclassical Experimental Designs, in: S.D. Brown, R.
Tauler, B. Walczak (Eds.), Compr. Chemom. Chem. Biochem. Data Anal., Elsevier,
2009: pp. 453–499.
M
AN
US
CR
IP
T
AC
CE
PT
ED
parallel factor analysis 2 decomposition a useful tool in the determination of triazines
in oranges by programmed temperature vaporization-gas chromatography-mass
spectrometry when using dispersive-solid phase ex, J. Chromatogr. A. 1288 (2013)
111–126. doi:10.1016/j.chroma.2013.02.088.
[9] L. Rubio, M.L. Oca, L. Sarabia, I. García, M.C. Ortiz, Desirability functions as
response in a d-optimal design for evaluating the extraction and purification steps of
six tranquillizers and an anti-adrenergic by liquid chromatography-tandem mass
spectrometry, J. Chemom. 30 (2016) 58–69. doi:10.1002/cem.2767.
[10] A. Halász, Á. Baráth, L. Simon-Sarkadi, W. Holzapfel, Biogenic amines and their
production by microrganisms in food, Trends Food Sci. Technol. 5 (1994) 42–49.
[11] V. Ladero, M. Calles-Enriquez, M. Fernandez, M. A. Alvarez, Toxicological Effects of
Dietary Biogenic Amines, Curr. Nutr. Food Sci. 6 (2010) 145–156.
doi:10.2174/157340110791233256.
[12] N. Innocente, M. Biasutti, M. Padovese, S. Moret, Determination of biogenic amines
in cheese using HPLC technique and direct derivatization of acid extract, Food Chem.
101 (2007) 1285–1289. doi:10.1016/j.foodchem.2005.12.026.
[13] Y.-Y. Guo, Y.-P. Yang, Q. Peng, Y. Han, Biogenic amines in wine: a review, Int. J.
Food Sci. Technol. 50 (2015) 1523–1532. doi:10.1111/ijfs.12833.
[14] L. Prester, Biogenic amines in fish, fish products and shellfish: a review, Food Addit.
Contam. Part A. 28 (2011) 1547–1560. doi:10.1080/19440049.2011.600728.
[15] G. Sagratini, M. Fernández-Franzón, F. De Berardinis, G. Font, S. Vittori, J. Mañes,
Simultaneous determination of eight underivatised biogenic amines in fish by solid
phase extraction and liquid chromatography-tandem mass spectrometry., Food Chem.
132 (2012) 537–43. doi:10.1016/j.foodchem.2011.10.054.
[16] H. Zhai, X. Yang, L. Li, G. Xia, J. Cen, H. Huang, S. Hao, Biogenic amines in
commercial fish and fish products sold in southern China, Food Control. 25 (2012)
303–308. doi:10.1016/j.foodcont.2011.10.057.
[17] S. Tahmouzi, R. Khaksar, M. Ghasemlou, Development and validation of an
HPLC-FLD method for rapid determination of histamine in skipjack tuna fish (Katsuwonus
pelamis), Food Chem. 126 (2011) 756–761. doi:10.1016/j.foodchem.2010.11.060.
M
AN
US
CR
IP
T
AC
CE
PT
ED
using ultra-performance liquid chromatography (UPLC), Food Chem. 116 (2009) 365–
370. doi:10.1016/j.foodchem.2009.02.018.
[19] C. Ruiz-Capillas, F. Jiménez-Colmenero, Biogenic Amines in Meat and Meat
Products, Crit. Rev. Food Sci. Nutr. 44 (2005) 489–599.
doi:10.1080/10408690490489341.
[20] Joint FAO/WHO Expert Meeting on the Public Health Risks of Histamine and other
Biogenic Amines from Fish and Fishery Products, FAO/WHO, Rome, 2013.
http://www.fao.org/publications/card/en/c/adad2929-d35f-5754-8c15-c8956418fe19/
(Last visit: July 2016).
[21] Commission Regulation (EU) No 1019/2013of 23 October 2013 amending Annex I to
Regulation (EC) No 2073/2005 as regards histamine in fishery products, Off. J. Eur.
Commun. L282 (2013) 46–47.
[22] F. Bedia Erim, Recent analytical approaches to the analysis of biogenic amines in food
samples, TrAC Trends Anal. Chem. 52 (2013) 239–247.
doi:10.1016/j.trac.2013.05.018.
[23] A. Önal, A review: Current analytical methods for the determination of biogenic
amines in foods, Food Chem. 103 (2007) 1475–1486.
doi:10.1016/j.foodchem.2006.08.028.
[24] A. Önal, S.E.K. Tekkeli, C. Önal, A review of the liquid chromatographic methods for
the determination of biogenic amines in foods., Food Chem. 138 (2013) 509–15.
doi:10.1016/j.foodchem.2012.10.056.
[25] D. Mathieu, J. Nony, R. Phan-Tan-Luu, NemrodW (Versión 2007_03), L.P.R.A.I.,
Marseille, France, (2007).
[26] MATLAB version 7.12.0.635 (R2011a), The Mathworks, Inc., Natick, MA, USA,
2011.
[27] STATGRAPHICS Centurion XVI Version 16.1.05 (32bit), Statpoint Technologies,
Inc., Herndon, VA, USA, 2010.
[28] P.J. Rousseeuw, A.M. Leroy, Robust regression and outliers detection, John Wiley and
Sons, New Jersey, 2001.
M
AN
US
CR
IP
T
AC
CE
PT
ED
assurance probabilities and characteristic curves of detection, TrAC Trends Anal.
Chem. 13 (1994) 1–6.
[30] J. Mah, H. Han, Y. Oh, M. Kim, Biogenic amines in Jeotkals , Korean salted and
fermented fish products, Food Chem. 79 (2002) 239–243.
[31] H. Zhai, X. Yang, L. Li, G. Xia, J. Cen, H. Huang, S. Hao, Biogenic amines in
commercial fish and fish products sold in southern China, Food Control. 25 (2012)
303–308. doi:10.1016/j.foodcont.2011.10.057.
[32] P.C. Meier, R.E. Zünd, Statistical methods in analytical chemistry, 2nd edition, John
Wiley and Sons, New York, 2000, pp. 120-142.
[33] M.C. Ortiz, M.S. Sánchez, L.A. Sarabia, Quality of Analytical Measurements:
Univariate Regression, in: S.D. Brown, R. Tauler, B. Walczak (Eds.), Compr.
Chemom., 2010: pp. 127–169. doi:10.1016/B978-044452701-1.00091-0.
[34] M.B. Sanz, L.A. Sarabia, A. Herrero, M.C. Ortiz, A study of robustness with
multivariate calibration. Application to the polarographic determination of
M
AN
US
CR
IP
T
AC
CE
PT
ED
FIGURE CAPTIONS
Figure 1 Chromatogram of experiment 6 in Table 2. In the extract injected, the procedure
gives a final added concentration of 14.8 mg L-1 of HIS, 1.5 mg L-1 of the rest of
BAs, and 1.5 mg L-1 of IS.
Figure 2 Parallel coordinates plot of the solutions predicted for each amine for the 3456
experiments of the complete factorial design. The 7 solutions which have all the
responses greater than the 80th percentile are in light red, solutions which reach
the maximum in at least one of the amines; and the rest of solutions are in dark
blue.
Figure 3 (a) Joint confidence ellipses, at a 95% significance level, for slope and intercept of
the accuracy lines. (b) Enlarged view. HIS: black long dash-double dot line, PUT:
red long dash line, CAD: yellow long dot line, TYR: magenta medium
dash-dot line, TRP: blue short dash line, PHE: cyan solid line, SPM: green dash-dotted line
M
AN
US
CR
IP
T
AC
CE
PT
ED
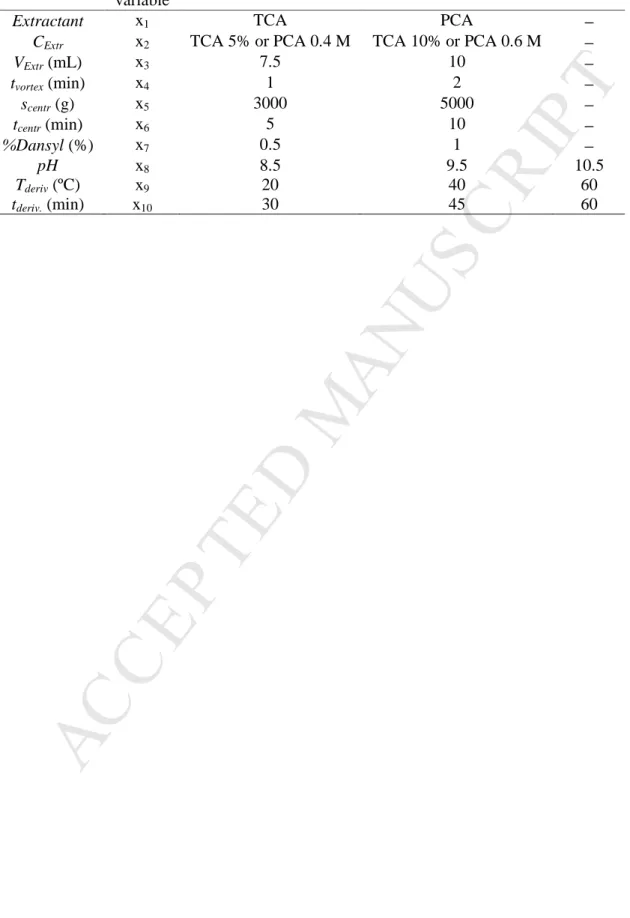
Table 1 Factors, codified variables and experimental domain of interest for optimization.
Factors Codified
variable Level A Level B Level C
Extractant x1 TCA PCA −
CExtr x2 TCA 5% or PCA 0.4 M TCA 10% or PCA 0.6 M −
VExtr (mL) x3 7.5 10 −
tvortex (min) x4 1 2 −
scentr (g) x5 3000 5000 −
tcentr (min) x6 5 10 −
%Dansyl (%) x7 0.5 1 −
pH x8 8.5 9.5 10.5
Tderiv (ºC) x9 20 40 60
M
AN
US
CR
IP
T
AC
CE
PT
ED
19/23
Table 2 Experimental plan of the D-optimal design (5 replicates of experiment 6, in bold, has also been performed).
No. Exp. Extractant CExtr
VExtr tvortex scentr tcentr %Dansyl
pH Tderiv tderiv
(mL) (min) (g) (min) (%) (ºC) (min)
1 TCA High 10 1 3000 10 0.5 10.5 40 30
2 PCA Low 10 1 5000 5 0.5 10.5 20 30
3 TCA Low 7.5 1 3000 5 1 9.5 20 30
4 PCA High 10 2 3000 5 0.5 10.5 40 45
5 PCA High 10 1 3000 5 0.5 8.5 40 60
6 PCA High 7.5 1 5000 10 0.5 9.5 40 45
7 PCA High 10 2 5000 10 1 8.5 60 45
8 PCA Low 7.5 2 5000 5 0.5 10.5 60 30
9 TCA Low 7.5 1 5000 10 0.5 8.5 60 60
10 PCA High 7.5 2 5000 5 1 8.5 40 30
11 PCA High 7.5 1 3000 10 1 10.5 20 60
12 TCA Low 10 1 3000 5 1 8.5 60 30
13 TCA Low 7.5 2 3000 10 1 8.5 40 45
14 TCA High 7.5 1 3000 5 0.5 9.5 60 45
15 TCA High 10 1 5000 5 1 9.5 20 45
16 TCA High 7.5 2 3000 5 0.5 10.5 20 45
17 PCA Low 10 2 3000 5 1 9.5 60 60
18 TCA High 7.5 2 3000 10 0.5 8.5 20 30
19 TCA Low 10 2 5000 5 0.5 8.5 20 60
20 PCA Low 7.5 2 3000 10 0.5 9.5 40 30
21 PCA Low 10 1 3000 10 0.5 8.5 20 45
22 TCA Low 10 2 5000 10 1 10.5 40 60
M
AN
US
CR
IP
T
AC
CE
PT
ED
20/23
Table 3 Parameters and statistics of the D-optimal models fitted for each BA: coefficients of the models (coefficients b0 to b9B10B), coefficient
of determination (R2), and p-values of the significance of the regression and lack of fit.
TRP PHE PUT CAD HIS IS TYR SPD SPM
b0 11.20 36.15 90.44 73.50 29.91 117.87 10.40 65.87 53.06
b1A 1.21 -1.58 -4.23 -3.11 -1.04 -5.08 0.05 -3.86 -2.38
b2A 0.65 -0.45 -1.69 -1.54 -0.39 -3.91 0.24 0.23 1.26
b3A -0.44 -1.06 -2.83 -2.21 -0.69 -3.61 0.00 -2.63 -1.03
b4A -0.03 -0.05 -0.59 -0.50 0.02 -1.13 0.52 0.99 2.06
b5A -0.23 -0.29 -1.08 -0.79 -0.54 -1.67 -0.01 0.56 0.95
b6A 0.53 -0.61 -3.71 -2.64 -1.22 -2.80 -0.32 -3.95 -3.71
b7A 1.17 0.07 0.40 0.60 -0.40 2.79 -0.45 -4.36 -5.41
b8A -1.64 0.74 -3.83 -2.65 0.39 3.49 -5.24 -25.21 -35.50
b8B -1.29 -0.03 3.21 2.07 0.60 0.46 1.44 8.70 7.31
b9A -2.39 -0.33 3.65 1.87 1.04 0.52 -0.51 6.91 8.28
b9B 2.03 0.13 -0.14 0.36 0.52 -0.19 0.25 -0.44 0.59
b10A 1.67 0.08 -0.61 -0.38 -0.13 -0.45 0.71 2.11 2.92
b10B -0.31 -1.24 -4.74 -3.49 -1.85 -6.14 -0.33 -5.11 -7.09
b2A3A -0.88 -0.30 -0.54 -0.35 -0.56 -0.24 -0.30 70.30 -0.62
b9A10A 0.68 0.26 1.45 0.77 0.34 1.49 -0.53 96.60 1.06
b9A10B -0.06 0.28 3.07 2.28 1.25 2.51 0.56 11.40 3.32
b9B10A 0.05 0.47 2.62 2.30 0.72 2.05 0.63 33.60 3.41
b9B10B -0.01 0.09 -2.99 -2.15 -0.76 -2.39 0.38 6.00 -6.47
Significance of regressiona
(p-value) < 10-4 < 10-4 0.03 0.02 0.03 0.06 < 10-4 < 10-4 < 10-4 Lack of fitb (p-value) 0.05 0.05 0.43 0.33 0.33 0.43 0.03 0.39 0.07 R2 0.88 0.92 0.88 0.89 0.88 0.85 0.97 0.95 0.95
(a)
Null hypothesis: the linear model is not significant
(b)
M
AN
US
CR
IP
T
AC
CE
PT
ED
Table 4 Ranks, maximum and minimum values of the peak areas estimated for the 3456 experiments of the experimental design.
TRP PHE PUT CAD HIS IS TYR SPD SPM
rank 22.08 13.52 50.41 38.18 16.96 68.04 15.53 97.42 122.50
max 23.01 43.15 113.64 91.44 37.14 152.01 17.67 108.53 110.92
M
AN
US
CR
IP
T
AC
CE
PT
ED
Table 5 Experiments of the complete factorial design and experimental conditions of the solutions which have all the responses greater than the 80th percentile. Solutions which have all responses greater than the 83th percentile are in bold.
No. Exp. x1 x2 x3 x4 x5 x6 x7 x8 x9 x10
696 B B B A B B A C B A
700 B B A B B B A C B A
702a B A B B B B A C B A
704 B B B B B B A C B A
3366 B A B A A B A C C C
3374 B A B B A B A C C C
3382 B A B A B B A C C C
M
AN
US
CR
IP
T
AC
CE
PT
ED
23/23
Table 6 Performance criteria of the analytical method optimized: parameters of calibration curves in solvent and fish and of accuracy line (syx
is the standard deviation of regression), recovery rates and decision limit and detection capability (for α = β = 0.05).
TRP PHEN PUT CAD HIS TYR SPD SPM
Calibration curve (solvent)
Intercept -0.0108 0.0027 0.0159 0.0090 -0.0126 0.0016 -0.0180 -0.0590
Slope 1.2871 2.0206 5.3343 4.1998 0.1563 0.8030 5.3519 3.3718
Correlation coefficient 0.9998 0.9998 0.9991 0.9995 0.9966 0.9999 0.9983 0.9957
syx 0.0169 0.0072 0.0422 0.0234 0.0888 0.0075 0.0532 0.0477
Calibration curve (fish)
Intercept 0.0506 -0.0062 0.1200 0.0612 0.0489 0.0446 0.5587 0.8643
Slope 0.7424 1.8989 4.4500 3.8979 0.1313 0.6140 3.8141 2.7409
Correlation coefficient 0.9976 0.9980 0.9978 0.9973 0.9978 0.9990 0.9908 0.9816
syx 0.0403 0.0185 0.0557 0.0439 0.0651 0.0213 0.0998 0.1044
Recovery rates (%) 57.7 94.0 83.4 92.8 84.0 76.5 71.3 83.8
Accuracy line
Intercept 0.0000 0.0000 0.0000 0.0000 0.0000 0.0000 0.0000 0.0000
Slope 1.0000 1.0000 1.0000 1.0000 1.0000 1.0000 1.0000 1.0000
Correlation coefficient 0.9998 0.9998 0.9991 0.9995 0.9966 0.9999 0.9983 0.9957
syx(mg L-1) 0.0109 0.0029 0.0066 0.0047 0.4735 0.0078 0.0083 0.0118