Accepted Manuscript
Performance of grid-tied PV facilities based on real data in Spain: central in-verter versus string system
M. Díez-Mediavilla, M. Isabel Dieste-Velasco, M.C. Rodríguez-Amigo, T. García-Calderón, C. Alonso-Tristán Calderón, C. Alonso-Tristán, Performance of grid-tied PV facilities based on real data in Spain: central inverter versus string system, Energy Conversion and Management (2014), doi: http://dx.doi.org/10.1016/j.enconman. 2014.06.087
Performance of grid-tied PV facilities based on real data in Spain:
central inverter versus string system
M. Díez-Mediavilla(1), M. Isabel Dieste-Velasco(1), M. C. Rodríguez-Amigo(1), T. García-Calderón(1), C. Alonso-Tristán(1,*)
(1)
Research Group SWIFT (Solar and Wind Feasibility Technologies). Universidad de Burgos. Escuela
Politécnica Superior. Avda Cantabria s/n. 09006 Burgos. Spain.
*Corresponding author: [email protected] Phone/fax number: +34 947 258925/+34 947 258910.
Abstract
Two complete years of operation of two grid-tied PV facilities is presented. Energetic and economic performance of both installations has been compared. Located in the same place, the installation of these facilities followed the same construction criteria -PV panels, panel support system and wiring- and the facilities are exposed to the same atmospheric temperature and solar radiation. They differ with regard to their inverter topology used: one facility uses a central inverter and the other a string inverter configuration. The performance of the facilities has been determined using a procedure based on a small number of easily obtained parameters and the knowledge of the analyzed system and its operation mode. Electrical losses have been calculated for both systems and a complete comparison between them has been carried out. The results have shown better performance for distributed system in economic and energetic terms.
1. Introduction
Research of alternatives energetic resources is mandatory for the foreseeable shortage to
fossil fuels and problems associated to atmospheric pollution and greenhouse effects
[1]. While there are different alternatives for the generation of renewable energy,
photovoltaic (PV) electricity will play a key role in Europe’s electricity mix given its
world, 29% corresponding to Europe. Actually, PV covers 3% of the electricity demand
and 6% of the peak electricity demand in Europe [5].
Royal Decree 1578/2008 [6] favoured Spain to experience greater boom of European
countries with regard to the installation of PV energy during the year 2008 [7].
However, in later years the number of new facilities was progressively diminishing and
Italy and Germany took over in terms of installed PV power. In 2011 Spain was the
third European country whit 4.4 GW installed PV power, after Italy, with 9284 GW,
and Germany with 24678 GW [4] PV markets in Europe and around the world
continued making rapid progress in 2012 toward competitiveness in the electricity
sector.
The strong price decreases of PV technology, and increased electricity prices in
general, have helped drive momentum toward what is often called “grid parity”. In most
countries, PV market deployment still depends on the political framework in place [8, 9]
As shown by the substantial regulatory changes introduced by policymakers in several
progressively vanishing [10] with a reduction greater than 64% in 2013 over the previous
year [5].
In this uncertain scenario, it is mandatory to analyze the functioning of existing systems
for the most profitable energy production and determine the most favourable conditions
that lead to more efficient production. Effects of environmental, external conditions or
its inherent to various technologies of solar panels, as well as the installation itself,
among others, can affect the optimal operation of the plant [11].
Data from owners or maintenance services are very scarce and real PV systems are not
usually monitored [12]. Measurement systems at most facilities only record total
production, which is necessary for invoicing the energy that is produced. In some cases,
data are recorded in the inverter system after the conversion stage. Poor knowledge of
technical and constructive features and their operational quality affects the visibility and
image of renewable energy and hinders the optimization and predictive maintenance of
PV plants that are already up and running. Therefore it is useful to having data taken
over long periods of time. However, this is not easy to obtain being rare published
works that collect data from real facilities.
In this way, our research group has initiated a collaborative project between some
installation and maintenance companies that provides the real data and the constructive
details of some real grid-tied PV facilities and some results have been already published
[8, 12-15]. Factors associated to PV panels quality [12] or the use of transformerless
the research group based on a small number of easily obtained parameters and the
knowledge of the analyzed system and its operation mode.
As new application of the same procedure, in the present work a comparison between
two PV grid connected systems relative to its operation way as well as production and
generation costs is made. The facilities are located in the same geographical area and
have two different topologies concerning their layout. The first of them uses a central
inverter. The second facility has string inverter configuration. In both cases
transformerless inverter has been used. The objective is to analyze the influence of the
main factors that affect the efficiency of both facilities, the layout system, taking into
account operation data collected over long periods of time.
2. PV system topologies
Today, PV industry has experienced rapid growth as a result of the improvement in the
electronic technologies that enable, among other things; develop different topologies of
inverters increasingly more efficient and reliable. In regards to the configuration of the
inverters, currently, the European market is dominated by transformerless inverters,
which are reached very high efficiencies, around 97-98% [16].
There are different topologies for PV arrays that have a great influence on the energy
production. The choice of one or another form to connect the PV panels among
themselves and to the inverter system will be a determining factor on aspects such as the
use of solar radiation, the shading influence or the mismatch losses [17]. Most used PV
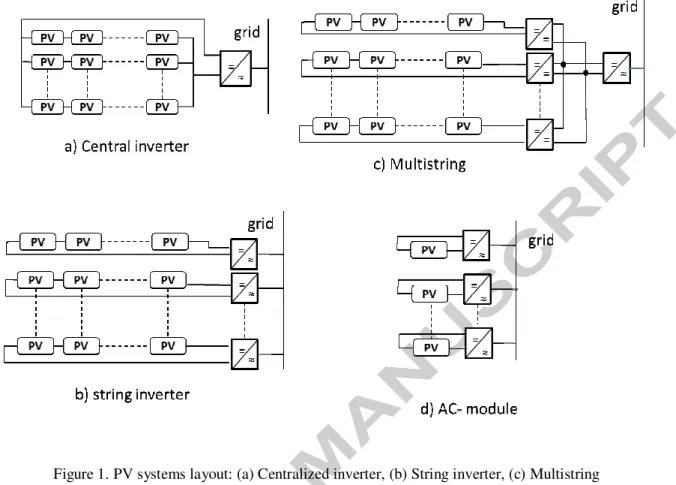
architectures could be grouped basically in the following four configurations:
architectures have been suggested on an experimental basis, but its efficiency has not
been proved in real grid tied facilities[19]. Medium and large sized facilities, commonly
used central inverter configuration although distributed systems have some important
advantages related to a better fit to the optimum point of operation (MPPT) of the
inverter and the maintenance of the system [20].
Figure 1 shows main topologies used for PV system layout. In a centralized system
(Figure 1-a) some PV panels are connected in serial to form a string. The string are
connected in parallel to a single inverter system[21] The most notable of this type of
connection advantages are low cost per installed power and its simplicity[22] As
disadvantage, it should be noted the obligation of working with a single MPPT
(Maximum Power Point Tracking) for all arrays which leads to a lower yield to changes
in radiation, the temperature or shading conditions[23] and lower performance of the
facility[24]. This type of configuration based on centralized inverters can use different
types of inverters, being the most used in Europe the based on transformessless
inverters, with a near 80% market share [3].
Configuration using the string inverters (Figure 1-b), these are not connected together in
parallel. Each string attaches to its own inverter and therefore will have its own MPPT.
In this way the strings work independently one from the other mismatching and partial
shading losses [25]. This layout allows the use of strings with different number of
modules or even the use of different types of modules. In addition, in the event that a
inverter fault, this configuration, ensures the continuity of the service. Disadvantage is
The multi-string inverter (Figure 1-c) use a DC-DC converter with its own MPPT for
each string and, finally, the entire system is connected to a single DC-AC converter.
This system combines the advantages of the mentioned above[25] but the two stages of
conversion can reduce its efficiency [21]. The AC-module or MIC (Module Integrated
Converter), shown in Figure 1 (d), integrates the PV-module directly to the inverter,
minimizing mismatch losses. Used for low-power systems its maintenance is complex
[25] and in addition, the life service of the installation worsens [21].
Figure 1.
3. Description of the facilities
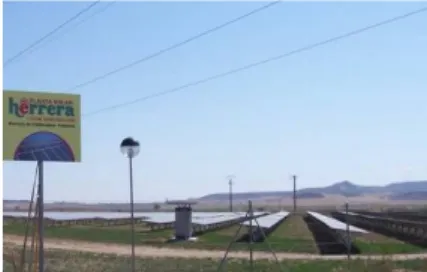
The case study involves two real grid-tied PV installations (System 1 and System 2)
located at the centre of the Spanish autonomous region of Castilla y León, at Herrera de
Valdecañas (Palencia). Geographical coordinates are 41º 59’ N latitude and 4º 24’W
longitude, and 720 m altitude above sea level. The facilities are located in neighbouring
plots. They stand on a gentle, south-facing slope that is conducive to natural air
circulation, one of the most beneficial aspects for improving the panels’ electrical
production in summer time. Hence, the two facilities are subject to very similar
environmental conditions, in terms of temperature, radiation, humidity, and wind speed.
The area benefits from very favourable atmospheric conditions. Solar irradiation is
estimated at approximately 1,450 Kwh/m2year [26] The ambient temperature range is
between 4ºC and 20ºC and the number of cloudy days is very low [27] Figures 2 and 3
Figure 2
Figure 3
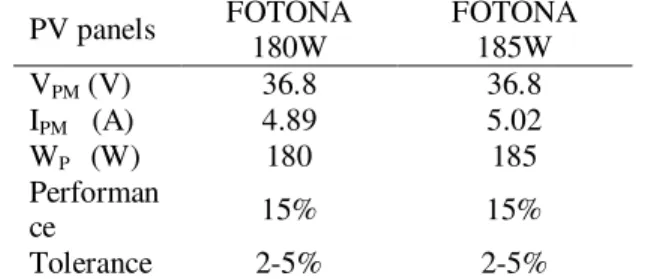
Facilities layout is structured in PV arrays composed by fourteen PV panels serial
connected. The PV panels at both facilities are FOTONA model 185D in System 1 and
model 180D [28] and 185D for System 2. Their technical specifications are presented in
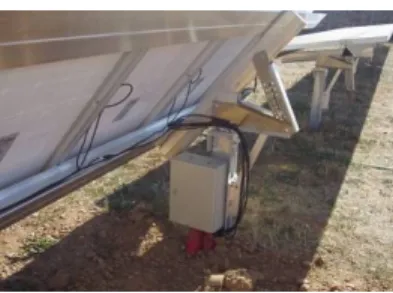
Table 1. A mobile structure adjusts the position of the panels according to the time of
year, in order to optimize electrical production. Its design also helps to minimize the
visual impact of the facilities. The maximum height of the panels (1.80 m) usually
occurs during winter time and they can be lowered at other times of the year, using a
manual system that can vary their angle of inclination by between 5º and 50°. This
adjustment is performed every 26 days or so. Figure 4 presents the panel support system
and Figure 5, its highest and lowest positions. This panel support system is a standard
fitting in all facilities run by the same company [8, 12, 15].
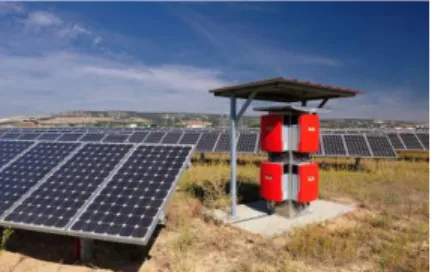
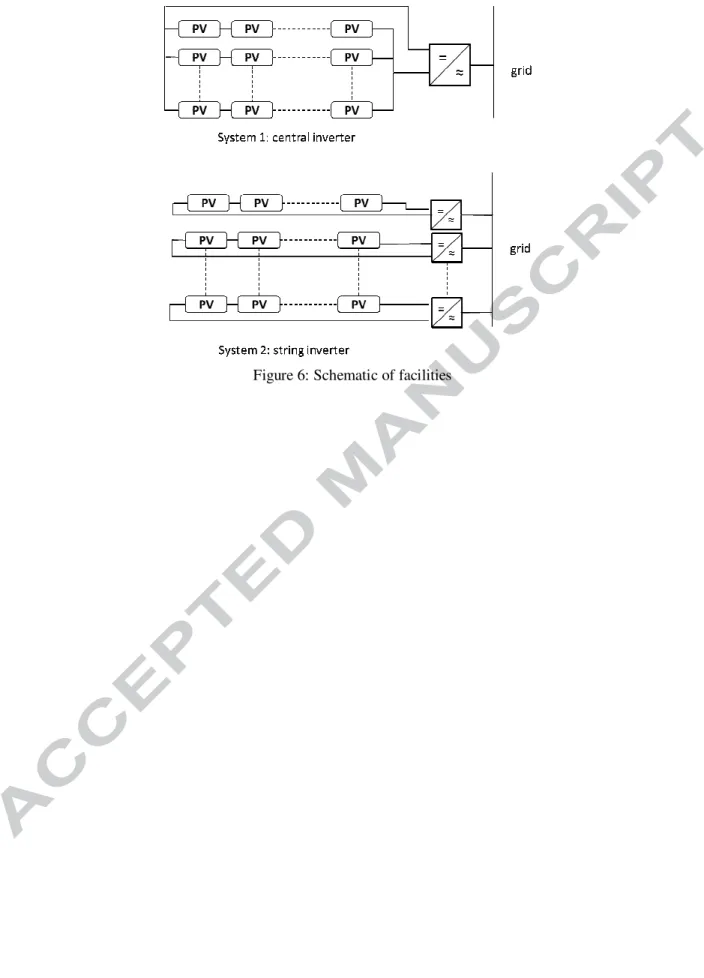
The inverter systems used are SMA Sunny Central 100 HE[29] for System 1 and SMA
Sunny Mini Central 9000TL [30] for System 2, both transformerless inverter. Their
technical specifications are presented also in Table 2. Following the criteria exposed in
the previous section, System 1 is a central inverter facility and System 2 is a string
facility, as it can show in Figure 6.
Figure 4
Figure 5
Table 2
Figure 6
System 1 is can generate 113.96 kWp using 44 PV arrays of 14 FOTONA model 185D
PV panels each, grouped in three strings of 15, 15 and 14 arrays respectively. Each
string has a protection box, containing the protection elements (fuse and a 10 A switch).
The protection boxes are located in the parcel to minimize wiring losses. The current of
the strings is conducted to the 100 kWp central inverter thought a 50 mm2 wire.
Maximum current of each string is 75.3, 75.3 and 70.28 A respectively.
System 2 can generate 56 kWp using 22 PV arrays, each of 14 PV panels: 8 PV arrays
of 185 Wp and 14 PV arrays of 180 Wp. The string inverter system consists of 6 SMA
Sunny Mini Central 9000TL, 8 kWp power, 4 inverter that control 4 PV arrays, and 2
inverters that control the six remaining PV arrays, three each one. This distribution
permits the inverters of System 2 to work at maximum power. The distribution of power
by each inverter is shown in Table 3.
4. The Case study Analysis
4.1. Central inverter vs. distributed system
The two facilities under study – System 1 and System 2 – are the property of
SOLARSAN S.L., which provided the to the research group for this case study: data on
total electric production measured by the inverter and by the measurement (counter)
system from both facilities over two complete year of operation data (November 2011
to November 2013, 727 days). Daily data recorded in the inverter system after the
of both facilities are presented in Figure 7. Electrical production of System 2 has been
calculated as sum of the electrical production recorded in each inverter.
Figure 7
To compare both facilities all data have been reduced to 1 kW since peak power are
different: data from each system have been divided by its respective peak power, 113.96
kW for System 1 and 56 kW for System 2. First at all, by adding montly values
appearing in fig 7 for each year, a total difference of 32.04 kWh/kWP for the first year
and 28.45 kWh/kWP for the second year are observed between the facilities showing
better performance for System 2, the string configuration inverter. This is the expected
result, as the operation of the distributed system with 6 inverters is closer to the MPPT
result [25]. This fact could be explained by the greater ease of string system to adapt the
functioning of each inverter to MPPT. In economic terms for a 100 kWp facility with
distributed layout and applying the usual price [6] for the electrical production that
means 1421 €/year and about 35000 € for the estimated life of the facility, 25 years. The
initial investment is about 1500 € up for the centralized system but the maintenance
costs are higher in the distributed facility due to the number of elements to be inspected.
However economic losses are lower in case of failure in the distributed system due to
the low probability of complete stopped.
A detailed study of the daily production of the system was completed, in order to
determine whether the observed fact has any seasonal patterns or any relationship to the
production levels. The proposed procedure involves a comparison that allows us to
data production at comparable quantitative intervals. It has previously been applied with
some success [12, 15] Detailed knowledge of wiring (location and connection of PV
arrays, length and section of wiring) and of the technical specifications of both the
inverter and the transformer systems is necessary.
Total daily electrical production of each facility, measured at the inverter system (PI.S.)
may be calculated from eq. (1):
where, PPVpanels are the PV electrical production in panels, E.L.DC the DC wiring losses
and E.L.inverter the electrical losses in the inverter system. Wiring losses were calculated
as a function of the wiring and the distance between the panels and the protection boxes,
and the distance from the protection boxes to the inverter (DC wiring losses), for the
maximum value of the electrical current flowing from the facilities. As has been
previously described, wiring lengths and sections, voltage and maximum current in both
facilities are known. Taking the worst case, ie, the longest length in each facility, E.L.DC
were calculated considering the Joule effect produced in copper wire (electrical
conductivity k = 56 ohm/m), with the electrical production for daily reading in the
inverter system and the voltage for a group of 14 panels.
Applying Eq. (1) to both facilities and subtracting the respective results (System 1 –
System 2) allows us to study the differences in the qualitative behavior of the items in
the equation.
∆E.L.inverter represents the differences in electrical losses caused by the inverter system:
a positive value shows lower values of electrical losses in the inverter system and so,
better performance of distributed system (System 2). ∆PI.S.and ∆PPVpanels represent the
difference between total electrical production measured by the inverter system and
produced by the PV panels, respectively and ∆E.L.D.C. represents the calculated
differences in DC electrical wiring losses. In this case, where panels of both facilities
are the same and the plants are located at the same place, PV production should be the
same, so that the term ∆PPVpanels will be zero.
Electrical DC losses have been calculated for central system considering the worst case
among the 44 string composing the facility. For the distributed system, same procedure
has been used for the six inverters of the facility. Results of these calculations have been
4.09% for central system and 1.89% for the distributed system. Electrical losses for
System 1 are higher due to the facility layout: two sections must be considered in the
installation, one between each set of strings and the protection system and the other
between the protection system and the inverter. For the distributed system, the strings
go directly to the inverter system, so lengths are shorter as well the electrical losses.
Table 4 shows the distribution of positive and negative values of ∆E.L.inverter. The results
in Table 4 appear to contradict the previously derived conclusions, since the proportion
of days that the centralized system performs better than the distributed appears greater.
If the study is repeated classifying ∆E.L.inverter values at regular intervals (Table 5), most
of the values are in the range of (-0.2, +0.2) kWh/kWp. For such small values, we
consider most representative to work with the totals of these values rather than
individual values, ie:
Applying Eq. 3 to all available values, the following results are obtained: ∑∆PI.S.=-60.5
kWh/kWp; ∑∆E.L.D.C.=2.03 kWh/kWp and ∑∆E.L. inverter=+58.46 kWh/kWp, i.e.
positive value and so better performance of distributed system.
Table 4 shows that negative values of ∆E.L. inverter, appears in periods of low production
(winter days), when working slightly away from the MPPT is not decisive for the total
production. On the other hand, in times of high production, this fact is crucial for the
proper functioning of the system, since minor deviation from the MPPT lead to major
losses in the inverter. Figure 8 highlights this conclusion clearly: as production
increases, better performance of the distributed system is shown.
4.2. Study of string system
A new study comparing the functioning of the inverters in the string system (System 2)
was also performed. As previously mentioned, 4 inverters in System 2 control 4 PV
arrays, each of 14 panels, and a further 2 inverters control three of the PV arrays. Using
the same procedure as in the previous section - i.e., comparing production data, reduced
to one kW - the influence of the number of groups connected to the inverter over the
same production period was studied. As Figure 9 confirms, no significant performance
differences were found between the inverters working with 4 PV arrays, slightly above
their capacity, and those working below their peak with 3 PV arrays.
Figure 9
An analysis of the operation under real conditions of two grid-tied PV plants over two
years of operation has been completed. Both facilities are located in the same
geographic area and are subject to similar meteorological conditions. The installations
were designed following the same criteria: use of the same PV panels and wiring
criteria, attempting at all times to minimize electrical wiring losses before and after the
inverter system. The two systems differ with regard to their inverters: one facility uses a
central inverter and the second plant uses a string inverter configuration. The analysis
procedure is based on a small number of easily obtained parameters from the
maintenance company of the facilities: total electrical production, measured in the
counter and/or in the inverter system and the knowledge of technical characteristics of
the facilities (PV panels, wiring, inverter system and counter system).
In general, the distributed system outperformed the centralized system, which is mainly
evident at times of high production, when setting the inverter to its MPPT operation is a
crucial factor. The MPPT adjustment is quick and simple, as fewer arrays are connected
to the inverter. When production is low, this parameter is less important and the
centralized system works better than the multi-string system. Economically, the
difference in the initial investment for the same installed power is negligible compared
to the total cost of the installation. For example, for an installation type of 100 kW, the
difference stands at around €1500. However, the maintenance costs of the string system
are higher: smaller inverters are less robust and their probability of failure increases,
although replacements are cheaper and easier to fix and do not necessarily shut down
In this case study, the difference in production has been estimated at 0.069 kWh/day per
kWp installed. With the current feed-in tariff system that amounts to a total of €35000
over the estimated working life of a 100 kWp facility, which is equal to a plant life of
approximately 25 years.
Referred to the second study done, about the use of inverters of the distributed system
slightly above or below its peak power, the results indicate that, for overcapacity factors
used, the operation did not significantly affected. With respect to the maintenance cost
no differences have been found and the probability of failure has been the same for all
cases.
Acknowledgements
This research received economic support from the Spanish Government (grant
ENE2011-27511) and the Department of Culture and Education of the Regional Government of Castilla y
León, Spain (grant BU358A12-2). The authors are also grateful for the cooperation offered by
SOLARSAN S.A., the company responsible for the PV facilities described in this paper.
References
[1] Communication from the European Parliament, the Council, the European Economic and
Social Committee and the Commettee of the Regions: Energy Roadmap 2050.
(COM/2011/0885 final ). 2011. http://eur-lex.europa.eu
[2] M. Rekinger, I.T. Theologitis, G. Masson, M. Latour, D. Biancardi, A. Roesch, et al.
European Photovoltaic Industry Association. Connecting the Sun: Solar photovoltaics on the
road to large-scale grid integration. 2012. Available in:
(http://www.epia.org/news/publications/). Last accessed: (April, 2014)
[3] T. Ambo, E. Ikawa, R. Inzunza. Relevant aspects in designing a photovoltaic inverter for
industrial and commercial applications. International Power Electronics Conference , ECCE
[4] REN21-Renewable Energy Policy Network for the 21st Century. REN21. Renewables 2012.
Global Status Report. 2012. www.ren21.net
[5] G. Masson, S. Orlandi, M. Rekinger. Global Market Outlook For Photovoltaics 2014-2018.
in: T. Rowe, (Ed.). European Photovoltaics Industrial Association 2014. Available in:
(http://www.epia.org/news/publications/). Last accessed: (June, 2014)
[6] Real Decreto 1578/2008, de 26 de septiembre, de retribución de la actividad de producción
de energía eléctrica mediante tecnología solar fotovoltaica para instalaciones posteriores a la
fecha límite de mantenimiento de la retribución del RD661/07.
[7] G. Masson, M. Latour, D. Biancardi. Global Market Outlook for Photovoltaics until 2016.
in: C. Winneker, (Ed.). European Photovoltaic Industry Association, Brussels, Belgium, 2012.
Available in: (http://www.epia.org/news/publications/). Last accessed: (April, 2014)
[8] M. Diez-Mediavilla, C. Alonso-Tristan, M.C. Rodriguez-Amigo, T. Garcia-Calderon.
Implementation of PV plants in Spain: A case study. Renewable & Sustainable Energy
Reviews. 14 (2010) 1342-6.
[9] Y. Yamamoto. Pricing electricity from residential photovoltaic systems: A comparison of
feed-in tariffs, net metering, and net purchase and sale. Solar Energy. 86 (2012) 2678-85.
[10] G. Masson, M. Latour, M.l. Rekinger, I.T. Theologitis, M. Papoutsi. Global Market
Outlook for Photovoltaics 2013-2017. in: C. Winneker, (Ed.). European Photovoltaics Industry
Association, Brussels, Belgium, 2013. Available in: (http://www.epia.org/news/publications/).
Last accessed: (April, 2014)
[11] M.E. Meral, F. Diner. A review of the factors affecting operation and efficiency of
photovoltaic based electricity generation systems. Renewable and Sustainable Energy Reviews.
15 (2011) 2176-84.
[12] M. Díez-Mediavilla, C. Alonso-Tristán, M.C. Rodríguez-Amigo, T. García-Calderón, M.I.
Dieste-Velasco. Performance analysis of PV plants: Optimization for improving profitability.
Energy Conversion and Management. 54 (2012) 17-23.
[13] D. González-Peña, M. Díez-Mediavilla, M. de Simón-Martín, M. C. Rodríguez-Amigo, T.
García-Calderón, C. Alonso-Tristán. Photovoltaic Prediction Software and Their Evaluation
with Real Data in Spain. 27th European Photovoltaic Solar Energy Conference and Exhibition,
Frankfurt (Germany), 2012. pp. 4112 - 7.
[14] M. Díez-Mediavilla, C. Alonso-Tristán, M.C. Rodríguez-Amigo, T. García-Calderón, F.
Matesanz-Roncero. Better Cheaper Than Expensive? A Comparative Analysis of Two Solar
Panel Technologies. 25th European Photovoltaic Solar Energy Conference and Exhibition / 5th
World Conference on Photovoltaic Energy Valencia, Spain, 2010.
[15] M. Díez-Mediavilla, M.I. Dieste-Velasco, M.C. Rodríguez-Amigo, T. García-Calderón, C.
Alonso-Tristán. Performance of grid-tied PV facilities: A case study based on real data. Energy
[16] B. Burger, D. Kranzer. Extreme high efficiency PV-power converters. 13th European
Conference on Power Electronics and Applications, EPE '09, Barcelona, 2009. pp. 6178-90.
[17] D. Picault, B. Raison, S. Bacha. Guidelines for evaluating grid connected PV system
topologies. IEEE International Conference on Industrial Technology, ICIT '09, Churchill, VIC,
USA, 2009.
[18] M.C. Cavalcanti, G.M.S. Azevedo, B.A. Amaral, K.C. De Oliveira, F.A.S. Neves, Z.D.
Lins. Efficiency evaluation in grid connected photovoltaic energy conversion systems. IEEE
36th Power Electronics Specialists Conference, PESC '052005. pp. 269-75.
[19] X. Wu, X. Wei, X. Tao, R. Yu. Optimal design of structures of PV array in photovoltaic
systems. International Conference on Intelligent System Design and Engineering Application,
ISDEA 2010, Changsha, Hunan, 2010. pp. 9-12.
[20] E. Villanueva, P. Correa, J. Rodriguez, M. Pacas. Control of a single-phase cascaded
H-bridge multilevel inverter for grid-connected photovoltaic systems. IEEE Transactions on
Industrial Electronics. 56 (2009) 4399-406.
[21] F. Schimpf, L.E. Norum. Grid Connected Converters for Photovoltaic, State of the Art,
Ideas for Improvement of Transformerless Inverters. Nordic Workshop on Power and Industrial
Electronics Espoo, Finland, 2008. pp. 1-6.
[22] A.M. Pavan, S. Castellan, S. Quaia, S. Roitti, G. Sulligoi. Power electronic conditioning
systems for industrial photovoltaic fields: Centralized or string inverters? , International
Conference on Clean Electrical Power, ICCEP '07, Capri, 2007. pp. 208-14.
[23] S.B. Kjaer, J.K. Pedersen, F. Blaabjerg. A review of single-phase grid-connected inverters
for photovoltaic modules. IEEE Transactions on Industry Applications. 41 (2005) 1292-306.
[24] X. Yuan, Y. Zhang. Status and opportunities of photovoltaic inverters in grid-tied and
micro-grid systems. Shanghai, 2007. pp. 593-6.
[25] Z. Zhao, L. Yin, X. Sun, L. Yuan, T. Lu. Recent development of technology and market of
grid-connected PV system in China. Incheon, 2010. pp. 1-6.
[26] PVGIS. http://re.jrc.ec.europa.eu/pvgis
[27] Meteonorm. http://www.meteonorm.com
[28] Energías Fotovoltaicas de Navarra S.L. FOTONA 180D. Technical Specifications.
http://www.fotona.es/uploads/FOTONA180D.pdf
[29] SMA Solar Technology AG. Sunny Central SC 100 outdoor HE
http://www.inverter-directory.net/SMA_Solar_Technology_AG-Sunny_Central_SC_100_outdoor_HE-1388.html
[30] SMA. SMC 7000TL, 8000TL, 9000TL inverter. Technical Specifications.
Figure 8. Number of days with positive and negative values of ∆E.L.inverter, classified in
intervals of daily production
Table 1: Technical specifications of PV panels in use.
PV panels FOTONA 180W
FOTONA 185W
VPM (V) 36.8 36.8
IPM (A) 4.89 5.02
WP (W) 180 185
Performan
ce 15% 15%
Table 2: Case study of the technical specifications of both systems
System 1 System 2
Table 3: Distribution of power between inverters of System 2
Inverter Ner PV arrays Power / kW
I 3 7.56
II 3 7.77
III 4 10.08
IV 4 10.36
V 4 10.22
Table 4: Number of days with positive and negative values of ∆E.L.inverter throughout the
studied period.
Jan Feb Mar Ap May Jun Jul Aug Sep Oct Nov Dec Total
∆E.L.inverter>0 5 6 11 11 20 41 61 58 41 26 11 5 45.8%
Table 5: Number of days with positive and negative values of ∆E.L.inverterclassified in intervals
of production. ∆E.L.inverter
KwH/KwP (-1 , -0.8) (-0.8 , -0.6) (-0.6 , -0.4) (-0.4 , -0.2) (-0.2 , 0) (0 , 0.2) (0.2 , 0,4) (0.4 , 0.6)
Ner values 1 2 5 52 371 233 55 7
The operation of two grid-tied PV facilities over a two-year period is presented.
The central inverter system is compared to the string inverter system.
A procedure based on a small number of easily obtained parameters is used.
The string inverter outperforms the central inverter.