A guide to measuring urban risk resilience
188
0
0
Texto completo
(2) Copyright © 2015 EMI. Permission to use this document is granted provided that the copyright notice appears in all reproductions and that both the copyright and this permission notice appear, and use of document or parts thereof is for educational, informational, and non-commercial or personal use only. The authors of this report must be acknowledged in all cases as the source when reproducing any part of this publication. Opinions expressed in this document are those of the authors and no not necessarily reflect those of participating agencies and organizations. Report prepared by Bijan Khazai, Fouad Bendimeard, Omar D. Cardona, MarthaLiliana Carreño, Alex H. Barbat and Christopher G. Burton. Layout and Cover Design: Layout and Cover Design: Allaine Aaron Corpuz Printed in the Philippines by EMI An international, not-for-profit, scientific organization dedicated to advancing urban resilience through science and innovation. EMI 2F Puno Bldg. Annex 47 Kalayaan Ave., Diliman Quezon City 1101, Philippines Telephone/Fax: +63-2-9279643; Telephone +63-2-4334074 Email: [email protected] Website: http://www.emi-megacities.org.
(3) ABOUT THE AUTHORS. Dr. Bijan Khazai ([email protected]) is a senior research scientist at Karlsruhe Institute of Technology’s Center for Disaster Management and Risk Reduction Technology (CEDIM). His research activity encompasses social vulnerability and resilience analysis, megacities and urban risk management, and decision support and multi-criteria analysis. As a project specialist for Earthquake and Megacities Initiative (EMI), he has led the development of urban risk and resilience indicators in many cities around the world since 2007 and engaged a wide range of stakeholders including communities, government, academia, private sector, and civil society. He has served as the Principal Investigator in many European and international research projects on indicators including the Global Earthquake Model Social Vulnerability and Integrated Risk Project. He holds Masters and Doctoral degrees in Civil and Environmental Engineering from the University of California at Berkeley. Dr. Fouad Bendimerad ([email protected]) is Chairman of the Earthquake and Megacities Initiative and has served as consultant and advisor on risk management to several international organizations and corporations, including the World Bank, and United Nations organizations, as well as governments and corporations worldwide. He has led multi-disciplinary teams in developing solutions to building urban resilience in many cities around the world. Dr. Bendimerad earned his masters and doctorate degrees in Civil Engineering from Stanford University, and has written numerous articles and papers on disaster risk assessment and management. Prof. Omar-Dario Cardona ([email protected]) is professor and researcher at the Institute of Environmental Studies (IDEA) of the Universidad Nacional de Colombia (UNC) at Manizales and visiting professor of the International Center of Numerical Methods in Engineering (CIMNE) of the Technical University of Catalonia (UPC) in Barcelona. He has been consultant of the World Bank, the Inter-American Development Bank (IDB) and other UN agencies. He is known internationally for his pioneering approaches to vulnerability reduction and risk management and is the 2004 Disaster Prevention Sasakawa Laureate. He holds a degree in Civil Engineering from the UNC and a Ph.D. in Earthquake Engineering and Structural Dynamic from the UPC, in Barcelona, Spain. Dr. Martha-Liliana Carreño ([email protected]) iis a researcher of the International Center for Numerical Methods in Engineering (CIMNE). She is also Adjunct Professor at the Technical University of Catalonia (UPC). She has participated in several projects funded by the European Commission, and in projects funded by the Spanish Government. She is in charge of the coordination of various projects with the World Bank and the Inter-American Development Bank, led by CIMNE, regarding the development of indicators of risk and risk management and catastrophe risk assessment in countries of the Latin America and the Caribbean Region. She holds a bachelor and master’s degree in Civil and Structural Engineering from the Universidad de Los Andes, Bogotá, Colombia, and a Ph.D. in Earthquake Engineering and Structural Dynamics of the Technical University of Catalonia (UPC), in Barcelona, Spain. Prof. Alex H. Barbat ([email protected]) is professor of Structural Mechanics and of Earthquake Engineering at the Technical University of Catalonia (UPC) in Barcelona. He is also the Head of the Risk Assessment Group of the International Center of Numerical Methods in Engineering (CIMNE) in Barcelona, where he has collaborated on European and international research projects as well as in many consultancies on urban risk and resilience indicators besides having several publications on this topic. He is the president of the Spanish Association of Earthquake Engineering since 2004 and received his doctorate degree in Civil Engineering at the Technical University of Catalonia, UPC, in Barcelona, Spain. Dr. Christopher G. Burton ([email protected]) iis senior scientist and coordinator of the Social Vulnerability and Disaster Resilience program at the Global Earthquake Model (GEM) Foundation Secretariat, in Pavia, Italy. He completed his PhD in Geography at the University of South Carolina with Susan Cutter in 2012. His research focuses on vulnerability and disaster resilience to explore the compounded nature of natural hazard impacts..
(4) ACKNOWLEGEMENTS This Guidebook presents the results of many years of work by several organizations and individuals who have all contributed to the content presented here. Without these contributions, the Guidebook could have not been accomplished.. Earthquake and Megacities Initiative - EMI Mr. Jerome Zayas has been involved as a project manager for EMI and contributed to the technical editing of the Guidebook. Mr. Allaine Aaron Corpuz contributed to the overall design and layout, of the Guidebook.. Center for Disaster Management and Risk Reduction Technology – CEDIM Prof. Friedemann Wenzel organized and initiated the contributions of the Karlsruhe Institute of Technology to urban DRM indicators starting with the project in Istanbul and has supported the development of urban risk and resilience indicators in many cities presented in this Guidebook.. International Center for Numerical Methods in Engineering - CIMNE Mr. Mario A. Salgado-Gálvez has been the project leader of several urban probabilistic multi-hazard risk assessments using the CAPRA platform, led workshops in more than 15 countries and contributed to the technical editing of the Guidebook. Mr. César A. Velásquez developed the CAPRA post-processing holistic tool besides having participated in several projects where risk has been assessed at urban and national level. Dr. Mabel C. Marulanda research has been focused on risk indicators that have been applied at different resolution levels and also has evaluated the robustness of risk indicators at urban level..
(5) Universidad Nacional de Colombia (UNC) at Manizales As advisors of disaster risk management for the Institute of Environment Studies (IDEA) and of the city administration, Ms. Dora C. Suárez, Mr. Lizardo Narváez (Manizales) and Dr. Juanita López (Medellín) have implemented the System of Indicators for the formulation of the Integrated Disaster Risk Management City Plan.. Istanbul Metropolitan Municipality Mr. Mahmut Bas and Osman Kilic, as the Director and Deputy Director in Directorate of Earthquake and Ground Research at the Istanbul Metropolitan Municipality together with Mr. Emin Mentese and Ms. Betul Konukcu have actively contributed and implemented the urban indicators of risk and resilience in Istanbul. Furthermore, Prof. Mustafa Erdik and Ms. Bilgen Sungay from the Bogazici University Kandilli Observatory and Earthquake Research Institute (KOERI) have been instrumental in the development of this work..
(6) Getting started how to use this Guidebook. THE GUIDEBOOK IS A REFERENCE FOR PRACTITIONERS DESCRIBING THE PRINCIPLES, TOOLS AND PRACTICE OF DEVELOPING AND IMPLEMENTING URBAN DISASTER RISK AND RESILICE INDICATORS BASED ON STAKEHOLDER CONSULTATIONS IN CITIES.. What is the objective of the Guidebook? This Guidebook describes the principles, tools and practice of three urban disaster risk and resilience indicator systems based on our collective experience in implementing them in various urban settings in the last decade with local authorities. The objective of the Guidebook and the case studies presented here is to describe the methodology and participatory processes for developing, customizing and implementing these indicator systems with the aim of supporting urban professionals in their DRM decision-making.. For Whom is the Guidebook Intended? Public officials and authorities in local, regional and national government agencies are the primary target audience for this Guidebook. The Guidebook would also be useful for a various type of professionals dealing with urban disaster risk management; development planning and policy reform in the realm of disaster risk reduction; and for practitioners working in risk reduction, emergency and recovery planning.. How to Use the Guidebook? The Guidebook can be likened to a toolkit - a collection of useful methods, tools and use cases relevant for dealing with the challenge of operationalizing indicators in urban disaster risk management. The Guidebook has been designed specifically for urban DRM professionals to plan and implement a participatory process for assessing a cities risk and resilience from an integrated perspective. The Guidebook walks the users through the indicator design process and supports them in activities and exercises for selecting and weighting appropriate indicators. The case studies demonstrate how indicators can be used as an innovative risk communication tool to engage stakeholders in understanding their risk and for taking ownership of the risk factors in their city. The Guidebook draws from the experience in implementing this process in various urban settings throughout the world, including Bogota, Istanbul, Manizales, Medelin, Quezon City and Mumbai..
(7) The Guidebook in a nutshell The Guidebook focuses on the principles, methods and practice for the application of three indicator systems of urban risk and resilience where the authors have over a decade of experience in the participatory implementation of these tools for risk communication and disaster risk management.. chapter. 01 02. General notions of urban risk and resilience. Urban Disaster Risk Index (UDRi) A risk communication tool which provides a holistic view of disaster risk by capturing through indices both the direct physical damages of buildings and infrastructure, as well as considering social vulnerability or lack of resilience that can aggravate the physical effects.. 03. Risk Management Index (RMI) A risk management tool which brings together a group of indicators that measure a city’s risk management performance, reflecting organizational, development, capacity and institutional actions taken to reduce risk, to prepare for crisis and to recover efficiently from disasters.. 04. Disaster Resilience Index (DRI) A monitoring and evaluation tool for benchmarking and measuring progress (or lack of progress) along a city’s key development policies and processes for mainstreaming of risk reduction and increasing resilience..
(8) 05. Case Studies. 05. Case Studies. Bogotá, Colombia. Istanbul, Turkey. The system of indicators have been applied two times. First, in the framework of the Program of Indicators of Disaster Risk and Risk Management of the Inter-American Development Bank. Second, by the City Administration itself with the participation of all city’s institutions to evaluate the evolution of DRM and to update the Integrated Disaster Risk Management Plan.. The system of indicators has been applied in several stages from 2007 till present time. Starting with collaborations between the municipality in Istanbul, EMI and KIT the indicator systems and initial framework were established. The City of Istanbul then undertook a widescale customization and implementation of the indicator systems which included a specially developed social survey for developing the UDRi.. Medellin, Colombia As result of the interest of the Development Planning Secretary of the City Administration, a collective evaluation of risk management was implemented with the participation of many agencies of the city. In addition, a comprehensive risk assessment was conducted to define the actions of the Integrated Disaster Risk Management Plan of the city.. Manizales, Colombia The evaluations in Manizales have been made two times in the last decade. The first one was conducted by the National University (IDEA) as result of the request of the Municipality and the second was promoted in the framework of the Disaster Risk Management Program of Manizales with the support of the Environment Authority of the Region. The results have been key information for the public investment, the land-use plan and the Participative Disaster Risk Management Plan 2013-2026.. Mumbai, India The UDRi and the DRI were customized and applied in Mumbai in a collaboration between EMI and the Municipal Corporation of Greater Mumbai (MCGM) with over 130 stakeholders as a risk communication and planning tool for measuring progress (or lack of progress) on the mainstreaming of risk reduction approaches in the city’s development policies and processes.. Quezon City, Philippines The UDRi was applied in Quezon City through a collaborative effort between EMI and the Quezon City Government. The implementation outlines a participatory process for the development of social fragility and lack of resilience indicators and their respective weights..
(9) executive summary Principles and Theory Most often local governments and city stakeholders do not have a clear understanding of the urban risk and resilience conditions and trends, which has undermined their ability to understand and manage available risk reduction and risk management options. A successful implementation of Disaster Risk Reduction (DRR) options demands appropriate mechanisms to communicate and transfer the overall knowledge on risk and its underlying drivers to the various stakeholders involved in the disaster risk management process of a city. In the age multiple layers of data, indicators can play an important role in turning data into relevant information for decision-makers and public officials. In particular, they can help to simplify a complex array of information about natural hazard risk and resilience in the urban environment and contribute to improved disaster risk management and policy development. The Guidebook describes three urban risk indicator systems which have been developed as complementary tools to communicate risk and promote discussion around appropriate local level risk and resilience strategies at city level: the Urban Disaster Risk Index (UDRi), the Risk Management Index (RMI) and the Disaster Resilience Index (DRI). In the last decade (2004-2014) these urban indicator systems have been implemented and tested with city stakeholders in 16 city applications around the world. Some of them have been made in Asia by the Earthquake and Megacities Initiative (EMI) and the Karlsruhe Institute of Technology (KIT) (Mattingly et al., 2006; Khazai et al., 2008, Khazai et al., 2009; Khazai and Bendimerad, 2011; EMI, 2012; Bendimerad et al., 2013; EMI, 2014; and Khazai et al., 2015) others have been conducted in the Americas and Europe by the National University of Colombia (UNC/IDEA) at Manizales (IDEA, 2005; Cardona 2006, Suárez and Cardona 2007, Suárez 2008) and by the International Center for Numerical Methods in Engineering (CIMNE) of the Technical University of Catalonia in Barcelona (Marulanda et al., 2013; Salgado-Gálvez et al., 2014a; Cardona et al., 2014; Carreño et al., 2014b). The authors present their collective experience and findings in the application of the indicator systems in these applications in this Guidebook. Overall, the objective of the indicator systems and the way that they were applied is to help enhance ownership within city stakeholders with the aim to assist in disaster risk management policy development, decision-making, and monitoring effectiveness of specific DRR options adopted..
(10) Figure 0.1 locations of case study implementations of the three indicator systems. In this Guidebook we present the theory, development and application of the urban risk and resilience indicatory systems. This Guidebook is structured in three main sections. We will first provide brief overview of the theory and principles of each of the three urban indicator systems. Then we present a step-by-step guide to the application of the indicator methods and. This is followed by an overview of software tools developed by the Global Earthquake Model (GEM) and the Comprehensive Approach to Probabilistic Risk Assessment (CAPRA) initiatives for implementing some of the indicator systems presented here. Finally, the practice in the collaborative development and application of the indicator systems is reviewed through the experience in 6 Case Studies carried out in the last decade (2004-2014).. THREE URBAN RISK AND RESILIENCE INDICATOR SYSTEMS Urban Disaster Risk Index (UDRi) The quantitatively derived Urban Disaster Risk Index (UDRi) provides a holistic view of disaster risk by capturing through indices both the direct physical damages of buildings and infrastructure, as well as considering social fragility and lack of resilience issues (risk drivers) that can aggravate the physical effects. The models and methodology referred to here as the Urban Disaster. City applications by EMI/KIT: Istanbul (2007-2009), Amman (2008-2009), Kathmandu, Metro Manila (2006), Quezon City (2011-2012), Pasig (2010-2011), Dhaka (2013), Mumbai (2008-2010); City applications by UNC/IDEA and CIMNE: Manizales (2006 and 2014), Medellín (2010 and 2014), Bogotá 1.
(11) Risk Index (UDRi) was developed by Carreño (2006), Carreño et al. (2007a) and is based on Cardona’s model (Cardona, 2001; Cardona and Hurtado, 2002; Barbat and Cardona, 2003; IDEA, 2005) using a holistic approach for evaluating disaster risk by means of indices. The main objective of this indicator system is to measure disaster risk from an integrated perspective and to guide decisionmaking, not only by considering the potential direct impacts of disasters but also by identifying multiple socio-economic and capacity/resilience factors. Input data on disaster loss scenarios and vulnerability conditions at the urban level are necessary to apply the method. This technique covers different areas of the risk problem, taking into account issues such as: potential damages and losses resulting from extreme events; recurrent disasters or losses; social and environmental conditions that make particular countries or regions more disaster prone; the capacity of the economy to recover; the operation of key services, among others. This approach contributes to communication of disaster risk and its efficient management, through the identification of risk drivers, weaknesses or “hot-spots” within the urban space. It is noteworthy that when seismic risk assessments are performed the UDRi has also been referred to in the literature as Urban Seismic Risk Index (USRi).. Risk Management Index (RMI) The disaster Risk Management Index (RMI) brings together a group of indicators that measure a city or country’s risk management performance and effectiveness. These indicators reflect the organizational, development, capacity and institutional actions taken to reduce vulnerability and losses, to prepare for crisis and to recover efficiently from disasters (Carreño et al. 2004, 2005b; 2007b; IDEA 2005; Cardona and Carreño, 2013). This index provides a quantitative measure using qualitative qualifications of management based on predefined targets or benchmarks that risk management efforts should aim to achieve. This approach of risk management evaluation was implemented taking into account four public policies, each of which has six topics to be evaluated using five levels of performance. The policies include the risk identification, risk reduction, disaster management, and governance and financial protection. Risk identification and knowledge comprise the individual perception, social representation and objective assessment. Risk reduction involves corrective and prospective prevention and mitigation interventions. Disaster management comprises response and recovery. And, governance and financial protection, related to institutionalization and risk transfer. The results obtained are very useful to define the next step to improve the existing level of achievement in each topic and public policy; therefore the RMI is very effective method to define a disaster risk management plan..
(12) executive summary. Disaster Resilience Index (DRI) The Disaster Resilience Index (DRI) was developed as a monitoring and evaluation tool for benchmarking and measuring progress (or lack of progress) on the mainstreaming of risk reduction and resilience approaches in the city’s development policies and processes (Khazai and Bendimerad, 2011a). The structure of the DRI is based on key thematic areas of resilience in cities and linked to EMI’s analytical Disaster Risk Management Master Planning (DRMMP) model, which consists of strategies, policies, actions and processes for mainstreaming disaster risk reduction at the local level through a participatory planning process (Bendimerad et al., 2016). The DRI is a self-assessment tool which aims to establish an initial benchmark and obtain consistent and objective evaluations around 10 indicators grouped along five thematic areas: 1) legal and institutional processes; 2) Awareness and capacity building; 3) Critical services and infrastructure resiliency; 4) Emergency preparedness, response and recovery planning; and 5) Developmental planning, regulation and risk mitigation. The DRI was initially developed and applied in Mumbai (Khazai and Bendimerad 2011a, Khazai et al., 2011), in Aqaba (Jordan) and different provinces and municipalities in the Philippines (EMI, 2014).. The application of the indicator systems described in this Guidebook in cities prove their value, to the extent they have been helpful as a tool in a cities DRM practices and other planning processes that impact DRM in the city. The 6 Case Studies described here demonstrate how the indicators systems are localized and customized to a cities own needs and have evolved in successive implementations depending on needs of the city stakeholders. These Case Studies will also show how the indicator systems can be set up in a participatory way so that they can reflect a city’s DRM plan and be relevant for its resilience strategy. Informed by lessons learned in the practice of implementing the indicator systems in various cities, the Guidebook also provides recommendations in the participatory planning, implementation and evaluation of the indicators encompassing the following three broad areas:.
(13) executive summary. To develop the system of indicators in close collaboration with a “Core Group” of local professionals, to engage them in the development of the data, the understanding of the framework and methodology; and to ensure ownership over the indicator system and its periodic updating and upgrading. To work closely within a broader and targeted “Focus Group” in evaluating and validating the indicators, such that they are: relevant to the organizational, functional and cultural processes of a city; represent the conditions and reality of socio-economic vulnerability in city; and reflect the insight, view and past studies when they are available (e.g., earthquake risk assessment, transportation study, housing and shelter, land use planning, construction codes and standards, water supply and water treatment analysis, etc.) To implement and disseminate the system of indicators through a process of engaging a broad group of stakeholders in the city, such that they are used: as an effective risk communication tool that inherently relates to the city-level DRM practices; as a planning tool that aids in correcting, reviewing and deciding on where to invest resources; and as Disaster Risk Management benchmarks which assist in policy decision making and monitoring of different risk reduction practices implemented at the local level..
(14) List of Acronyms CAPRA. move. Comprehensive Approach to. Methods for the Improvement of. Probabilistic Risk Assessment. Vulnerability Assessment in Europe. CIMNE. IRDR. International Center for Numerical Methods in Engineering of UPC. DRI Disaster Resilience Index. EMI Earthquake and Megacities Initiative. GEM Global Earthquake Model. ICSU International Council for Science. Integrated Research of Disaster Risk. RMI Risk Management Index. UDRi Urban Disaster Risk Index. UNC National University of Colombia (Universidad Nacional de Colombia). UPC Technical University of Catalonia. IDEA. (Universidad Politécnica de Cataluña). Institute of Environment Studies of UNC. USRi. (Instituto de Estudios Ambientales). Urban Seismic Risk Index.
(15) TABLE OF CONTENTS 16 30 58 68 82. Chapter 1 General notions of urban risk and resilience. Chapter 2 Urban Disaster Risk Index (UDRi) Chapter 3 Risk Management Index (RMI). Chapter 4 Disaster Resilience Index (DRI). Chapter 5 Case Studies Istanbul Mumbai Quezon City Madelin Bagota D.C. Manizales. 135. Lessons from Practice. 138. Bibliography. 147. Annex 1. 154 166. Annex 2 Annex 3.
(16) CHAPTER. 01. GENERAL NOTION FOR URBAN RISK RESILIENCE.
(17) 17. CHAPTER 1. Disaster risk is defined as the probability of future damages and losses associated to the occurrence of environmental hazards, where levels and types of loss are determined by the levels of exposure and vulnerability of society (UNDRO, 1980; Cardona, 1990; UNISDR, 2009; Birkmann, 2006).. Risk is the result of the interactions, in time and space, of probable physical events with exposed vulnerable assets of the social and environmental systems (Cuny, 1984; Davis and Wall, 1992). On those interactions, physical events are transformed into hazards with the real potential for contributing to future loss and damage. It is in the latency of risk that the opportunity for risk prevention, mitigation and transfer exists, employing diverse adaptation or disaster risk management principles, strategies and instruments (Lavell, 1996; 1999). Disaster risk management should be defined as a social process that aims to reduce, predict and control disaster risk drivers in a development framework, by means of the design and implementation of appropriate policies, strategies, instruments and mechanisms (Cardona and Barbat, 2000). Disaster, on the other hand, is a social condition whereby the normal functioning of society has been severely interrupted by the levels of loss, damage and impact suffered (Cardona, 1990; Alexander, 1993; 2000; Birkmann, 2006). Those damages.
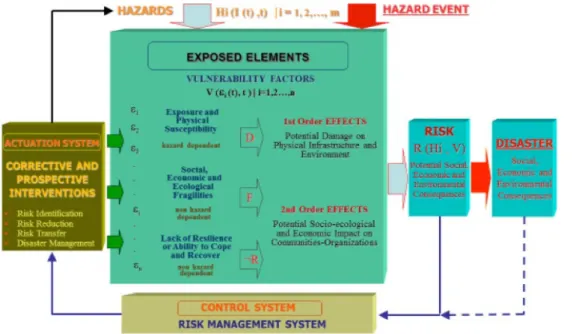
(18) 18 CHAPTER 1. and losses may, under given circumstances, reach such levels and consequences that can be defined as large-scale “disasters” or “catastrophes”. Also, when faced with lower levels of loss and damage, it is now common to refer to small- and medium-scale disasters (Marulanda et al., 2008; 2010; United Nations, 2009). Nevertheless, disasters, large or small, are the product of a complex relationship between the physical world, the natural and built environment, and society, its behaviour, functioning, organization and development (Quarantelli, 1998). As such it is product and consummated reality, but at the same time the existence of disaster conditions leads to new social processes and new or transformed risk conditions. Disasters associated with environmental hazards reflect and signify unmanaged risk and may also be seen as representing unresolved development problems (Westgate and O’Keefe, 1976; Wijkman and Timberlake, 1984). In other words, disaster may be seen as the actualization or materialization of existing disaster risk. That is to say, latent risk conditions are transformed into real damage and loss when an extreme or triggering physical event occurs (Maskrey, 1993). The existence of risk is a sine qua non a prerequisite for future disaster. Risk is a continuum, and disaster one of its many “moments” or “materializations” (ICSULAC, 2009).. Figure 1.1 Theoretical framework for a holistic approach to disaster risk assessment and management. (Cardona and Hurtado, 2000; Cardona and Barbat, 2000; Barbat and Cardona, 2003; IDEA, 2005; Carreño et al., 2007a; 2007b; 2012; Cardona, 2009).
(19) 19 CHAPTER 1. Figure 1.1 shows the conceptual framework of the holistic approach for risk evaluation. From this comprehensive perspective, it can be seen that risk is a function of the physical vulnerability –or the potential physical damage– and a set of vulnerability factors that configure the vulnerability conditions of the context. The physical vulnerability is obtained from the susceptibility of the exposed elements to hazards, considering the potential intensities, of the hazardous events in a period of time, the vulnerability of the context depends on the social fragilities and issues related to lack of resilience of the disaster prone socio-technical system or context. Using the meta-concepts of the theory of control and complex system dynamics to reduce risk, it is necessary to intervene through corrective and prospective actions the vulnerability factors. Then, risk management requires an institutional structure (control system) and public policies and actions (an actuation system) to implement the changes needed on the exposed elements to reduce risk. This framework provides a summary of the causal and intervention aspects associated with this holistic vision of risk and vulnerability (Cardona and Hurtado, 2000; Cardona and Barbat, 2000; Barbat and Cardona, 2003; IDEA, 2005; Carreño, 2006; Carreño et al., 2007a; 2007b; 2012; Cardona, 2009). This diagram is based on different but common risk approaches in which the main focus is the vulnerability understanding and intervention to make emphasis in the association of risk assessment with decision-making (Turner et al., 2003; IDEA, 2005; Birkmann, 2006; Carreño et al., 2007a,b).. This conceptual framework recognizes hazards, which can be natural or socionatural, and the exposed elements and their associated vulnerability factors as being part of the environment. Both elements, hazards and exposed assets, coexist and have constant interactions among them. In this context hazards can be the result of the physical impacts on natural environment of extreme events. Subsequently, these hazards may have impacts or adverse effects on natural (ecosystems) and human systems (socio-economic). When the intensity or recurrence of hazard events is related to processes of environmental degradation and human intervention in natural ecosystems the origin of hazard can be considered as socio-natural. They are created where human activity intersects with natural ecosystems. Changes in the environment and new hazards associated with climate change will probably comprise the most notable example of socio-natural phenomenon (Lavell, 1996; 1999; 2000)..
(20) 20 CHAPTER 1. The exposure is the social and material context represented by people, resources, infrastructure, production, goods, services and ecosystems that may be affected by a hazard event. It is the inventory of components of society and environment that are exposed to the hazard from spatial and temporal point of view. The objective of land use and territorial planning, or other forms of rationalizing location is, therefore, to reduce to a minimum unnecessary exposure and vulnerability to damaging events. Where exposure to events is impossible to avoid, land-use planning and location decisions must be accompanied by other structural or non-structural methods for preventing or mitigating risk. Land use plans must be based on location and vulnerability reduction strategies and methods (UNISDR, 2009). Migration, development models, regional trade, economic dependency, global trends and transitions, among others, are also key issues related to exposure and physical susceptibility at local level. Understanding this diversity of contexts and decisions is an intrinsic challenge for social science research.. Vulnerability essentially refers to the propensity of exposed elements, such as human beings and their livelihoods, to suffer damage and loss when impacted by single or diverse hazard events (UNDRO, 1980; Timmerman, 1981; Cardona, 1990; Liverman, 1990; Cannon, 1994; 2006; UNISDR, 2009; Birkmann, 2006; Blaikie et al., 1996; Thywissen, 2006; IPCC, 2007).. Although there are intrinsic or innate levels of vulnerability associated with life in general, as far as risk and disaster studies are concerned, vulnerability, its facets, factors and levels should be seen as a result of defined social processes. That is to say, vulnerability is the most palpable manifestation of the social construction of risk (Aysan, 1993; Blaikie et al., 1996; Wisner et al., 2004). As such, it is a social construction and the physical world and the potential for hazard it presents are given real social dimension and significance by differential forms of human behaviour and their results in terms of the organisation, structuring and functioning of society and its support elements (Wilches-Chaux, 1989; Wisner et al., 2004). Such social construction may be expressed or understood in various ways. These include (ICSU-LAC, 2009):.
(21) 21 CHAPTER 1. how human action influences the levels of exposure and vulnerability in the face of different physical events; how human intervention in the environment (degradation or transformation) leads to the creation of new hazards or an increase in the levels or damage potential of existing ones (socio-natural); how human perception, understanding and assimilation of the factors of risk influence their reactions, prioritization and decision making processes.. Vulnerability is the “state of reality” that underlies the concept of risk. It is the causal reality that determines the selective character of the severity of damage when a hazard event occurs. Vulnerability reflects susceptibility, the intrinsic predisposition to being affected; the conditions that favour or facilitate damage. The measurement of vulnerability is a challenge; it is related to the degree of exposure, susceptibility, fragility and lack of resilience of a socio-ecological system that favours adverse effects. Many believe that it is not possible to assess vulnerability; however it is fundamentally important to understand how vulnerability is generated, increases, and builds up (Cardona, 2001; 2004; 2010). The evaluation and follow-up of vulnerability and risk is needed to make sure that all those who might be affected, as well as those responsible for risk management, are made aware of it and can identify its causes and roots. To this end, evaluation and follow-up must be undertaken using methods that facilitate an understanding of the problem and that can help guide the decision-making process. Vulnerability of human settlements and ecosystems is intrinsically tied to different socio-cultural and environmental processes (Cutter, 1994; Kasperson et al., 1988; Cutter et al., 2008). In any case, it refers to susceptibilities or fragilities of the exposed elements; i.e. to the likelihood to be affected, but it is also related to the lack of resilience of the society and environment. Vulnerability is also closely tied to natural and built environmental degradation at the urban and rural levels and in some cases to the gradual climate change. Therefore, when seen from a social perspective, vulnerability signifies a lack or deficit of sustainability. In this regard, risk is socially constructed, even though it has a relationship to physical.
(22) 22 CHAPTER 1 and natural space. In many places, increases in vulnerability are likely to be related to factors such as rapid and uncontrollable urban growth and environmental deterioration. These lead to losses in the quality of life, the destruction of natural resources and landscape, and loss of genetic and cultural diversity. In order to analyse vulnerability as part of wider societal patterns it is necessary to identify the deep rooted and underlying causes of vulnerability and the mechanisms and dynamic processes that transform these into insecure conditions. All this leads to the conclusion that the underlying causes of vulnerability are social, economic, environmental, and political processes that affect the distribution of resources among different groups, which in turn reflect the distribution of power in society. In summary, vulnerability reflects the susceptibility or the intrinsic predisposition to being affected or the conditions that favour or facilitate damage. The measurement of vulnerability is a challenge; it is related to the degree of exposure, susceptibility, fragility and lack of resilience of a socio-ecological system that favours adverse effects (Cardona, 2001; 2004; 2006; 2010). Adhering to the hypothesis that the lack of sustainability and vulnerability are correlated and considering that the lack of capacity to anticipate, cope, and recover is also a factor of vulnerability, particularly taking into account the climate variability and change, then, it is possible to say that the causal factors of vulnerability are defined as follows:. Exposure is the susceptibility of human settlements and environment to be affected by a dangerous phenomenon due to its location in the area of influence of the phenomenon and to a lack of physical resistance. Susceptibility/Fragility is the predisposition of society and ecosystems to suffer harm resulting from the levels of susceptibilities or fragilities of human settlements and disadvantageous conditions and relative weaknesses related to physical, ecological, social, economic, cultural, and institutional issues. Lack of resilience is the limitations in access to and mobilization of the resources of the human settlements and their institutions, and the incapacity to adapt and respond in absorbing the socio-ecological and economic impact. Resilience includes the capacity to anticipate, cope and recover..
(23) 23 CHAPTER 1. Indicators or indices could be proposed to measure vulnerability from a comprehensive and multidisciplinary perspective. Their use intend to capture favourable conditions for direct physical impacts (exposure and susceptibility), as well as indirect and, at times, intangible impacts (socio-ecological fragilities and lack of resilience) of hazard events (IDEA, 2005; Carreño et al., 2007a). Therefore, according to this approach, exposure and physical susceptibility are necessarily “hard” conditions for the existence of physical risk, or first order effects, and these are hazard dependent. The propensity to suffer negative impacts as a result of the socio-ecological fragilities and not being able to adequately face disasters, are circumstances of the context that can be considered “soft” conditions, related to second order effects that aggravate the impact and usually are non-hazard dependent. Whilst accepting this general principle as to the hazard specific nature of vulnerability, it is also clear that certain factors, such as poverty, the lack of social networks and social support mechanisms, will affect vulnerability levels irrespective of the type of hazard context — i.e. they are non-hazard dependent. Clearly this type of generic factor is different to the hazard specific factors and assumes a different position in the intervention equation and the nature of risk management processes (ICSU-LAC 2009). Vogel and O’Brien (2004) stress the fact that vulnerability is multi-dimensional and differential –i.e. varies across physical space and among and within social groups; scale-dependent with regard to time, space and units of analysis such as individual, household, region, system; and dynamic– characteristics and driving forces of vulnerability change over time. The society is exposed in the time and space to different hazards, and it can be vulnerable to them. The vulnerability of the society depends on several factors related to thematic dimensions. Under this generic framework, it is possible to develop different approaches that capture the different thematic dimensions of vulnerability (Cardona and WilchesChaux, 2006). Overall, these dimensions provide the initial basis for a holistic and integrative perspective on vulnerability. A deconstructive approach helps us visualizing vulnerability from different angles and perspectives that involve also technological, anthropological, and psychological aspects. Some aspects have to be addressed with specific methods and modelling approaches. Physical and economic vulnerabilities must be addressed using probabilistic and deterministic approaches associated with damage scenarios and potential economic impacts; social and cultural issues of the vulnerability shall be assessed with reference to demographic, institutional and cultural aspects defined by indicators, population data, statistics and qualitative judgements. A holistic approach facilitates an understanding of vulnerability as a dynamic and changing circumstance or condition (Susman et al., 1983; Comfort et al., 1999; Renn, 1992; Vogel and O’Brien,.
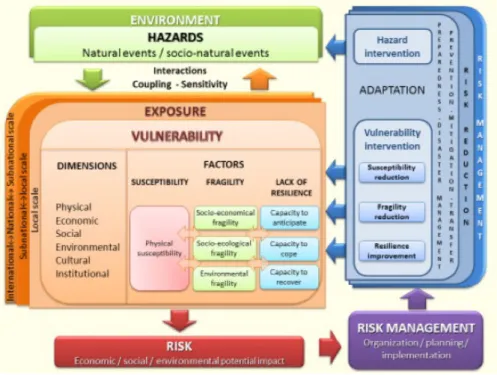
(24) 24 CHAPTER 1. 2004). Moreover, we can also see it as an accumulative process of permanent fragilities, deficiencies, and limitations that play a role in the existence of higher or lower levels of vulnerability. Risk is defined as the potential occurrence of physical, social, economic, and environmental consequences or losses, in a given area and over a period of time, resulting from the vulnerability conditions of a socio-ecological system exposed to hazards (UNDRO, 1980; Cardona, 1990; UNISDR, 2009). In order to face the recognized risk, it is necessary to involve the risk governance which includes the totality of actors, rules, conventions, processes and mechanisms concerned with how relevant risk information is collected, analysed and communicated and management decisions are taken. These management decisions include tasks on risk reduction, prevention, mitigation and transfer which allow implementing measures for hazard intervention or vulnerability intervention that lead to exposure and susceptibility reduction and resilience improvement. Figure 1.2. presents a conceptual framework of risk and risk management based on the abovementioned holistic approach of risk. This conceptual model has been used to propose the framework of the EU project MOVE (Methods for the Improvement of Vulnerability Assessment in Europe) (Cardona 2010; Carreño et al. 2014a; Birkmann et al. 2013, 2014). Figure 1.2 Components of the framework for integrated risk management. (Cardona 2010; Carreño et al. 2014a; Birkmann et al. 2013, 2014).
(25) 25 CHAPTER 1. Risk management may be understood as a series of elements, measures and tools directed towards intervention in hazards and vulnerabilities with the objective of reducing existing or controlling future possible risks (IDEA, 2005; Carreño et al., 2007b). It involves preparedness, emergency response and reconstruction. Disaster risk management aims to articulate different types of actions, assigning a central role for prevention and mitigation, but without abandoning disaster response, in an attempt to develop preventive policies that significantly reduce the need for intervening in disasters once these occur (UNISDR, 2009). This type of management should not be seen as a purely government-led process, but a participatory exercise, involving governmental and non-governmental actors with the idea of dealing with risk and disaster. In this sense, good risk governance means disaster risk management based on, one hand, the involvement of the diverse social, institutional, public, and private forces and groups that exist, on a broad and inclusive territorial basis, and on the other hand, rules, conventions, processes and mechanisms concerned with how relevant risk information is collected, analysed and communicated and management decisions are taken. It follows, therefore, that risk management is a fundamental strategy for sustainable human development given that it attempts to establish an equilibrium between natural ecosystems and the societies which occupy and utilize them, guiding human actions and activities that affect the environment and vice versa. The terms prevention and mitigation have been used to identify activities that attempt to intervene hazards and vulnerabilities, and thus avoid or reduce risk or future disasters and loss; they are related to the society’s capacity to anticipate (Carreño et al., 2007b). In addition, preparedness activities provide better options for disaster management prior to and during disaster, and are put in place prior to the impact of dangerous physical events. Emergency or humanitarian response attempts to guarantee human security and welfare immediately following the impact of different physical phenomenon and is related to the coping capacity of the society (UNISDR, 2009). Rehabilitation and reconstruction activities, on the other hand, attempt to optimally restore, transform and improve the economic, social, infrastructure and life style conditions in the affected zone, granting higher future levels of security through the implementation of activities and actions that control future risk. In this sense, the notion of capacity to recover (rehabilitation and reconstruction) has been imbued with the idea of future disaster prevention and mitigation; i.e. the capacity to anticipate..
(26) 26 CHAPTER 1. Central to the capacity to recover from natural hazard events is the concept of disaster resilience. In an urban environment, resilience emphasizes the processes and conditions within communities that enhance or reduce a population’s ability to resist, adapt to, and recover from a shock or perturbation within the shortest possible time and with little or no outside assistance. Resilience, in this way, is synonymous with the notions of “bouncing back” or “jumping back” (Klein et al. 2003; Paton and Johnston 2006), and the term “resilience” has been used to describe great strength under adversity and the ability to withstand unfavorable circumstances (Burton 2015). Timmerman (1981) is probably the first to define resilience within natural hazards and disasters research where he described the concept as the measure of a system, or part of a system’s, capacity to absorb or recover from a damaging event. This report adopts the UNISDR definition of resilience in which resilience is “the ability of a system, community or society exposed to hazards to resist, absorb, accommodate to and recover from the effects of a hazard in a timely and efficient manner, including through the preservation and restoration of its essential basic structures and functions” (UNISDR 2009). How communities will be affected following an earthquake may be conceptualized in terms of their resilience, and numerous perspectives have been developed to advance the underpinnings of the concept. In general, resilient communities are those that take deliberate action to reduce hazard risks, prepare for, and accelerate recovery in the face of hazards and disasters. From the perspective of vulnerability and risk reduction, it is important to make emphasis that corrective intervention are related to processes that attempts to reduce “existing” levels of risk in society or in a component of society, product of the historical patterns of territorial occupation, production, construction of infrastructure, amongst other things. It reacts to and compensates for risk that already exists in society. Examples of corrective risk management methods or instruments are the construction of dams and dykes to protect population already located in the flood plains of rivers, the retrofitting of buildings against earthquakes and hurricanes, changes in cropping patterns in order to adjust to adverse environmental conditions, reforestation of river basins in order to diminish existing processes of erosion, landslides and flooding. On the other hand, prospective intervention refers to the anticipation or prevision of risk that may be generated with “future” development projects and investments. It comprises measures taken to guarantee that new risk factors do not appear with new initiatives in construction, production, infrastructure, transport and.
(27) 27 CHAPTER 1. commercialization. Prospective intervention must be seen as an integrated part of development and project planning, whether these are developed by government, private sector or civil society. The final objective of this type of intervention is to avoid new unnecessary risks guaranteeing adequate levels of sustainability for new investments and thus avoiding the need for more costly corrective intervention later (Lavell, 1999; 2000; UNISDR, 2009). Disaster risk management concepts and experience have been developed in the light of historical and projected future contexts of hazard and vulnerability. When dealing with climate related aspects this can be seen in the light of hazards associated with what may be referred to as “normal climate variability”. Adaptation to climate change, on the other hand, has been developed as a notion and sought practice through other professional and institutional modalities as if it were a separate and discrete area of knowledge, directed to future climate conditions influenced by human intervention, using scenarios which go up to 50 or 100 years ahead. Adaptation means “adjustment” in natural or human systems to a new or changing condition; i.e. the ability of an individual or group to adjust to changes in the natural and built environment (IPCC, 2007; UNISDR, 2009). Overall, adaptation can be anticipatory or reactive, autonomous and planned. Adaptive capacity requires techniques and strategies to be devised that enable society to absorb and deflect the impact of hazards (Birkmann et al., 2013). Disaster risk management and adaptation mean, therefore, not only the hazard and vulnerability intervention but also the resilience improvement (Lavell, 1999; 2000; IDEA, 2005; Cardona, 2004; 2010). Finding a common ground for understanding disaster resilience is difficult, and the relationship between vulnerability and resilience is not well articulated. The latter is partially because academic understandings of the concepts vary by context (Adger 2006; Eakin and Luers 2006; Cutter et al. 2008). There is some overlap in characteristics of communities that make them vulnerable and characteristics that make them resilient, however. The extent of overlap often depends on the definition and description of the vulnerability and resilience terms (Manyena 2006; Cutter et al. 2008). In general, two viewpoints have emerged in natural hazards and disasters research. The first viewpoint describes vulnerability as the degree or capacity of a system to cope with and recover from a damaging event. Within this context,.
(28) 28 CHAPTER 1. vulnerability is described as a function of reduced resilience (see Timmerman 1981; Dow 1992; Bohle et al. 1994; Wisner et al. 2004). That is, a population or community that is highly vulnerable is not resilient, and vice versa. Conversely, if vulnerability is only viewed as a ‘threat’ or ‘exposure’ to a natural hazard, or as the degree for potential for loss, or the circumstances that put people at risk (see Mitchell 1989; Downing 1991; Alexander 1993; Cutter 1996; Cutter et al. 2003), then vulnerability and resilience may not be related at all. In conclusion, the development of techniques that permit a permanent monitoring of territorial and social accumulation of vulnerability or the evolution of physical trigger processes is conducive to the application of realistic and dynamic planning techniques. This should be flexible enough to adjust to continuous or abrupt changes in the natural, economic, and social environment. This type of corrective and prospective approach is more appropriate than the uni-dimensional approaches, given the levels of uncertainty and instability that characterize existing processes of change and which render long term plans almost impossible to realize. In many places economic, social, and cultural factors are becoming increasingly relevant for the dynamics of growth and progress. In view of this, it is necessary to develop less rigid planning models that allow to, more adequately, incorporate uncertainty, instability and surprise, using diagnostic and follow-up techniques that permit the monitoring of the social and environmental context and possible perturbing agents. Some of those disaster risk indexes can be applied at urban level depending on the subject that is being measured and the objective of the assessment. On one hand, the Urban Disaster Risk Index (UDRi), also known in the literature as the Urban Seismic Risk Index (USRi) when the assessment is only related to earthquake allows quantifying risk from a holistic perspective, that is, by not only considering the direct physical impact but socioeconomic aspects related to the social fragility and the lack of resilience. UDRi is flexible in terms of resolution level and the definition of it depends on the disaggregation level of the required information which at urban level is usually at counties, localities and neighbourhoods. Because UDRi is a composite index that depends on several descriptors, the final result can be disaggregated to assess which are the descriptors that are contributing the most so they can be communicated to the decision-makers and stakeholders inviting to the action identifying the hard and soft weaknesses of the urban center. On the other hand, the Risk Management Index (RMI) aims to assess the management level and how it has evolved along to time. Both indices are complimentary and to show that, three case studies in.
(29) 29 CHAPTER 1. Colombia are presented for main cities where the indices have been estimated. In either case, the objective of the measurement is to identify key factors that can be intervened with the aim of improving, by decreasing the risk levels or by increasing the disaster risk management capacity. Also complimentary to the quantitative derivation of the UDRi is the Disaster Risk Index (DRI). The Mumbai case study presented here, shows how the DRI is applied based on a participatory assessment of resilience that allows the co-production of key indicators describing the key themes of resilience in a city as well as their evaluation through a selfassessment. The DRI framework pays particular attention to the diagnosis of potential deficiencies and opportunities along a city’s key development policies and processes for mainstreaming of risk reduction and increasing resilience.
(30) CHAPTER. 02. Urban Disaster Risk Index (UDRi).
(31) 31. CHAPTER 2. Principles and Theory A holistic evaluation of disaster impacts has to take into account not only potential losses or damages from natural hazards, but also economic, social, and institutional factors, among others. In this sense, a holistic evaluation of risk must fully leverage results of urban loss and damage scenarios.. These outputs describe potential physical impacts of disasters, such as number of casualties, number of injured, percent building damage or economic costs and are obtained through mathematical modeling of the underlying hazard and physical vulnerability of the built environment. This is sometimes referred to as the “hard approach”. In addition, a holistic evaluation of risk must also look through a multi-disciplinary lens and take into account the dynamic interplay between physical risk of the built environment as well as the human dimensions within a hazard zone that can aggravate the physical risk. This, so-called “soft approach”.
(32) 32 CHAPTER 2. must include both susceptibility or fragility factors – as pre-event, inherent characteristics or qualities of exposed systems that create the potential for harmas well as lack of resilience factors that can account for the societal response to an event in terms of pre-event risk reduction, in-time coping and post-event response measures (Birkmann et al., 2013, 2014).. The Urban Disaster Risk Index is a composite indicator that measures risk from an integrated perspective and guides decisionmaking for identifying the main interdisciplinary factors of vulnerability to be reduced or intervened.. The quantitatively derived Urban Disaster Risk Index (UDRi) (also known in the literature as Urban Seismic Risk Index – USRi when seismic risk is assessed) provides a holistic view of disaster risk by capturing through indices both the direct physical damages of buildings and infrastructure, as well as considering social fragility or lack of resilience that can aggravate the physical effects. The models and methodology referred to here as the Urban Disaster Risk Indicators (UDRi) was developed by Carreño (2006) and Carreño et al. (2007a) which is based on Cardona’s model (Cardona, 2001; Cardona and Hurtado, 2002; Barbat and Cardona, 2003; IDEA, 2005) using a holistic approach for evaluating disaster risk by means of indices. The main objective of this indicator system is to measure disaster risk from a holistic and integrated perspective to guide decisionmaking, not only by considering the potential direct impacts of disasters but also by identifying multiple factors contributing to social vulnerability and lack of resilience in a city. The rationale behind this methodology is that the development of preparedness strategies and allocation of resources must not only consider the direct physical risk to people and assets, but also the societal context present within a city that gives rise to risk. The Urban Disaster Risk Indicators allow decision makers to separately view the different dimensions of physical risk from disasters (e.g. losses of population, buildings, critical facilities) as well as obtain a holistic view and gain further insight when combining the additional impact from lack of resilience and social fragilities within a city with physical risk. The goal of the integrated risk analysis is to identify concentrations of the highest impact areas or “hot spot” areas within a limited geographic area to focus respective planning and decision-making. Hotspots can be defined in terms of the local administrative units that are relevant for emergency planning, preparedness and policy. Usually these constitute the smallest administrative areas for which building.
(33) 33 CHAPTER 2. and population census data is available. Input data on disaster loss scenarios and vulnerability conditions at the sub-city district urban level are necessary to apply the method. This approach contributes to communication of disaster risk and its efficient management, through the identification of weaknesses or “hot-spots” within the urban space. The UDRi methodology was originally developed for the Inter-American Development Bank through the IDB-IDEA Indicators Program by the Institute of Environmental Studies (IDEA) of the National University of Colombia, Manizales (UNAL) (Cardona et al. 2005; Carreño, 2004; IDEA 2005). The UDRi approach outlined in the Guidebook remains essentially the same holistic, systematic, multi-step process, however, the stakeholder-validated implementation of the methodology presented in the Guidebook has been further refined through numerous applications and projects in cities across the world and updated with lessons learned from each of these case studies. Together with its partners at Manizales, the International Center for Numerical Methods in Engineering (CIMNE) of the Technical University of Catalonia (UPC), and local counterparts in the Philippines, the Earthquake and Megacities Initiative (EMI) undertook a preliminary application of the indicator approach to megacities in Metro Manila (Fernandez et al., 2007). Besides the implementation in Metro Manila, many other related applications of the model have been undertaken by the IDEA-CIMNE team and the methodology has been tested and evaluated in other cities and sub-national regions in Latin America and Europe. These applications include Bogotá D.C. (Carreño and Cardona, 2006; FOPAE, 2011), Manizales (Suárez 2007) and Medellín (Salgado-Gálvez et al., 2014a; 2014b) (Colombia), Quito (Ecuador), Managua (Nicaragua), San José (Costa Rica), Santo Domingo (Dominican Republic), Port of Spain (Trinidad and Tobago) (Carreño et al. 2013), Barcelona (Marulanda et al., 2013, Carreño et al. 2014a,b) (Spain) and Lombardy region (Italy). The Urban Disaster Risk Indicators have also been successfully implemented with stakeholders by EMI in Metro Manila (Fernandez et al., 2006); Istanbul (Khazai et al., 2008; Khazai et al., 2009; Kilic et al., 2012), Amman (EMI, 2009), Pasig (EMI, 2012), Quezon City (Bendimerad et al., 2013), Mumbai (Khazai et al., 2011a, 2011b) and Dhaka (EMI, 2014). In this Guidebook we present in detail the application of this method in Istanbul, Mumbai, Medellín, Bogotá D.C. and Manizales..
(34) 34 CHAPTER 2. METHODOLOGY The current UDRi methodology is based on Cardona’s original model (Cardona, 2001; Cardona and Hurtado, 2002; Barbat and Cardona, 2003, IDEA 2005), accounting for a holistic approach and describing seismic risk by means of indices. Expected building damage and losses in the infrastructure, obtained from feasible future loss scenarios are basic information for the evaluation of physical risk in each unit of analysis and then, using these data, a physical damage index that accounts for the first order effects is obtained. The proposed method can be developed on a multi-hazard evaluation environment and, therefore, it is necessary to include physical damage estimations for all the considered hazards. The holistic evaluation of risk by means of indices is achieved by affecting the physical risk with an aggravating coefficient, obtained by considering contextual conditions, such as the socioeconomic fragility and lack of resilience, that aggravate initial physical losses. Available data about these conditions at urban level are necessary to apply the methodology. The proposed holistic evaluation of risk is performed using a set of input variables, herein denominated descriptors. They reflect the physical risk and the aggravating conditions that contribute to the potential impact. Those descriptors, which will be discussed later, are obtained from the future loss scenarios and from socio-economic and coping capacity information of the exposed context (Carreño et al., 2005). The model of holistic urban risk evaluation proposed by Carreño et al. (2007a) improves conceptual and methodological aspects of the first proposal of Cardona (2001), refining the applied numerical techniques and turning it into a more versatile tool; which has been possible because remarkable advances in the probabilistic estimation of losses associated to natural extreme events. The conceptual improvements provide a more solid theoretical and analytical support, eliminating unnecessary and assumed aspects of the previous method and providing more transparency and applicability in some cases. Cardona’s original model allows the evaluation of the seismic risk in an urban center taking into account the characteristics of the physical risk, seismic hazard, physical exposure, socio-economical fragility and lack of resilience, that permits to identify those characteristics of the urban center that increase the level of risk and also the critical areas. This model studies different types of information by means of indicators and uses a normalization process of the results based on the mean and.
(35) 35 CHAPTER 2. on the standard deviation which is applied to each indicator. As a consequence, the results obtained with Cardona’s method allow a comparison of the holistic seismic risk among the different areas of a urban center in a relative way, but not a comparison in absolute terms with other urban areas. Cardona’s model uses of a neuro-fuzzy system, with fuzzy sets which identify the linguistic qualifications of the descriptors, but where the necessary information for the calibration of this system do not exist. The new method proposed by Carreño (2006) conserves the approach based on indicators, but it improves the procedure of normalization and calculates the final indices in an absolute (non-relative) manner. This feature facilitates the comparison of risk among urban centers. The exposure and the seismic hazard have been eliminated in the method proposed in this paper because they have been included into the physical risk variables calculation in a direct manner; also, the descriptor of population density, a component of the exposure in Cardona’s model, is now included as a descriptor of social fragility. The new approach preserves the use of indicators and fuzzy sets or membership functions, proposed originally by Cardona, but in a different way. Other improvements of Carreño’s model refer to the units of some of the descriptors; in certain cases it is more important to normalize the input values respecting the population than with respect of the area of the area under analysis. This is, for example, the case of the number of hospital beds existing in the studied urban area. The socio-economic fragility and the lack of resilience are a set of factors (related to indirect or intangible effects) that aggravate the physical risk (potential direct effects). Thus, the total risk depends on the direct effect, or physical risk, and the indirect effects expressed as a factor of the direct effects. Therefore, the total risk can be expressed as follows:. UDRi = RF (1+ F ) . (2.1). p expression known as the Moncho’s Equation in the field of disaster risk RFi RFirisk index, RF is the physical risk index and F is indicators,Fwhere RT is the total i =1 the aggravating coefficient of the impact factor (1+F). The physical risk, RF, is. R = ∑w. × F . . evaluated in the same way, using the transformation functions like the one shown. m. in the Figure 2.1.. n. F = ∑ wFSi × FFSi + ∑ wFRj × FFRj i =1. . j =1. .
(36) 36 CHAPTER 2 UDRi = RF (1+ F ) p. RF = ∑ wRFi × FRFi . . i =1. (2.2). m n where p is the total number of descriptors of physical risk. F = ∑w × F + ∑w. × F . . index, FRFi areFSi the component factors wRFi are their FSi FRj andFRj i j = 1 = 1 weights respectively. The factors of physical risk, FRFi, are calculated using the gross values of physical risk descriptors. . such as the number of deaths, injured or the destroyed area, and so on. It has to be mentioned that although important,. = Rof 1+ F risk scenarios is not the main theUDRi calculation F physical. ( ) objective of a holistic risk assessment.. Coefficient, pF, depends on the weighted sum of a set of. R = w ∑. × F . . aggravating factors related to the socio-economic fragility, F RFi RFi FFSi, and the lack of resilience of the exposed context, FFRj i =1. ( RMI RI + RMI RR + RMI DM + RMI FP ) . RMI =m. n. 4. F = ∑ wFSi × FFSi + ∑ wFRj × FFRj i =1. Nj =1. . (2.3) . t i ic. ∑w I. RMI ct ( RI , RR , DM , FP ) = i =1N , RR , DM , FP )of ( RIinfluences where wFSi and wFRj are the weights or ∑ each i and j factors and m and nw are i the total number i =1 of descriptors for social fragility and lack of resilience. . respectively. Each of the factors used in the calculation of. 1. Figure 2.1 Example of. thebell USRix;captures a, b, c = different aspects and is quantified in. (. . ). 2b. − cthat, certain scaling procedures different units. Becausex of. transformation functions used to. 1+. a the values of each descriptor are needed to standardize. RMI RI + commensurable RMI RR + RMI DM + RMI FP ) and convert(them into factors. In this RMI = case we used the transformation4functions as the one 1 . standardize physical risk, social fragility and lack of resilience. . factors (Carreño et al., 2007a). sigmoidal ( x; a, c ) = shown in Figure 2.1 that standardize 1 + exp ⎡− athe − c )⎤⎦ risk, social ( x physical ⎣ N fragility and lack of resilience factors used in this study. t. Depending on the nature of thewdescriptor, the shape i I ic N. ∑. i =1 andRMI characteristics of the vary and because of w j t= 1 =functions. ∑. c ( RI , RR , DM , FP ). j =1functions that,. N. ( RI , RR , DM , FP ). related to descriptors of the physical risk. ∑w. i have an increasing shape while those related to the lack. (. i =1. ( N )). of resilience have aw decreasing µ = max × µ C one; ,K that , w is,× the µ higher C the RMI P. C ( 1). 1. N. C. value of the factors, the1lower their aggravation.. bell ( x; a, b, c ) =. 2b. RMI P = ⎡⎣max1(+w1x×−µcC (C1 ) ,K , wN × µC (CN ))⎤⎦ a. Ax. . . centroid. . .
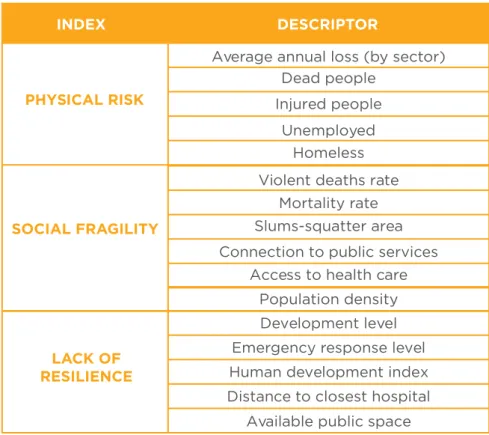
(37) 37 CHAPTER 2. The values on the abscissa of the transformation functions correspond to the values of the descriptors while the ordinate corresponds to the final value of each factor, either related to the physical risk or to the aggravating factor. In all cases, values of the factor lie between 0 and 1. Since the transformation functions are membership functions, for high risk and aggravating coefficient levels, 0 corresponds to non-membership while 1 means full membership. Limit values, denoted as XMIN and XMAX are defined by using expert opinions and information about previous disasters. Relative weights wFSi and wFRj that associate the importance of each of the factors on the index calculation are obtained by using an Analytic Hierarchy Process (AHP) that gives ratio scales from both discrete and continuous paired comparisons (Saaty and Vargas, 1991; Carreño, 2006; Carreño, et al. 2007a). This process has been performed starting from the experts opinions collected by means of the Delphi method. This is the most adequate way of judging the relative importance of variables having different nature and calculating their relative weights. It is estimated that the indirect effects of hazard events, sized by the factor F in Equation 2.3, can be of the same order than the direct effects. According to the Economic Commission for Latin America and the Caribbean (Zapata, 2004), it is estimated that the indirect economic effects of a natural disaster depend on the type of phenomenon. The order of magnitude of the indirect economic effects for a ‘wet’ disaster (as one caused by a flood) could be of 0.50 to 0.75 of the direct effects. In the case of a ‘dry’ disaster (caused by an earthquake, for example), the indirect effects could be about the 0.75 to 1.00 of the direct effects, due to the kind of damage (destruction of livelihoods, infrastructure, housing, etc.). This means that the total risk, RT, could be between 1.5 and 2 times RF. In this method, the maximum value selected was the latter. For this reason, the impact factor, F, takes values between 0 and 1 in Equation 2.3. Table 2.1 shows, as example, a list of suggested descriptors to be used in the estimation of the physical risk, social fragility and lack of resilience indexes; nevertheless, depending on the available information and its quality, they can be modified and even extended. At this stage it is important to note that the selection of the descriptors must ensure that the aspects that are being captured are not double-counted and that also, since all of them have an associated weight, its number should not be very large..
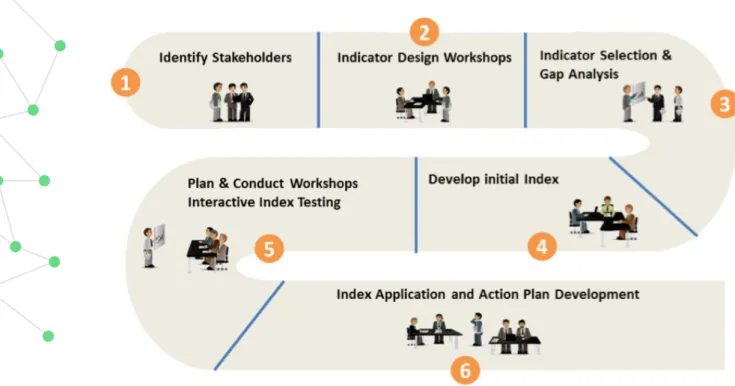
(38) 38 CHAPTER 2. INDEX. DESCRIPTOR Average annual loss (by sector) Dead people. PHYSICAL RISK. Injured people Unemployed Homeless Violent deaths rate Mortality rate. SOCIAL FRAGILITY. Slums-squatter area Connection to public services Access to health care Population density Development level. LACK OF RESILIENCE. Emergency response level Human development index Distance to closest hospital Available public space. Table 2.1 Example of physical risk, social fragility and lack of resilience descriptors. The robustness of the composite indicator at urban level has been tested by means of Monte Carlo simulations (Marulanda et al., 2009) showing very good results.. UDRi Participatory Modelling Process The methodology for co-developing the UDRi with city stakeholders is presented here uses a practical “how to” approach. It is important to note that numerous scientific and technical references are available in the literature which presents various advancements to the methodology – for example, how to deal with missing and incomplete data - while preserving the conceptual framework shown here. The process of developing the Urban Disaster Risk Index through a stakeholder consultation model consists of eight main steps (Figure 2.2) which should be passed in an iterative manner. However, as shown in the Case Studies this can be tailored to fit stakeholder needs with additional or less steps as required..
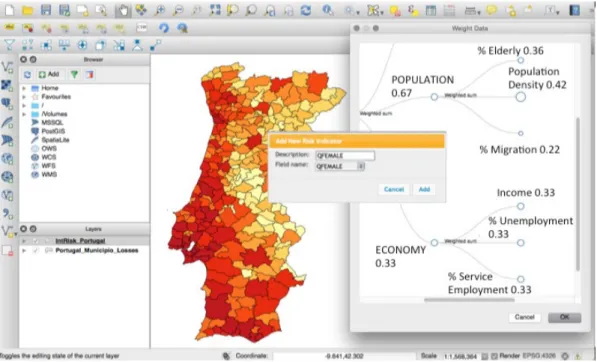
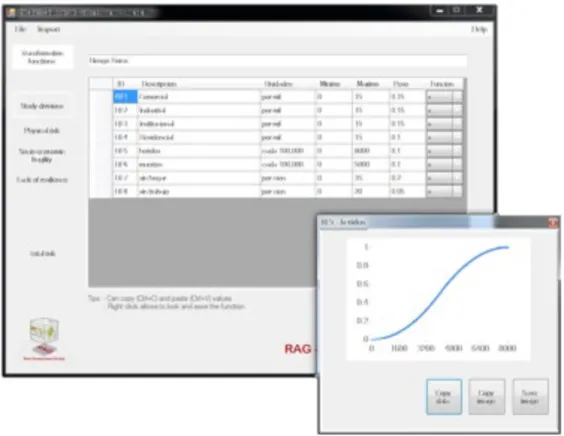
(39) 39 CHAPTER 2. Figure 2.2 Multi-step indicator development process for the UDRi using through a Stakeholder Consultation Model. Step1: Identify Key Stakeholders Identify and convene a broad representative range – “Focus Groups” - of local government officials in a city (e.g. emergency management, land-use planning, critical infrastructure and services, legal and institutional, awareness and advocacy, etc.) to join in an initiative to test, monitor, and validate the results of the implementation UDRi for their city. In addition the Focus Groups can be representatives from academia, particularly on individuals with background and expertise in decision science and risk management, representatives of the private sector and business leaders, and representatives of other organized groups of the society. Within this broad stakeholder group, invite a “Core Group” of individuals that have the most significant roles in using the urban indicator systems for managing DRM and assuring resilience in their city to be part of a work group to provide oversight and direction for the indicator systems and ultimately taking ownership over the indicator system and tools. The Core Group members should be composed of technical persons familiar with the application of the UDRi methodology and its key elements and/or may be supported by a technical project implementation team. The optimum number of members of the different Core Groups should be decided in each case. Experience from previous implementation has shown that the Core Group should be at least three members and a maximum of 10 so that the intensive collaborations are easier to handle..
Figure
+7


Documento similar
[SEGURITECNIA 1996] Dirección General de Protección Civil, Métodos para la identificación de los riesgos químicos (I), SEGURITECNIA, 1996, Madrid,
1. Definition and measurement of parameters: The fundamental parameters, by which the risks associated with a project are assessed, are risk probability and risk
Contrary, the coastal zone should include an area over and underwater; this will result in a zone where transversal exchanges should be kept in order to not lose
Frank Schweitzer, Risk Center and Chair of Systems Design, ETH Zurich.. Dr David Garcia, Risk Center and Chair of Systems Design,
This paper examines volatility and correlation dynamics in price returns of gold, silver, platinum and palladium, and explores the corresponding risk management
Olympic Games. Risk perception, prior knowledge, and willingness to travel: Investigating the Australian tourist market’s risk perceptions towards the Middle East. Investigating
The first one is a time-inconsistent mixture of the chance-constrained and second-order stochastic dominance (SSD) functionals of the value of a given set of functions up to
Urban agglomeration and even metropolization are linked to the urban –rural process emergence: the growth of most populated cities and the depopulation of less accessible rural
