econstor
www.econstor.eu
Der Open-Access-Publikationsserver der ZBW – Leibniz-Informationszentrum Wirtschaft
The Open Access Publication Server of the ZBW – Leibniz Information Centre for Economics
Nutzungsbedingungen:
Die ZBW räumt Ihnen als Nutzerin/Nutzer das unentgeltliche, räumlich unbeschränkte und zeitlich auf die Dauer des Schutzrechts beschränkte einfache Recht ein, das ausgewählte Werk im Rahmen der unter
→ http://www.econstor.eu/dspace/Nutzungsbedingungen nachzulesenden vollständigen Nutzungsbedingungen zu vervielfältigen, mit denen die Nutzerin/der Nutzer sich durch die erste Nutzung einverstanden erklärt.
Terms of use:
The ZBW grants you, the user, the non-exclusive right to use the selected work free of charge, territorially unrestricted and within the time limit of the term of the property rights according to the terms specified at
→ http://www.econstor.eu/dspace/Nutzungsbedingungen By the first use of the selected work the user agrees and declares to comply with these terms of use.
zbw
Leibniz-Informationszentrum WirtschaftFeijóo, Claudio; Gómez-Barroso, José Luis; Ramos, Sergio
Conference Paper
Implications of data-intensive applications for next
generation mobile networks
20th ITS Biennial Conference, Rio de Janeiro, Brazil, 30 Nov. - 03 Dec. 2014: The Net and the Internet - Emerging Markets and Policies
Provided in Cooperation with:
International Telecommunications Society (ITS)
Suggested Citation: Feijóo, Claudio; Gómez-Barroso, José Luis; Ramos, Sergio (2014) : Implications of data-intensive applications for next generation mobile networks, 20th ITS Biennial Conference, Rio de Janeiro, Brazil, 30 Nov. 03 Dec. 2014: The Net and the Internet -Emerging Markets and Policies
IMPLICATIONS OF DATA‐INTENSIVE APPLICATIONS FOR NEXT GENERATION MOBILE
NETWORKS
Claudio FEIJÓO *
José Luis GÓMEZ‐BARROSO
Sergio RAMOS
Abstract
Lately, the mobile data market has moved into a growth stage triggered by two facts: affordability of
mobile broadband, and availability of data‐friendly devices. At this stage, market growth is no longer
dependent on push strategies from suppliers; on the contrary, demand is now driving the market. However, it
will not be easy for mobile operating companies to cope up with the demand to come in the near future. The
infrastructure that is needed to support corresponding demand is far from completion. Operators are forced to
make heavy investments to upgrade and expand their networks. To decide how to handle the present and
upcoming demand, they need to identify and understand the characteristics of the scenarios they face. This is
precisely the aim of this article, which provides figures on the consequences for mobile infrastructures of a
generalised mobile media uptake. Data from the Spanish mobile deployment case have been used to arrive at
practical figures and illustration of results, but the conclusions are easily extended to other countries and
regions.
1. INTRODUCTION
Mobile data has followed voice in the process of fixed‐mobile convergence. The mobile
Internet is having a similar life cycle to its fixed counterpart. Once technological prerequisites were
met mobile data access was turned into a commercial offering, and early adopters rapidly joined.
Lately, the market has moved into a growth stage that has been triggered by two facts: affordability
of mobile broadband (i.e., diffusion of flat rates), and availability of data‐friendly – and again
affordable – devices. At this stage, technology, supply, and demand have entered into a virtuous
*
Universidad Politécnica de Madrid – [email protected]
circle in which market growth is no longer dependent on push strategies from suppliers; on the
contrary, demand is now driving the market. Paradoxically, however, it is worth noting that success,
if not properly managed, may be fatal to some players in this domain.
Where do the main risks lie? In the satisfaction of the demand. Once having experienced the
benefits of mobile data access, users want everything in their mobile devices. This also includes every
kind of media, any time, anywhere. Substitution effects between mobile and fixed Internet are
already in place (Humphreys, Von Pape, & Karnowski, 2013). Moreover, in a growing number of
situations, mobile services generate superior value‐in‐use for customers and will be – and already are
in many cases – preferred to fixed services (Gummerus & Pihlström, 2011). Whatever the blend of
these effects, one conclusion is clear: it will not be easy for mobile operating companies to cope with
the demand to come in the near future. The infrastructure that is needed to support such an
‘unleashed beast’ scenario – a ubiquitous deployment of Next Generation Mobile Networks (NGMN)
– is far from completion. Companies are forced to make heavy investments to upgrade and expand
their networks, which then squeezes profits, as the evolution of income is not parallel to that of
demand. On the other hand, these companies simply cannot refuse to take up the challenge. To
decide how to handle the present and upcoming demand, they need to identify and understand the
characteristics of the scenarios they face and will be facing. This is precisely the goal of this paper,
which attempts to provide figures on the consequences for NGMN of a generalised mobile media
uptake.
The paper is structured as follows. Next section collects information about the expected
evolution of different mobile services in the coming years. The third section translates those
expectations into service requirements for NGMN. In order to do this, two steps need to be
performed: a forecast of the broadband demand from mobile device users, and an analysis of
prospective scenarios regarding the evolution of technical parameters that define services. Finally,
the paper closes with a discussion on the feasibility and the techno‐economic implications for the
deployment of NGMN. Data from the Spanish mobile broadband deployment case have been used to
arrive at practical figures and illustration of results, but the conclusions are easily extended to other
countries and regions.
2. A PROSPECTIVE OVERVIEW OF MOBILE MEDIA SERVICES
The study of the evolution of user demands in mobile media requires some previous
categorisation, which classically can be produced from a content and applications perspective
use a service perspective that, although less granular, allows for a much simpler translation into
technical requirements.
For each service, overall trends have been highlighted and completed with specific data on
usage in Spain, or similar countries where global data were not available. Note that industry sources
typically suffer from lack of homogeneity in terms of geographical coverage and the range of years
covered. They are also generally obscure about the assumptions made for some of the calculations,
and often overly optimistic about the future evolution of the industry. In spite of these considerable
drawbacks, though, they offer a unique insight into the industry’s knowledge of the demand trends;
therefore, subject to the appropriate criticism, they will be used in this section.
Voice and messaging
The shift of users towards mobile data is slowly eroding the relevance of voice and message
services, as telephony is substituted by voice‐over‐IP (VoIP), short text messaging by instant
messaging (IM), and diverse types of over‐the‐top (OTT) services. In spite of this, traditional voice
and messaging are still typically forecast to grow modestly in the short to mid term. For instance,
Telecomspace (2012) suggests that this market will show a 3% increase in data traffic until 2017,
although some other sources suggest a small decline in the amount of traffic over the longer term
(UMTS Forum, 2011). In 2012, just 5% of the total mobile traffic originated from voice
communications in Europe, with this figure rapidly declining to a marginal rate of the total traffic
(Ericsson, 2012). Only less developed countries will show, of the total traffic, a relatively larger
proportion dedicated to voice for a longer period. Within this context, mobile VoIP is thought to
substitute considerably for conventional voice, with an annual growth of 36% predicted up until 2016
(Cisco, 2012).
Short text messaging (SMS) will follow a similar path to voice, according to industry
expectations. It will grow about 3% in the 2016 horizon, with a declining contribution to total traffic
(Cisco, 2012) as consumers increase their use of IM – from one billion subscribers in 2012 to 1.5
billion in 2016 – currently, they already send double the number of text messages through IM than
through SMS (Deloitte, 2014).
Mail is also accessed increasingly via mobile devices. In 2011, just 400 million consumers
accessed their email messages via their mobile devices. Prospects are that this number will increase
each year by nearly 30%, resulting in a total of 1.4 billion consumers accessing their mail accounts via
their mobile devices in 2016 (Cisco, 2012), a number practically coincident with the number of
Web access and social networks
After email, web access was initially the most important service for the surge of mobile data
usage. Penetration of mobile web access was 34.7% of the total number of smartphone owners in
2011 and grew to 49.6% in 2012, according to a comScore survey in Spain (2011, 2012).
Social network sites (SNS) are also increasingly accessed via mobile devices. In October 2012,
Facebook, the leading social network, reached a user base of 1 billion, of which 600 million users
accessed the service via mobile smartphones. In concordance, Cisco (2012) predicts an increase in
mobile users of social media, from 679 million users in 2011 to 2.4 billion users in 2016.
From an exclusive technical perspective, these two services are not expected to demand a
sustained data rate higher than 1 Mbps in the period considered up until 2020. The possible
influence of video is considered separately in the next section.
Audio / Video
The most relevant driver for growth in mobile data is video. Industry analysts (Cisco, 2012)
expect that over 70% of all mobile data traffic will be generated by video content in 2016, compared
to about 50% in 2012. The Ericsson forecast portrays a more restrained scenario, with video
accounting for more than 50% of global mobile traffic but only by 2019 (Ericsson, 2014b), yet with a
55% annual growth rate. With regard to the number of consumers, penetration of the usage of video
through smartphones was 32.6% in 2011 and increased to 38.1% in 2012, according to a comScore
survey in Spain (2011, 2012). Moving on to the amount of time users spend viewing visual content on
mobile devices, it was estimated to be about 10 minutes on average in 2012 (Ofcom, 2012). This
includes mostly video from Internet portals and television adapted to mobile media. However, this
figure is expected to grow considerably in future, as an increasing number of applications will use
some sort of video aspect in their services. Videoconferencing has been cited frequently as a major
example (Cisco, 2012), but past failures in predictions do not seem to have been taken fully into
consideration. Finally, audiovisual quality is expected to grow dramatically in the next years, with
enhancements such as high‐definition, 3D, and beyond.
Gaming
According to experts’ predictions (De Prato, Feijóo, Nepelski, Bogdanowicz, & Simon, 2010),
games will increasingly be played with mobile devices and from the cloud – online gaming. They will
also use increasingly more advanced graphics and controls, going from normal definition to high
definition and ultimately 3D graphics, and including augmented reality elements (Feijóo, Gómez‐
Barroso, Aguado, & Ramos, 2012). In fact, a survey from Information Solutions (2011), with both UK
played games on most often, 44% cited their phones, ahead of videogame consoles (21%) and
computers (30%). Also, smartphone owners were by far the most avid mobile gamers: 93% of
smartphone owners said that they played at least once each week, and 45% played daily. Regarding
global mobile gaming market prospects, the industry expects (Feijóo, 2012) that gaming on this
platform will double its value in the period up until 2015, with optimistic estimations for CAGR
ranging from 8 to 25%.
From a technical perspective, online gaming is the most demanding type, as gamers must
interact on a common visual scenario. This scenario can be locally generated while using some data
from a shared server, or it can be streamed over to the mobile device. In the second case, more data
rate demanding than the first, it would be equivalent to a video channel with resolution according to
game features.
eServices
eServices are an ample and not very well‐defined category that includes a range of services,
from eCommerce and ePayments to eHealth and eGov. The mobile versions of eServices are usually
introduced with an ‘m’ to distinguish them from their general online counterparts, for instance,
mCommerce, mPayments (or mBanking, a wider concept), mHealth, and mGov.
Regarding mCommerce, industry sources (Branding Brand) suggest that in 2014 half of all
online shop visits will be carried out via smartphones, and in 2015 this proportion will reach 60%.
Along the same lines, in 2015 consumers will spend a total of US$ B10 to 25 in sales via mobile
devices (Forrester, Coda Research, ABI Research), at least a fourfold increase compared to mobile
consumer expenditure in 2012.
mPayments are expected to double from 2012 to 2016 (Gartner, 2012), with near field
communication (NFC) technologies taking an increasingly relevant role (IE Market Research, 2011). In
2012, most mobile payments (about 75%) were carried out via SMS. Using the NFC technology, the
mobile device interacts with a receiving device nearby to fulfil the payment, therefore fucntioning as
a digital wallet. NFC will be enabled by mobile devices, adding up this functionality to 200 million
units in 2015, according to Yankee Group (2011).
mBanking is already a major success in many developing countries, where mobile devices and
mobile operators are commonplace and relatively reliable compared to other institutions. Market
analysts (IE Market Research, Gartner, Trueaxis) agree on their increasing relevant role globally, with
total predicted value of transactions amounting to US$ 900B in 2015.
mHealth has been defined as the way ‘to improve individuals’ health and well‐being by
and delivering just‐in‐time interventions, all in the user’s natural mobile environment’ (Kumar,
Nilsen, Pavel, & Srivastava, 2013). It is therefore a multifaceted service. For instance, already the use
of mobile devices by physicians, both to view patient information and to access non‐protected health
information, is widespread and has grown 15% in 2012 compared to 2011. Healthcare organisations
are also increasingly providing patients/consumers with access to mobile devices to promote
healthcare, a practice that has seen a 6% growth from 2011 to 2012. Remote patient monitoring
devices that are connected to healthcare organisations are also expected to experience considerable
growth, although from a purely mobile perspective the most interesting service is personal
(biometric) monitoring. This is a category of applications that has grown exponentially in the last
years, and includes sports, wellness, and lifestyle utilities.
mGov refers to the use of digital online public services through a mobile device. Until
recently, it was simply an alternative means of access to eGovernment services. However, mGov has
evolved and now includes the provision of public services that only make sense from a mobile device;
real‐time information about public transport is a paradigmatic example. According to main experts
(Misuraca, Broster, & Centeno, 2011), every scenario of the future eGovernment encompasses
mobile technologies that allow bridging real‐time mass collaboration tools with sensors, decision‐
support systems, and cloud computing algorithms (see below) for processing data and performing
statistical simulation and analysis.
From a technical perspective, most of the mServices are not very demanding in terms of
broadband – with the exception of some mHealth and mass‐collaboration mGov solutions – but
almost all require reliability and security in data transmission.
Cloud Computing
Cloud computing, the ability to remotely process information, is offered in several flavours:
software‐as‐a‐service (SaaS), platform (PaaS), or infrastructure (IaaS). SaaS in the mobile domain
means that the application runs mainly on some server accessed from the mobile device. This is the
most interesting case for mobile media, and in fact, market analyst Forrester Research forecast 80%
of revenues to deriver from SaaS. In PaaS the (business) processes are carried out in the server, while
IaaS is the mere capacity of processing and storing data.
Cloud computing is a convergent service in the sense of being agnostic to the type of network
/ device (fixed or mobile) used when accessing it. In fact, all major developers of cloud computing
services typically deploy software solutions adapted for both types of systems at the same time.
Expectations for cloud computing indicate that by 2016 each household will have 1.2 TB of data
Machine to Machine (M2M) and Internet of Things (IoT)
M2M has been cited frequently as the next engine for growth of mobile systems. In fact,
according to a summary report from the EIU (2012), in 2020 between 12 to 50 billion machines are
expected to be connected with each other, a 12‐ to 50‐fold growth from 2012. This network of
devices is usually called the Internet of Things, stressing the fact that it will be fully compatible and
accessible from the Internet. Accordingly, the Internet of Things (IoT) is forecast to reach 26 billion
installed units by 2020, up from 0.9 billion in 2015.
From a technical perspective, the data requirements of most M2M devices are limited, as
transmission is relatively infrequent and only conveys small amounts of data each time. However, the
expected number of M2M devices will be very large compared to traditional devices, therefore
having an aggregated impact on the network. To this regard, forecasts published by Cisco Systems
suggest that by 2017, roughly 5.1% of the total mobile traffic will be M2M‐related; at the same time,
it will constitute as much as 17% of the global number of mobile connections (Cisco, 2013).
From the perspective of personal consumers, M2M services will translate to a number of
applications, based on information provided by sensors and devices surrounding the user and
supplying highly valuable context information (Yndurain, Feijóo, Ramos, & Campo, 2010).
Big Data
Big data refers to datasets whose size is beyond the ability of typical database software tools
to manage and analyse. In practice, big data is linked to cloud computing – where the data is
processed – and to M2M, where most of the data comes from. Therefore, the same comments for
both cloud computing and M2M can be made here, that is to say, big data solutions will be agnostic
with regard to the type of access – fixed or mobile – while most of the data will originate wirelessly.
For a sense of perspective, industry analysts estimate (McKinsey, 2012) that a corporation of 1,000
employees has about 200 TB of stored data, and that the total data stored in companies amounts to
some tens of exabytes. Industry forecasts (Cisco, Gartner, McKinsey) put this figure into the
hundreds of exabytes in 2016.
Augmented Reality
Augmented reality consists of layers of information attached to physical reality and read
through smart devices (Feijóo, Pascu, Misuraca, & Lusoli, 2009). Augmented reality is intertwined
with a number of other services previously mentioned, such as gaming and different types of mobile
eServices. This new service is also triggering further innovation in new mobile devices, such as smart
revenues. For instance, market analyst Juniper Research (2012) forecasts the market to grow from
virtually non‐existent to M$ 800 in 2014.
3. A BASELINE OF REQUIREMENTS FOR NEXT GENERATION MOBILE NETWORKS
3.1. Scenarios of future demand of mobile users
Unfortunately, the overview of the industry sources of the above section does not provide a
coherent metric for the evolution of mobile services in terms of number of users, nor in terms of
intensity of usage, nor in the shape of specific technical requirements. Therefore, using the above
section as a departing point, it is necessary to build a more nuanced forecast of a baseline for service
evolution, to later be completed with some other alternative scenarios (sensitivity analysis) when
departing from the baseline.
In practical terms, the final goal is to predict the evolution of the data rate for an average
user. This baseline scenario is built from three main ingredients: (i) number of mobile broadband
subscribers; (ii) penetration (number of users) and evolution of technical requirements for each of
the services; and (iii) combined usage of services. Sub‐sections below explain the assumptions and
rationale for each of these elements, and Table 1 offers a summary of the main parameters used and
the results of the baseline.
Data from Spain have been chosen for the calculations. Spain is interesting as a case study,
for two main reasons: (i) it is a representative case for the EU in socio‐demographic terms, (ii) as of
the end of 2012, it is the market with the highest penetration of smartphones in the EU, and
therefore, a worst‐case scenario for network design. In any case, the results obtained with regard to
the behaviours of the demand are broadly applicable to developed countries.
Forecast of mobile broadband subscribers
The first step in the creation of a baseline for mobile services is the forecast of the evolution
of the number of mobile broadband subscribers. The model chosen is the diffusion of innovations
based on the logistic curve, linearised to apply ordinary least squares (OLS) in the estimation process,
see for instance Cauwels and Sornette (2012) for details on implementation. The model uses an s‐
shaped curve for the new adopters’ cumulative function, which asymptotically approaches a
saturation threshold that is typically determined exogenously. In this paper it has been implemented
in a two‐stage procedure: the forecast of the penetration of mobile technologies suitable for
broadband, and the forecast of the evolution of the penetration of smartphones and tablets with
The data set used to perform the first part of the calculations has been obtained from
Spanish National Regulatory Agency (CMT), using quarterly data on mobile penetration from 2005 to
2011. As the objective of the calculation is a long‐term forecast, seasonal adjustments – moving
average of order five – are used to smooth fluctuations. According to the predictions in the literature
(see for instance Jefferies, 2011), the market saturation for mobile penetration in Spain will be 130
mobile subscriptions per 100 inhabitants. For the second stage of the calculations, yearly market
data on the number of smartphones and tablets in Spain have been compiled from several industry
sources. These industry sources predict that the market saturation, that is, the number of mobile
devices that can access the broadband mobile network, will be 80% of the total market in 2020
(Jefferies, 2011). After the completion of both forecasting processes, the total demand for mobile
broadband subscribers is found by directly combining the smartphone market share and the total
number of forecasted mobile lines.
The case of M2M has been treated separately, again using CMT data. As the penetration is
still very limited, it has been preferred to use an exponential smoothing technique to provide direct
estimations of demand. This technique avoids establishing an a priori market penetration limit. The
exponential smoothing method uses a series of weights that give more emphasis to the most recent
data and decrease their relevance exponentially as they go back in time. Among the several
exponential smoothing techniques, the Holt‐Winters model has been chosen with non‐seasonal
exponential trend procedure (Stellwagen, 2012). The rationale is the assumption that M2M growth
will increase slightly each year within the period considered.
The case of mobile cloud computing has been also considered separately. Cloud computing
has been linked to companies’ smartphones, using data from Spain’s National Observatory of
Telecommunications and the Information Society, ONTSI. Since penetration in this segment is close
to the market saturation level, a non‐seasonal linear smoothing (Stellwagen, 2012) has been used for
the evolution of the market share of companies’ mobile subscribers.
Forecast of service evolution
Service evolution is based on two main parameters: number of users of the service under
consideration – that is, the percentage of penetration among mobile broadband potential demand –
and technical requirements.
Technical requirements for mobile services have been simplified into maximum data rates, in
Mbps. This is equivalent to focusing this article exclusively on the capacity of new mobile broadband
networks. The other main parameter left out with this assumption is latency, that is, the ability to
information. Control of this parameter would increase the complexity of the technical discussion, but
in the author’s opinion, will not change the fundamental implications from the baseline results.
Therefore, only those services from previous sections impacting on broadband have been selected
for further consideration, namely: web/social networks, audio/video, gaming, cloud computing,
M2M, and augmented reality. This same approach is used by ITU (2000) for the analysis of high
broadband services.
The forecast of the evolution of the number of users of each service is based again on a
simple logistic model that departs from the values collected from different surveys and studies within
the mobile industry, as discussed in the previous section. In the cases of cloud computing and
augmented reality, there were not enough values to enable the use of any diffusion model, so an
average of the forecast growth indicated by industry sources has been used instead.
The forecast of the evolution of the technical requirements for each of the services is based
on the discussion in the above section. Where there were no specific values, it has been supposed
that mobile requirements are similar to equivalent fixed services with a four year delay, as indicated
in Cave and Hatta (2008) or Noam (2011).
Demand results – Combined usage of mobile services
The next step in the model is the consideration of the simultaneous usage of mobile services
by mobile users. The simplest approach is used: the peak demand of users is built from adding the
data rates required for each of the services, weighted by the penetration of each of them. In this
way, penetration of the different services is used as a proxy for level of usage.
As a summary, and based on the industry forecasts discussed in a previous section, the
evolution of the baseline along the period considered can be understood as occurring in three stages.
The first takes place in 2013‐2015, where mobile broadband subscribers enjoy a combination of web
and social media in their smartphones; video of standard TV quality, mainly through tablet devices;
options to download and upload some content from limited‐scope cloud computing services; options
to play online games both through tablet and smartphone; there are also some very basic M2M
services. The second stage happens from 2016 to 2018 and adds to the above: HDTV in tablets,
advanced online games through tablet and smartphone, and usage of simple augmented reality
applications. The third stage starts in 2019 and includes ultra HDTV (possibly 3D), as well as more
advanced M2M applications and augmented reality.
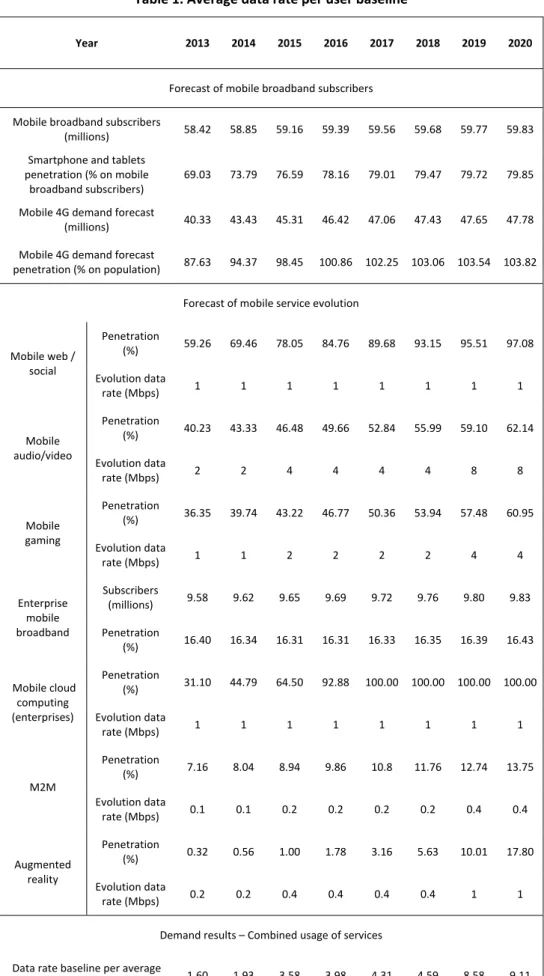
Table 1. Average data rate per user baseline
Year 2013 2014 2015 2016 2017 2018 2019 2020
Forecast of mobile broadband subscribers
Mobile broadband subscribers
(millions) 58.42 58.85 59.16 59.39 59.56 59.68 59.77 59.83
Smartphone and tablets
penetration (% on mobile
broadband subscribers)
69.03 73.79 76.59 78.16 79.01 79.47 79.72 79.85
Mobile 4G demand forecast
(millions) 40.33 43.43 45.31 46.42 47.06 47.43 47.65 47.78
Mobile 4G demand forecast
penetration (% on population) 87.63 94.37 98.45 100.86 102.25 103.06 103.54 103.82
Forecast of mobile service evolution
Penetration
(%) 59.26 69.46 78.05 84.76 89.68 93.15 95.51 97.08
Mobile web /
social
Evolution data
rate (Mbps) 1 1 1 1 1 1 1 1
Penetration
(%) 40.23 43.33 46.48 49.66 52.84 55.99 59.10 62.14
Mobile
audio/video
Evolution data
rate (Mbps) 2 2 4 4 4 4 8 8
Penetration
(%) 36.35 39.74 43.22 46.77 50.36 53.94 57.48 60.95
Mobile
gaming
Evolution data
rate (Mbps) 1 1 2 2 2 2 4 4
Subscribers
(millions) 9.58 9.62 9.65 9.69 9.72 9.76 9.80 9.83
Enterprise
mobile
broadband Penetration
(%) 16.40 16.34 16.31 16.31 16.33 16.35 16.39 16.43
Penetration
(%) 31.10 44.79 64.50 92.88 100.00 100.00 100.00 100.00 Mobile cloud
computing
(enterprises) Evolution data
rate (Mbps) 1 1 1 1 1 1 1 1
Penetration
(%) 7.16 8.04 8.94 9.86 10.8 11.76 12.74 13.75
M2M
Evolution data
rate (Mbps) 0.1 0.1 0.2 0.2 0.2 0.2 0.4 0.4
Penetration
(%) 0.32 0.56 1.00 1.78 3.16 5.63 10.01 17.80
Augmented
reality
Evolution data
rate (Mbps) 0.2 0.2 0.4 0.4 0.4 0.4 1 1
Demand results – Combined usage of services
Data rate baseline per average
user (Mbps) 1.60 1.93 3.58 3.98 4.31 4.59 8.58 9.11
Alternative demand scenarios
Departing from the user demand baseline, it is possible to build alternative scenarios. Table 2
displays a summary of these, including main assumptions and results. Five alternative scenarios have
been considered, four of them exploring changes in the assumptions on specific mobile services, and
a fifth to account for general economic evolution. The first supposes that video usage in mobile
devices demands higher levels of quality. This could be, for instance, due to the usage of pico‐
projectors in smartphones or tablets. The second alternative scenario relates to cloud computing,
and assumes that not only do companies use this service but also subscribers at large, with a four‐
year delay regarding professional usage. The third sensitivity analysis refers to a much more
aggressive uptake of M2M services and a more intensive usage. The fourth scenario is based on a
massive success of augmented reality services. The usage of wearable devices, such as glasses, might
be an example. The fifth is a grey scenario assuming an economic stagnation that delays both the
deployment and adoption of mobile broadband, reaching the baseline objectives of 80% of
penetration in 2030 instead of 2020.
Table 2. Mobile user demand alternative scenarios
Year 2013 2014 2015 2016 2017 2018 2019 2020
Scenario video
Evolution data rate
mobile audio/video
(Mbps)
2 2 4 4 8 8 16 16
Data rate baseline
change (%) 0% 0% 0% 0% 49.63% 49.75% 56.70% 56.37%
Scenario cloud computing
Penetration mobile
cloud computing (%) 7.23 10.42 15.00 21.60 31.10 44.79 64.50 92.88
Data rate baseline
change (%) 3.92% 5.04% 4.09% 5.41% 7.30% 9.95% 7.73% 10.53%
Scenario M2M
Penetration M2M (%) 7.31 8.51 9.91 11.54 13.44 15.65 18.23 21.22
Evolution data rate
M2M (Mbps) 0.1 0.25 0.25 0.5 0.5 1 1 2
Data rate baseline
change (%) 0.01% 0.64% 0.19% 0.95% 1.07% 2.95% 1.58% 4.19%
Scenario augmented reality
Penetration
augmented reality
(%)
Data rate baseline
change (%) 0.02% 0.04% 0.13% 0.30% 0.68% 1.50% 4.65% 9.32%
Scenario economic stagnation
Penetration of mobile
broadband (%) 66.78 69.77 72.16 74.04 75.50 76.62 77.47 78.11
Data rate baseline
change (%) ‐3.13% ‐5.19% ‐5.57% ‐5.02% ‐4.23% ‐3.42% ‐2.75% ‐2.13%
3.2. Scenario for the supply of Next Generation Mobile Networks
In order to create a baseline for the evolution of technical parameters that define how
NGMNs are deployed, a network architecture needs to be designed. This article considers the market
winner NGMN technology – Long Term Evolution (LTE) – as the specific choice for the deployment of
the infrastructure part of NGMN.
From an engineering point of view, and once the architecture is defined, the actual network
design combines the information from the previous section: the distribution of data traffic per user,
the quality of service (QoS), the technical state of the art (spectral efficiency), and policy decisions –
basically the frequency of operation of the network and the amount of spectrum bandwidth
allocated to the operator. From these four basic parameters it is possible to estimate the average
number of users per coverage cell in the mobile network. This paper stops at this point, as this is
considered enough to understand the impact of data rates per user, QoS, and diverse technical
features and policy decisions. Beyond these initial calculations, the full design of the network would
carry on using the specific socio‐demographic characteristics of the geographical area aimed at for
coverage, establishing the number and location of base stations and other equipment, and from
here, calculating figures on investments and operating expenses.
Data rates per user are specified in terms of the quality of service (QoS), expressed in terms
of the period of time that users are guaranteed a given data rate ,or alternatively, in terms of the
number of users that can be served simultaneously at a given data rate. The QoS is arguably the
design parameter that most affects the deployment of a network. In the model, the initial data rate
in the period examined per subscriber is set at 1 Mbps. This reference value meets the needs for data
applications with higher resource demands, as of 2013 (Radio, Ying, Tatipamula, & Madisetti, 2012).
From here, it has been supposed that it will slowly evolve over time towards a similar pattern to that
of fixed networks (see Table 3).
The spectral efficiency determines the capacity of each unit of frequency in the allocated
Hertz. A typical peak value for the spectral efficiency in LTE is 15 bps/Hz (IDATE, 2012), although
average values are a third of this value (Raychaudhuri & Mandayam, 2012). The spectral efficiency
depends in turn on technology and vendor‐dependent parameters, such as the number of sectors
and the number of channels for data transmission that are available at a given base station. The
numbers of channels and sectors depend on the antenna configurations at the base stations. The
model considers a typical LTE configuration, consisting of 3 sectors (each covering a 120º angle) and
a 2x2 or 4x4 MIMO channel configuration.
The spectrum bandwidth and the frequency of operation allocated to the operator influence
both the coverage and the total throughput of the cell: the higher the bandwidth, the higher the
throughput of the base station; and the lower the frequency of operation, the greater the coverage.
In fact, the cell coverage is delimited by the lesser of these two components. The first component is
the maximum number of users per cell that complies with QoS requirements. This limitation varies
inversely with the adoption rate and the population density. The second factor is based on signal
transmission losses; beyond a certain distance, the signal is compromised and contains excessive
error. The theoretical maximum coverage radius for mobile communications at low frequencies
would reach up to 50 km (Astely et al., 2009; Furuskar, Jing, Blomgren, & Skillermark, 2011).
However, this value diminishes to just a few km in areas of high building clustering or complex
orography, where the combination of diffraction and multipath interference significantly increases
signal losses and errors. The first limiting component, QoS, usually occurs in high (urban) and
medium (suburban) population density zones, while the second limiting factor is typical of low
population (rural) density zones. For these reasons, lower operation frequencies (such as those
resulting from the digital dividend) do not necessarily increase network coverage if QoS is the limiting
factor. In the model, the bandwidth allocation is 20 MHz, which is currently the typical value for
commercial LTE operation (IDATE, 2012). Finally, only a part of the total spectrum bandwidth
available is usable, since it is necessary to dedicate part of it to transmit error correction codes and
control channels. A typical value of the effective bandwidth is 60% of the total (Mogensen et al.,
2007), a value not expected to change over time within the considered period. To summarise in the
baseline developed in this paper (see Table 3), the size of the cell due to limitations in QoS is
presented for five different types of areas: extreme urban, urban, suburban, rural, and extreme rural.
As a final remark, it should be noted that this article does not consider technical
3.3. Overall results – A baseline of service requirements for NGMN
The first part of Table 3 assumes the average data rate per user obtained in sub‐section 3.1.
The second part presents a summary of the evolution of the technical parameters, as discussed in the
previous sub‐section. The result of their combination, in terms of a baseline for base station
throughput and for the number of subscribers served within one cell, is presented at the bottom of
Table 3.
Table 3. Service requirements baseline
Year 2013 2014 2015 2016 2017 2018 2019 2020
Evolution of demand
Guaranteed data rate
baseline required per
average user (Mbps)
1.60 1.93 3.58 3.98 4.31 4.59 8.58 9.11
Evolution of technical features
QoS (% of data rate
available over time) 2 2 5 5 10 10 20 20
Bandwidth allocated
to the operator
(MHz)
20 20 20 40 40 40 40 60
Spectral efficiency
(b/s/Hz) 2 2 3 3 4 4 5 5
Base station –MIMO
configuration 3 sectors 2x2 MIMO 3 sectors 2x2 MIMO 3 sectors 4x4 MIMO 3 sectors 4x4 MIMO 3 sectors 4x4 MIMO 3 sectors 4x4 MIMO 3 sectors 8x8 MIMO 3 sectors 8x8 MIMO
Base station max.
throughput 240 240 720 1440 1920 1920 4800 7200
Service requirements for Next Generation Mobile Networks
Max. number of
users per cell 4500 3731 2413 4342 2673 2510 1678 2371
Radius of cell for ext.
urban areas (5000
inh/km2) in km
0.57 0.50 0.40 0.52 0.41 0.39 0.32 0.38
Radius of cell for
urban areas (1000
inh/km2) in km
1.28 1.12 0.88 1.17 0.91 0.88 0.72 0.85
Radius of cell for
suburban areas (500
inh/km2) in km
1.81 1.59 1.25 1.66 1.29 1.25 1.02 1.21
Radius of cell for
rural areas (50
inh/km2
) in km
5.72 5.02 3.95 5.23 4.08 3.94 3.21 3.81
Radius of cell for ext.
rural areas (10
inh/km2
) in km
12.79 11.22 8.83 11.71 9.12 8.80 7.18 8.53
Sensitivity analysis
As in the case of mobile usage, it is worthy to consider some alternative scenarios and their
impact on the amount of users that can be served within a cell. Table 2 displays a summary of these,
including main assumptions and results. The first scenario explores the lack of improvements of QoS,
which are basically considered to stay at current levels with a slight improvement at the second part
of the period. The second scenario is exactly the opposite, examining the influence of fully
anticipating consumers’ demands for mobile media and thus guaranteeing data rates at all times. The
third displays a situation where there are no improvements in bandwidth allocated to operators. The
final scenario summarises the effect of the lack of technical improvements through the spectral
efficiency parameter, which is supposed to be enhanced at a much slower pace than in the baseline.
Table 4. Technical requirements alternative scenarios
Year 2013 2014 2015 2016 2017 2018 2019 2020
Scenario limited QoS
Evolution of QoS (%) 1 1 1 1 2 2 2 2
Max. number of
users per cell
baseline change (%)
100% 100% 400% 400% 400% 400% 900% 900%
Scenario max. QoS
Evolution of QoS (%) 100 100 100 100 100 100 100 100
Max. number of
users per cell
baseline change (%)
‐98% ‐98% ‐95% ‐95% ‐90% ‐90% ‐80% ‐80%
Scenario limited bandwidth
Bandwidth allocated
to operators (MHz) 20 20 20 20 20 20 20 20
Max. number of
users per cell
baseline change (%)
0% 0% 0% ‐50% ‐50% ‐50% ‐50% ‐66.6%
Scenario technological stagnation
Spectral efficiency
(b/s/Hz) 1.4 1.4 1.4 2 2 2 2 2
Max. number of
users per cell
baseline change (%)
‐30% ‐30% ‐33.3% ‐33.3% ‐50% ‐50% ‐60% ‐60%
4. DISCUSSION OF RESULTS
The first and most important element for discussion is the data rates obtained in the
baseline. The figures show an average annual growth of 31% in the period considered. This is slightly
more conservative than those of existing industry forecasts. In fact, according to industry analysts,
mobile data traffic is expected to grow at rates of more than 50% until 2020, increasing from 1.3
EB/month in 2012 to approximately 40 EB/month (Jefferies, 2011). Also, according to Ericsson
(2014a), mobile data traffic already exceeded 2 EB/month at the end of 2013, with a growth of 70%
year‐on‐year.
The data rates in the baseline are relatively similar to those apparently available for mobile
broadband consumers in diverse practical situations. In a survey of 77 mobile operators in 3Q 2013,
it was found that average connection speeds ranged from 9.5 Mb/s to just 0.6 Mb/s – with the mean
value of the distribution in the range of 2 to 3 Mb/s – while average peak connection speeds ranged
from 49.8 Mb/s down to 2.4 Mb/s (Akamai, 2013). Values in the baseline are again slightly more
conservative than those of existing industry forecasts.
In any case, QoS is precisely the parameter that explains the differences between guaranteed
(minimum) speeds and other situations. According to the baseline, and taking for instance the 2014
values, there would be only a 2% guarantee of satisfaction of the expectations of mobile media
consumers at the peak (maximum congestion) time, or equivalently, only 1 in 50 customers would
have their expectations fulfilled at that moment. Even supposing that the above surveys represent
the real situation and maintain the rest of the baseline assumptions, it would mean a 2.5%
probability of achieving the maximum data rate, or on average, satisfying 1 in 40 mobile media
consumers at peak time.
In fact, lack of QoS is arguably the main source of frustration for mobile media consumers.
Considering again 2014, and assuming that investments are proportional to the number of users per
cell, fully satisfying users’ expectations at any time would mean multiplying the level of investments
by 40 (for the surveys above) or by 50 (for the baseline scenario). If a more realistic situation with a
QoS of 10% is considered, it would imply quadruple investments (surveys data) or quintuple
investments (baseline data). This same idea is reflected in the evolution of the investments, simply to
keep pace with users expectations while increasing QoS according to the baseline assumptions. In
this case, it would be necessary to increase investments by a factor of about two from 2014 to 2020,
in those areas where QoS is the limiting factor (at least in urban and suburban areas), an indication of
the formidable challenge confronted by mobile operators, as even with the technology deployed, it
demands, as discussed below. In fact, it is rather unclear how this considerable effort on the side of
mobile operators would be achieved in a relatively flat or slightly declining mobile. An easy and
tempting solution would be to keep QoS at existing levels. This would save investments; however,
although the price to be paid in terms of consumers’ dissatisfaction, decrease of the overall utility,
and lack of innovations that could make use of a better guarantee in data rates is difficult to
evaluate, it nevertheless appears to be considerably negative.
The combined effect of the increase of data rates and QoS results in a large reduction of the
number of subscribers served by a single coverage cell – it decreases on average by a factor of 2
along the considered period. Apart from the direct effects on investments in the number of base
stations, it also implies that a much denser pattern of base station should be deployed. For instance,
in urban areas, the size of the radius of a coverage cell would go down to some hundreds of metres
from its current radius of 2 to 3 km. These base stations, in addition, would manage a much larger
amount of data traffic – the throughput – and therefore, new fibre cabling would be needed to
connect new sites to the backbone network in order to transport data further. These fibres are not
deployed yet in general and thus, in a relative contradiction, mobile operators will be the most avid
users – and/or deployers – of fibre in the next years. As an illustrative example, the number of sites
required in a metropolis such as Madrid municipality (average population density of 5300 inh/km2)
would increase from about 250 in 2012 to more than 1300 in 2020.
QoS will also be, increasingly, the limiting factor in NGMN deployments. For instance, in rural
areas, the size of the cell would go down from about 6 km in 2013 to about 4 km in 2020. Therefore,
in spite of acknowledging the role of mobile broadband as the only economically feasible solution in
terms of NGN deployment in rural regions, these results imply that considerable investments would
be needed in the deployment of new cells, in addition to the replacement of existing sites with new
4G technologies. These results also entail that lower frequencies of operation of mobile networks
would reduce investments only for a limited number of years – before QoS becomes the limiting
factor – in rural areas with low density of population. Therefore, in the long term, lower frequencies
of operation of mobile networks would only be essential for better coverage indoors and in areas of
high clustering of buildings – therefore saving in equipment to fill coverage gaps – and in rural areas
with extremely low density of population.
Policy decisions and technical developments also have a deep impact on the level of
investments required, contributing decisively to the potential profitability of NGMN and to the
satisfaction of users’ demands. For instance, not enjoying additional spectrum at all in 2020 would
imply an increase of investments of 300% with regard to the baseline situation, or, translated in
obvious and critical role for spectrum regulation in contributing to the development of mobile media
beyond the current standards. A very similar situation takes place with technical developments. The
improvements in spectral efficiency in 2020 would translate to investment savings of 250%,
compared with a situation where these improvements do not happen at the baseline pace. Again,
this could be translated as a decrease of QoS to just 8%, to compensate for the difference in network
investments.
From the perspective of consumer behaviour on mobile media, video appears to be the most
relevant factor. For instance, if the alternative scenario where video requires a much higher quality in
2020 is considered, it would translate into a 56% increase of investments. This would notoriously
enlarge the existing gap between the growth in mobile data traffic – mostly driven by video – and the
revenues that mobile operators extract from it, thus increasing, in turn, the pressure to either slow
the pace of investments in access network capacity, create tariffs that adapt better to the use of
resources from the network, arrive at agreements for sharing revenues with OTT providers, or any
combination of them. None of these potential remedies is void of formidable challenges, and to date
there is nothing like a unified approach to the issue.
Continuing with possible disruptions in user adoption of mobile services, the next most
broadband‐demanding services appear to be cloud computing and variations in the adoption of
augmented reality. As indicated in the alternative scenarios, both would need about a 10% increase
in network investments, should they follow these other roadmaps of adoption.
Finally, it should be noted that the baseline is relatively robust to changes in the assumptions
on the adoption of mobile broadband in general. This is due to the already high levels of penetration
of mobile technologies in general, and signals that only catastrophic scenarios would depart
significantly from the baseline in this particular aspect. They also show that the fundamental driver
for mobile media adoption is already present in the period considered: a mobile broadband
subscriber armed with smartphones and tablets, eager to obtain ubiquitous access to new and
appealing services and applications.
5. CONCLUSIONS
In fostering a discussion about the mobile media future and its implications for NGMN, this
article has introduced a number of scenarios for the evolution of mobile services and networks. The
resulting baseline hints at both technological, strategic and policy enhancements that could be
implemented to increase the chances of further developments in mobile media. The baseline can
network architectures, or convergence with fixed networks. Note also that the authors are well
aware of the high number of assumptions required to build even such a rough baseline for the
evolution of mobile media and networks; therefore, great care has been used to specify each of the
assumptions in order to facilitate ease of replicability, reviews and modifications.
Reading the results collectively, some general panorama for mobile media can be depicted.
Its most distinctive feature is that, with the arrival of NGMN, the mobile industry’s traditional
virtuous cycle of investment, innovation, and adoption of services has been broken, substituted with
a cycle that runs in the opposite direction. Now it is the innovation and adoption of services by users
which require investments from mobile operators, although these will not necessarily accrue to
facilitate an increase in operators’ revenues. Both forces will remain strong during the period
considered, fuelled by mobile media’s notorious utility for mobile broadband consumers and their
established habits. Therefore, the pressure on operators, to conduct the required investments and to
increase both data rates and QoS, will only intensify. A part of this pressure will be transferred to the
search for business models linked more directly with the use of network resources, either by
consumers or by any other party. Another part of this pressure would be translated to policymakers,
as, in a particular spectrum, the bandwidth would considerably decrease the investments required
or, alternatively, increase the data rates and/or QoS offered to mobile users.
REFERENCES
Akamai. (2013). The state of the Internet, 3rd quarter, 2013 report. Retrieved from
http://www.akamai.com/dl/akamai/akamai‐soti‐q313.pdf?WT.mc_id=soti_Q313
Cauwels, P., & Sornette, D. (2012). Quis pendit ipsa pretia: Facebook valuation and diagnostic of a
bubble based on nonlinear demographic dynamics. Journal of Portfolio Management, 38(2), 56– 66. doi:10.3905/jpm.2012.38.2.056
Cave, M., & Hatta, K. (2008). Universal service obligations and spectrum policy. Info, 10(5‐6), 59–69.
Cisco. (2012). Cisco visual networking index: Service adoption forecast 2011‐2016.
Cisco. (2013). Cisco visual networking index: Global mobile data.
Coomonte, R., Feijóo, C., Ramos, S., & Gómez‐Barroso, J. L. (2013). How much energy will your NGN
consume? A model for energy consumption in next generation access networks: The case of
Spain. Telecommunications Policy, 37(10), 981–1003. doi:10.1016/j.telpol.2013.09.002
De Prato, G., Feijóo, C., Nepelski, D., Bogdanowicz, M., & Simon, J. P. (2010). Born digital / grown
digital: Assessing the future competitiveness of the EU video games software industry. JRC
Scientific and Technical Reports. Luxembourg: Publication Office of the European Union:
Economist Intelligence Unit. (2012). Rise of the machines: Moving from hype to reality in the
burgeoning market for machine‐to‐machine communication.
Ericsson. (2012). Traffic and market report: On the pulse of the networked society. Stockholm.
Ericsson. (2014a). Ericsson mobility report. Updated Feb 2014.
Ericsson. (2014b). Media Vision 2020: A vision of the Television Future. Retrieved from
http://www.ericsson.com/televisionary/static/pdf/MediaVision‐Brochure‐RevA.pdf
Feijóo, C. (2012). An exploration of the mobile gaming ecosystem from developers’ perspective. In P.
Zackariasson (Ed.), The video game industry: Formation, present state, and future (pp. 76–95).
New York & London: Routledge.
Feijóo, C., Gómez‐Barroso, J. L., Aguado, J. M., & Ramos, S. (2012). Mobile gaming: Industry
challenges and policy implications. Telecommunications Policy, 36, 212–221.
doi:10.1016/j.telpol.2011.12.004
Feijóo, C., & Gómez‐Barroso, J. L. (2013). El despliegue de redes de acceso ultrarrápidas: Un análisis
prospectivo de los límites de mercado. Papeles de Economía Española, (136), 116–129.
Feijóo, C., Gómez‐Barroso, J. L., & Ramos, S. (2011). An analysis of Next Generation Access Network
deployment in rural areas. 50th FITCE Congress, Palermo, Italy.
Feijóo, C., Maghiros, I., Abadie, F., & Gómez‐Barroso, J. L. (2009). Exploring a heterogeneous and
fragmented digital ecosystem: Mobile content. Telematics & Informatics, 26(3), 282–292.
doi:doi:10.1016/j.tele.2008.11.009
Feijóo, C., Pascu, C., Misuraca, G., & Lusoli, W. (2009). The next paradigm shift in the mobile
ecosystem: Mobile social computing and the increasing relevance of users. Communications &
Strategies, (75), 57–78.
Gartner. (2012). Forecast: Mobile payment, worldwide, 2009‐2016.
Gummerus, J., & Pihlström, M. (2011). Context and mobile services’ value‐in‐use. Journal of Retailing
and Consumer Services, 18(6), 521–533.
Humphreys, L., Von Pape, T., & Karnowski, V. (2013). Evolving mobile media: Uses and
conceptualizations of the mobile Internet. Journal of Computer‐Mediated Communication,
18(4), 491–507.
ITU. (2000). Recommendation ITU‐R M.1079‐2. Performance and quality of service requirements for
International Mobile Telecommunications‐2000 (IMT‐2000) access networks.
Jefferies. (2011). Mobility 2020: How an increasingly mobile world will transform TMT business
models over the coming decade.
Kumar, S., Nilsen, W., Pavel, M., & Srivastava, M. (2013). Mobile health: Revolutionizing healthcare
Misuraca, G., Broster, D., & Centeno, C. (2011). Digital Europe 2030: Designing scenarios for ICT in
future governance and policy making. Government Information Quarterly, (10).
doi:10.1016/j.giq.2011.08.006
Mogensen, P., Na, W., Kovács, I. Z., Frederiksen, F., Pokhariyal, A., Pedersen, K. I., … Kuusela, M.
(2007). LTE capacity compared to the Shannon bound. In Vehicular Technology Conference,
2007. VTC2007 (pp. 1234–1238).
Noam, E. M. (2011). Let them eat cellphones: Why mobile wireless is no solution for broadband.
Journal of Information Policy, 1, 470–485. Retrieved from
http://jip.vmhost.psu.edu/ojs/index.php/jip/article/view/64/43
Stellwagen, Eric. (2012). Exponential smoothing: The workhorse of business forecasting. Foresight,
(Fall), 23–28.
Telecomspace. (2012). SMS will remain more popular than mobile messaging apps over next five
years. Retrieved from http://www.telecomspace.com/content/sms‐will‐remain‐more‐popular‐
than‐mobile‐messaging‐apps‐over‐next‐five‐years‐informa
UMTS Forum. (2011). Mobile traffic forecasts: 2010‐2020 report. UMTS Forum Report 44.