Flammability properties of thermally dried sewage sludge
Nieves Fernandez-Anez a,*, Javier Garcia-Tarrent a,b, Ljiljana Medic-Pejic a aDepartment of Chemical Engineering and Fuels (UPM Technical University of Madrid, Spain), CjAlenza4,28003 Madrid, Spain
bLaboratorio Oficial Madariaga, LOM (UPM Technical University of Madrid, Spain), CjEric [(andel,1 - (TECNOCETAFE), Parque CientíficoyTecnológicodela UPM, Cetafe, 28906 Madrid, Spain
HIGHLIGHTS
• Flammability parameters of sludge are presented.
• Relationships between chemical and flammability properties of sludge are analyzed. • Physical and chemical properties of sludge dusts affects their explosibility. • Seasons and origins of sludge should lead to a differentiation among samples.
ABSTRACT
The treatment and disposal of sewage sludge is becoming an urgent need whereby different technologies were developed and integrated into the waste cycle all over the world. One ofthe most used technologies is the thermal drying ofthe sludge. Thermally dried sewage sludge has interesting properties that allow its use as an alternative fue!, but also needs some consideration from the point of view of its safe operation.
The aim ofthis study was the research on the flammability properties of sewage sludge, including igni-tion sensitivity, explosion severity, thermal sensitivity and thermal stability. Furthermore relaigni-tionships among those properties and composition parameters have been determined, added to the study of their variation depending on their origin or season. Finally, properties related to spontaneous combustion were determined. To study these relationships and characteristics sludge samples were selected from different locations in Spain and taken during different seasons.
1. Introduetion
Due to the arise of consumption and the need to preserve water as an essential resource of Jife, there has been an increase of the existing wastewater treatment plants (WWTP) in order to collect the wastewater from a population or industry and, after a series of treatments and processes, return it to a receiving stream [1,2].
Actually, many actions are being carried out focused on the reuse of the waste produced by these WWTP [3]. ane of the most developed reusing methods is thermal drying. Ihis is an attractive alternative and it also provides the opportunity for an economical resource recovery [4]. Actually, thermal drying of sewage sludge is the most common method used in 2 countries of the 27 forming the EU members, a common method on 12 countries and arare method in 1 country [5].
*
Corresponding author. Te!.:+34 91 33641 73;fax:+34 91 3366948.E-mailaddress:[email protected](N.Fernandez-Anez).
Most occupational hazards in wastewater treatment, including methane production, are well known [6]. Focusing on the thermal drying process, there is a general risk understudied that produces serious consequences: the risk of generation of explosive atmo-spheres (AIEX) caused by dusts and a possible consequent explo-sion [7]. Ihis risk is present in all the industrial plants, and may be well studied to avoid accidents [8].
Dust generated in the thermal drying of sewage sludge is a fuel product [9] and it can produce an explosion due to the chemical reaction: fu el+oxygen=oxides+heat [10].
2.1. Test procedures
Table2
Properties determined and European Standards followed to determine.
(explosibility) or limiting oxygen concentration. Table 2 shows the European Standards followed to determine them.
Thermal susceptibility analyses are less-known in terms of the lack of standardized procedures. They consist of thermogravimet-ric analysis (TG), differential scanning calorimetthermogravimet-ric analysis (OSC), Maciejasz Index (MI), characteristic temperature(Tcharact)and vol-atiles emission temperature (TEV).
Finally thermal stability can be explained in terms of the ten-dency to self-heating. There are standard methods intended to the c1assification of goods for transportation, according to the ONU-N4 Oivision 4.2, or intended to the determination of the self-ignition temperature (TSI), according to EN 15188.
In thermogravimetric analysis (TG) the weight of the sample is measured as a function of its temperature when heated following a programmed heating rateo Fig. 1 shows a typical TG plot, with the derivative curve dTG superimposed, where some significant parameters can be defined, such as the combustion induction tem-perature (lT) and the maximum weight1055temperature (MLT).
In the case of Oifferential Scanning Calorimetry (OSC) the sample is heated at a regular rate, previously established and a ref-erence inert product is placed in another crucible. The diffref-erence in temperature between the sample and the reference is measured and recorded against the temperature of the oven and the exchanges of heat in the sample are determined. Fig. 2 shows a typical OSC record. The parameters used to characterize different substances are the minimum temperature at which the exothermic reaction begins (initial temperature, IET), the maximum tempera-ture reached during the exothermic reaction (final temperatempera-ture, FET) and the temperature at which the fast exothermic reaction commences (change of slope temperature, CST).
The characteristic temperature(Tcharact) [27] is determined by thermogravimetric tests adding an oxygen stream. The oxygen accelerates the oxidation process so that the sample suffers a sudden1055of weight. This1055happens at a different characteris-tic temperature for each sample, the lower the temperature, the higher thermal susceptibility to oxidation. According to this parameter samples can be c1assified by its self-ignition risk [28].
Maciejasz Index (MI) measures the required time(t)to produce a temperature increase of 65 K in the sample, when it is attacked by hydrogen peroxide. The Maciejasz index is calculated as
MI=100ft.ltdetermines the susceptibility to the self-combustion
due to the oxidation of some compounds in the substance that show avidity to react with oxygen, for instance pyrites in coals. This method is frequently used for coals, especially when their sulfur content is high.
The ignition temperature of emitted volatile matter (TEV) can be considered as a kind of flash point for solids. When a sample
EN 15104 EN 14775 EN 15148 EN 14774 EN 50281-2-1
EN 14034-3 EN 13821 EN 14034-1 EN 14034-2 EN 14034-4 European Standard
Elemental analysis (C. H. N) Ash content
Volatiles content Humidity
Minimum ignition temperature (layer: MITl. cloud: MITc)
Lower explosion limit (LEL) Minimum ignition energy (MIE) Maximum explosion pressure (Pmax) Dust specific constant (Kmax) Limiting oxygen concentration (LOC) Property
2. Materials and methods
Table 1
Collected samples.
Sample Origin Sea son dIO (Jlm) d50(Jlm) d90(Jlm)
LRET-I0l Barcelona Summer 15.4 67.9 355.3 LRET-I02 Barcelona Summer 111.9 339.5 815.8 LRET-I03 Barcelona Winter 23.4 100.4 289.2
LRET-I04 Madrid Summer 96.7 382.2 818.6
LRET-I05 Madrid Summer 88.6 397.2 844.1
LRET-I06 Madrid Summer 13.2 77.7 371.2
LRET-I07 Madrid Winter 69.2 385.9 853.9
LRET-I08 Madrid Winter 10.9 30.2 160.5
LRET-II0 Madrid Winter 88.2 382.5 839.7
LRET-lll Madrid Winter 10.3 43.0 383.9
LRET-112 Málaga Winter 7.5 27.3 62.2
LRET-l13 Málaga Winter 81.3 517.6 1150.7
LRET-114 Barcelona Summer 69.7 298.9 664.3 LRET-115 Barcelona Summer 152.3 492.5 1098.7 LRET-116 Barcelona Winter 52.3 531.6 1218.2 LRET-117 Barcelona Winter 34.1 74.4 348.3
LRET-118 Madrid Winter 7.4 20.6 178.9
LRET-119 Madrid Winter 110.3 214.4 653.5
LRET-120 Barcelona Winter 3.5 19.9 75.2
LRET-121 Madrid Summer 32.1 286.3 919.7
First of all, it is necessary to take into account the chemical com-position of the sewage sludge. This chemical comcom-position varies among different samples but it is always formed by organic matter, inorganic matter and gases [17] and approximately 75% of sus-pended solids and 40% of filterable solids are organic in nature [18]. As an example of the influence of the chemical composition in the explosibility of dusts, it is shown that the inorganic matter of coal has a negative correlation with the self-heating rate [19].
Other relations that are observed in other substances are those existing among different flammability parameters and the partic1e size distribution and concentration [20,21], the humidity [22] and the dustiness [23].
All these parameters depend on the sewage sludge studied, and some seasonal and time variability of the composition differences are shown in various studies [24,25].
The aim of this paper is to determine the relations among differ-ent explosibility parameters and also among them and the chemi-cal parameters to try to avoid these risks. AIso the variability due to seasonal and geographical parameters is studied. Finally, the self-heating of sewage sludge is studied, since this product may be stored for long periods and self-ignition temperature is an impor-tant parameter [26].
Twenty sewage sludge thermally dried samples have been stud-ied. Those samples have been chosen in order to study seasonal and regional variations, so the samples come from different places and also from different seasons. The samples have been collected in eight WWTP belonging to three regions in Spain: Barcelona, Madrid and Málaga. According to the season when the samples have been collected, they are c1assified in summer samples or win-ter samples. If the samples have been collected between May and September, they are c1assified as summer samples. Otherwise, they have been c1assified as winter samples. The samples collected are detailed in Table 1.
For all the samples, ultimate and proximate analyses have been conducted and granulometry have been determined. Oepending on the results of these tests, ten samples have been selected to develop the ignition sensibility, explosion severity and thermal susceptibility analyses. Finally, due to these results the thermal stability analyses have been done to three samples.
Fig. 2. Differentia1 scanning ca10rimetry record. Fig. 1. Thermogravimetric ana1ysis p1ot.
Table 3 (hemica1 ana1yses.
Samp1e U1timate ana1ysis (wt%) Proximate ana1ysis (wt%)
( H N Asha Moisture Vo1atilesa
LRET-I0l 37.43 4.91 3.01 0.61 32.20 6.10 62.30 LRET-I02 28.48 3.56 2.96 0.84 48.10 2.70 52.50 LRET-I03 33.72 4.94 5.00 1.63 43.90 11.10 59.90 LRET-I04 34.72 4.70 4.46 1.24 44.80 4.80 54.40 LRET-I05 35.76 4.74 4.52 1.31 45.00 6.50 53.50 LRET-I06 33.83 4.52 4.75 1.61 45.00 7.80 52.90 LRET-I07 31.90 4.77 5.01 1.21 41.70 5.60 55.40 LRET-I08 29.57 4.45 4.70 1.31 46.10 7.10 54.60 LRET-II0 31.73 4.69 4.89 1.14 41.80 4.40 57.80 LRET-lll 30.23 4.50 4.83 1.49 44.30 6.20 54.20 LRET-112 36.13 5.19 4.51 4.90 37.10 5.70 62.30 LRET-l13 34.72 4.96 5.13 2.24 38.10 3.00 60.40 LRET-114 35.28 4.96 4.11 2.18 40.40 3.90 57.60 LRET-115 32.28 4.67 4.65 1.96 40.00 14.10 56.60 LRET-116 44.81 6.69 5.36 1.30 20.20 5.80 73.90 LRET-117 38.30 6.33 3.72 1.08 38.50 2.40 57.40 LRET-118 34.80 6.45 5.20 1.39 36.40 9.80 60.20 LRET-119 31.90 5.63 4.27 0.89 45.40 1.30 51.50 LRET-120 38.20 6.53 4.67 1.44 34.50 3.60 58.40 LRET-121 33.40 6.24 4.37 1.23 41.70 6.20 57.00
a Dry basis. 3.Results
The self-ignition temperature may be extrapolated for different volumes, so it represents a generalization of UN tests to any vol-ume. Particularly SIT can be extrapolated to the volumes used in UN tests.
2.2. Collectíng data
A number of samples have been subjected to those test proce-dures, measuring many parameters and obtaining a large number of experimental data. Statistical analysis has been applied to these data with a first aim of understanding the behavior of sludge, where correlations between those parameters can provide useful information. The second aim was to determine the similarity between the samples collected based on two parameters: the loca-tion where the samples were collected and the season when the samples were collected.
This statistical analysis inc1udes correlation analyses, discrimi-nant analyses and principal component analysis. The study was carried out in two distinct stages: first the chemical composition was studied for a number of samples, selecting some of them for the detailed tests carried out in the second stage. The first stage inc1uded all twenty collected samples, whose chemical composi-tion was determined. The second stage corresponded to the selected ten samples whose flammability, explosibility and ther-mal behavior were analyzed.
Ultimate and proximate analyses on a dry basis were done to all the twenty samples, as detailed in Table 3. Hydrogen, nitrogen and sulfur content values have a low standard deviation, while varia-tions obtained for carbon, ash content, moisture and volatile mat-ter are higher.
According to the results of the previous analyses, ten samples were selected in order to choose the largest range of values. Igni-tion sensitivity, explosion severity and thermal stability analyses were determined to those ten samples, and results are shown in Tables4-6.These results show a wide range ofvariation in almost all the parameters studied. MITl values have a variation of 150 K, consistent with the observed variation of MITc values, 190K. The other two parameters inc1uded in the ignition sensitivity group 600
-0,02
o
0,005-0,005
~
-0,01
5
o
t;;
-0,015
800 -TO - -dTO
FET
¡
,.---_..
Temperature(oC)
400 600
Temperahlre(OC) IT
1
,
,,
,,
,
\ \ 1 1 1
1
I I I I
1I
l'
MLT---+"
200
L - - - ' - - 0 , 0 2 5 1000 45
40
35
-
- ' bii 305
.:c
25 bJl.~ 20
O
¡- 15
10
O O
70
60
50
~ 40
5
~ 30 <¡:
<¿;¡
'"
20::c:
U 10
<Zl el
-10
-20
is progressively heated it can decompose and release different gases, some of them being flammable. When an ignition source is applied to the volatile matter released from the sample, the appearance of flames can be observed. It provides an interesting safety issue for organic products that can release flammable com-bustion products, making the product more hazardous.
Isothermal Oven Tests are useful to detect substances liable to spontaneous combustion. Such substances are c1assified as Divi-sion 4.2 according to the UN recommendations on the transport of dangerous goods. The c1assification procedure should be under-taken before a product is offered for transporto Tests are performed to determine if substances in a 25 mm or 100 mm sample cube, at test temperatures of 100oC,120oCand 140oC,undergo spontane-ous ignition or dangerspontane-ous self-heating, which is indicated by a 60 K rise in temperature over the oven temperature within 24 h. These criteria are based on the self-ignition temperature of charcoal, which is 50oCfor a sample cube of 27 cubic meters.
Table 4
Ignition sensitivity and expIosion severity.
SampIe
LRET-l0l LRET-l02 LRET-l03 LRET-l04 LRET-l05 LRET-l07 LRET-ll0 LRET-112 LRET-117 LRET-121
Sensitivity Severity
MITI (oC) MITc (oC) LEL (gjcm3
) MIE(mJ) Pmax(bar) Kmax(barmjs) LOC(%)
260 460 60 67 7.0 124 13
360 480 500 >1000 5.0 77 20
300 480 60 >1000 6.1 125 15
370 440 500 >1000 5.5 loS 13
370 420 125 >1000 5.7 SS 14
390 510 30 >1000 6.3 17S' 14
390 510 125 >1000 6.4 145 13
240 J21f 60 170 6.4 157 16
340 420 60 220 6.1 161 16
320 460 125 >1000 6.1 161 19
Table 5
Thermogravimetry.
SampIe
LRET-l0l LRET-l02 LRET-l03 LRET-l04 LRET-l05 LRET-l07 LRET-ll0 LRET-112 LRET-117 LRET-121
Thermogravimetry Characteristics
TEV (oC) MI(S-l ) MLT (oC) IT (oC) Tcharact(OC) Ea (lgjmol)
380 O 295.0 225 70.7 309
340 29 288.0 240 72.0 281
310 O 262.0 230 67.8 262
360 10 256.0 240 68.5 26:6.
330 3 260.5 227 69.0 264
320 O 259.8 226 53.3 2:77
320 O: 260.0 22&. 69.0 267
260 D 253.0 203 66.6 20$
330 7 253.0 221 66.1
224-310 25 253.0 :gD 66.8 218
Table 6
Differential scanning caIorimetry.
also have high variations, being of special interest that only three of the ten studied samples have a MIE under 1000m]. Instead explosion severity parameters have a lower range of variation, and the Pmaxof the samples do not vary substantially among the studied samples. Finally, the values ofthe
Loe
show also a remark-able range of variation, from 13% to 20%.The parameters obtained from the thermogravimetry and the differential scanning calorimetry provide a range of variation nar-rower than chemical analyses, ignition sensitivity and explosion severity. The temperatures obtained from these tests do not vary in a range as wide as the ignition temperatures do, so the initial heating process of all the samples studied can be considered as quite similar. However, one of the most significant differences among the samples studied is the variation of the MI values. Only three samples produced a significant reaction, leading to a value higher or equal to10,and those samples are not the same as the samples with MIE lower than1000m].
According to the data obtained for these ten samples, three of them were selected due to their diversity and thermal stability was studied for them. Two samples,LRET-102andLRET-110,were
Differential scanning caIorimetry SampIe
LRET-l0l LRET-l02 LRET-l03 LRET-l04 LRET-l05 LRET-l07 LRET-ll0 LRET-112 LRET-117 LRET-121
77 114 89 118 114 120 135 117 160 153
296 345 305 317 304 303 299 288 387 319
212 194 219 193 ::110 206
2t8
182 209 2ÓS
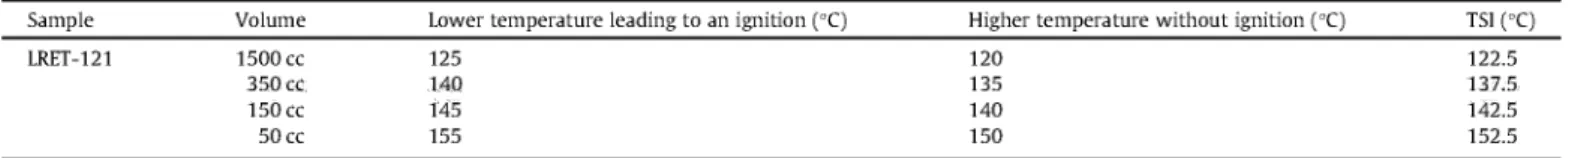
analyzed according to the Division 4.2 tests and T51 was deter-mined for the third sample, LRET-121. The results for LRET-102
andLRET-110showed that they were exempted of hazardous clas-sification when transported in packages of less than 3 m3
. Test
results for sampleLRET-121 are shown in Table 7.
4.Discussion
4.1. Relatíons among parameters
To determine the relationships existing between chemical com-position and explosibility parameters and also among the parame-ters within these two groups, a correlation analysis was done. The objective of this analysis was to determine the relations existing and define the parameters that could be easily modified by preven-tive measures and may cause a decrease on the explosion risk on this kind of industrial plants. With this analysis it is possible to see the similarity ofthe samples with other materials well-known as coal and biomass, and design prevention and protection systems based on those developed and widely experienced in other indus-trial plants.
Jable 7
Se1f-ignition temperature of samp1e LRET-121.
Samp1e Vo1ume Lower temperature 1eading to an ignition (oC) Higher temperature without ignition (oC)
LREJ-121 1500 ce
350e( 150 ce 50ee
125 140 145 155
120 135 140 150
122.5 137,5 142.5 152.5
4.1.1. Chemícal composítíon
Looking only to the chemical parameters determined in this study, two main correlations groups have been observed.
The first group of parameters significantly correlated is formed by four composition parameters: carbon, hydrogen, volatiles and ashes content, as shown in Fig. 3. Added to the correlations, also histograms of each one of the parameters are represented, being the Y-axe the frequency of occurrence, the number of samples whose values are included inside the range represented in the X-axe. The correlations existing between carbon, hydrogen and volatiles are positive, unlike that observed between ash content and these three parameters. These correlations are due to the chemical composition ofthe sewage sludge. The first three param-eters represent the organic content of the samples, while the ash content can be assimilated as the inorganic matter contained in the samples. As the organic matter of the samples is higher, the inorganic is lower.
The second group of significant correlations is observed between the three studied particle size parameters and it means that the tested samples have a high tendency to homogeneity as necessary in this tests. These correlations are illustrated on Fig. 4 besides the histograms of each parameter.
dIO
o
iw
-"O
o 40 80 120 160 d50
600
:11
• •
•
400
....
o
V)
•
•
"O 200
•
o
o 40 80 120 160 o 200 400 600 d90 1500
"""A
;~
•
•
• 1000 , 1000.
....
o
...
0\
• •
••
"O 500
!llte
5 0 0 ,o·
o 40 80 120 160O·
o 200 400 600 o 500 1000 1500dIO d50 d90
4.1.2. Chemícal composítíon and flammabílíty
Volatiles and ashes contents have a main infiuence on the fiam-mability and explosibility of dusts. The main relations observed
Fig.4. Re1ations between d10, d50 and d90(/lm).
e
u
Volatiles
50 55 60 65 70 75 80 Volatiles Ash
1823283338434853
8 0 Q 75 •
70 65
~~
.~
•.
50
t·
1823283338434853 Ash
H
tll
3,4 4,4 5,4 6,4 7,4 5 3 [ 548. " .
43 •
38 \
33 •
28
23 •
18
3,4 4,4 5,4 6,4 7,4
75~
70 65
60
r
~
.
55 ,
50 •
3,5 4,5 5,5 6,5 7,5
H
•
•
••
•
•
..
".
28 31 34 37 40 43 46
7,4
6,4
5,4
::c
4,43,4,,"·~~~~~~
28313437404346
Jt;r¿·
00 33 ,I
<t: 28
23 •
18
28 31 34 3740 43 46
80 75
2
70'.g
65 . .~ 60 . . . , . . 55 • le
50· •
28 31 34 37 40 43 46
e
dealing these two parameters are those existing with MITI, MIE and Pmax, as shown in Fig. 5. As can be seen by the visible alignment formed by the data, the higher the volatiles content, the easier is the flammability of the samples (lower ignition temperatures and energies) and also higher explosibility (higher explosion pressures). However, ash content has a negative influ-ence on the flammability so that higher ignition temperatures and higher ignition energies are required to ignite sludge samples containing a higher inorganic fraction and the obtained explosion pressure is lower.
The addition of inert dust to some combustible products is usu-ally done to avoid the explosion, and this effect can be explained by these correlations among ashes content and the different parame-ters shown in Fig. 5. These correlations supply a method to decrease the ignition risk of the sewage sludge incorporating into the sample inert dust.
Hydrogen and sulfur showed a strong relation to the flammabil-ity parameters and this can be explained by the oxidation tendency of these components that are present in the sewage sludge.
Relationships were also observed between the decreasing parti-ele size and an increase on the flammability of dusts and on the explosion severity. These relationships are observed in these sam-pies between the medium diameter (d50) and the MIE, MITl and IT as shown on Fig. 6.
The relationship existing between partiele size and MITl has a double effect. In one hand, when the partiele size is bigger, the gaps between the partieles full of oxygen are larger, so the igni-tion easiness is higher. But in the other hand, the igniigni-tion is more
difficult because the air is less conductive than the own sub-stance. In this case, the second effect is stronger than the first one and by enlarging the partiele size it is possible to increase the MITI and the ignition of a dust layer is more difficult. The same effect occurs with the IT, the higher the partiele size, the higher the IT so the combustion of the sample starts at higher temperatures. Increasing the partiele size and preventing the pro-duction of dust of extremely small partiele size is also in this case a possibility to prevent the ignition risk in this kind of industrial plants.
Correlations with MIE do not lead to a line like in the other cases. Those are significant correlations because samples are grouped in two groups, one for these samples with less than 1000 m] of MIE and another with more. Generally, the group with more than 1000 m] has less volatile content, more ash content, more MITI and less Pmax. These relations are expected, but more samples are needed to ensure them.
In addition, looking at the relations existing among different flammability parameters, it is also observed a significant correla-tion among several temperatures studied. When a combustible substance is heated by a heat source, it begins to oxidize, and as the temperature increases it oxidizes more rapidly. At a certain point, the heat generated by the oxidation is sufficient to maintain the ignition without the aid of external sources. This point is the self-ignition temperature. Therefore, the three temperatures related to this ignition point (MITI, MITc and TEY) vary in the same direction as IT. Correlations related with MIE are similar as in the previous case, forming two groups of samples.
Yolatiles
•
4,7 5,2 5,7 6,2 6,7 7,2
Pmax Pmax
o 400 800 1200
MIE
::~D·.
I
5,7
I
5,2 •
4,7
o 400 800 1200 MIE MITI
220260300340380420
1200
0...
800
400
•
•
o220260300340380420•
::~G·
....
5,7
I
5,2 •
4,7
220260300340380420
MITI
Ash
30 35 40 45 50 420
0
380 • • •
340 •
•
300 •
260 •
•
220
30 35 40 45 50
1 2 0 0 C
•• •
800400
...
o
30 35 40 45 50
::~G··I
.
5,7 ,
5,2 •
4,7
30 35 40 45 50
Ash
••
••
•
••
•
Yolatiles
ITWj
50 55 60 65:~[J-
·
..c 40 • •
.<
• •
35
•
30
50 55 60 65
:~~LSJ··
340 •
¡::::: •
:E
300 •260 •
220 •
50 55 60 65
1200LJ··
800'-'.l
:E
400•
I
o
50 55 60 65
7,2 6,7
>( 6,2
!
5,7 5,24,
dSü
1~~~C
1200U
·..
600 800
C.Ll
~ 400 400
200.. • •
OO 100 200 300 400• O220260300340380420•
MIE
O 400 800 1200 MITl
220260300340380420
o 100 200 300 400
~::D···
~
280 ••
240
O 100 200 300 400
~:~D·
·
220 • .
t:
210
200 •
O 100 200 300 400
dSü
IT
~:~E···· ~:~CI
:LlJ
220 • 2 2 0 · 2
210 210 1
200 • 200 • O
220260300340380420 O 400 800 1200 200 210 220 230 240
MITl MIE IT
Fig.6. ReIations between rnediurn diarneter (Jlrn) and MITI (oC), MIE (rnJ) and IT (oC).
Other relations among temperatures are those more related with the volatiles content of the sample. It was found that the higher the volatiles content the more easily it ignites. Because of it, when theTcharact increases, also other temperatures associated
with those volatiles (MITc, TDM and TEV) increase, due to the
Tcharact represents the temperature at which a quick combustion
occurs. The exothermic reaction starts at lower temperatures as the reactivity of the substances increases (lower TDM) and the ignition of a dust c10ud is easier (lower MITc). And in substances in which the quick exothermic reaction starts at low temperatures (lower TCP), the ignition of a c10ud of sample is also easier.
Furthermore a relation was observed between ignition sensitiv-ity and explosion seversensitiv-ity, so that samples which need less dust concentration to ignite are those that produce the highest explo-sion pressures.
Finally, looking at the self-ignition risk of the sewage sludge, it was observed that when this risk is higher, the explosion severity is also higher.
4.2. Influence oI the orígín and the season
A discriminant analysis has been developed based on two different factors: the origin of the samples and the season when they were collected. This analysis was applied to the two groups of data previously described: chemical analysis (twenty-sample group) and fiammability data (ten-sample group). In the second analysis, due to the linearity existing among the parameters of these ten samples, a principal component analysis (PCA) was developed.
In both groups, the discriminant analyses according to the origin of the sample showed that the 100% of the samples are correctly c1assified. In the first group, no significant discriminant
function is observed. However, in the second group a significant discriminant function is determined, and the moisture of the sample is the main parameter that causes the c1assification, fol-lowed by its sulfur contento
The analysis according to the season shows that95%of the sam-pies inc1uded on the twenty-sample group and 90% on the ten-sample group are c1assified in the right group and only one of the samples is incorrectly c1assified in each case. In the first analy-sis realized to the twenty-sample data, one significant discriminant function has been determined. In this function, the parameters with more weight are the volatiles content and the carbon contento No significant discriminant function is observed in this case in the analysis done to the twenty-sample data.
5.Conclusions
The relations observed between the composition parameters depend on many factors, but they are not due to the drying process of the sewage sludge, otherwise they depend on the wastes treated and on the process followed in the wastewater treatment plant before the drying process.
Relations between the different measured temperatures showed the high dependency existing between different groups of parameters, and how the ignition, self-ignition and reactivity of the samples are related.ltwas also observed that the tempera-tures related with these actions vary together showing the same tendency. These relations show that by decreasing the risk of one of the parameters it is possible to decrease also others. For exam-pie, by increasing the partic1e size it is possible to heighten MIE, MITI and TIC because of the direct correlations observed, but also MITc, TEV, Tcharactand TDM will increase.
By the comparison of the discriminant analysis depending on the origin and on the sampling season, it is shown that the discrim-ination due to the origin is more accurate than the one due to the season. This shows that the sewage sludge ignition depends more of the origin of the sample than of the season. Even so, the percent-age of correctly c1assified samples in order to the season is quite high, so the season is also an important parameter to c1assify the ignition tendency of sewage sludge. AIso it is shown that the parameter that causes the differentiation of the samples according to their origin is the moisture of the samples, so this parameter varies greatly depending on the origin of the sample. And looking at the season when samples were collected, volatiles and carbon contents are the main reason for differentiating samples, which shows that the organic composition of the samples varies accord-ing to the season.
Acknowledgrnent
The authors gratefully acknowledge the Lloyd's Register Educa-tional Trust for funding this study through the projectSafety condi-tíons against ATEXriskin the water industry.
References
[1] Daigger GT. Wastewater management in the 21st century. J Enviran Eng -ASCE 2007;133:671-80.
[2] Daigger GT. Evolving urban water and residuals management paradigms: water reclamation and reuse. decentralization. and resource recovery. Water Enviran Res 2009;81 :809-23.
[3] Bixio D. Thoeye C. De Koning J. Joksimovic D. Savic D. Wintgens T. et al. Wastewater reuse in Eurape. Desalination 2006;187:89-101.
[4] Spinosa L. Vesilind PA. Sludge into biosolids. pracessing disposal and utilization. London: IWA Publishing; 2001.
[5] Kelessidis A. Stasinakis AS. Comparative study of the methods used for treatment and final disposal of sewage sludge in Eurapean countries. Waste Manage (Oxford) 2012;32:1186-95.
[6] Braphy MO. Hazards in Sewage (Waste) Treatment Plants. Encyclopedia of Occupational Health and Safety. Geneva: International Labour Organization; 2011. <http://www.ilo.org/oshenc/part-xviijpublic-and-government-servicesj itemj831-hazards-in-sewage-waste-trea tment-plants>.
[7] Joseph G. Combustible dusts: a serious industrial hazard. J Hazard Mater 2007;142:589-91.
[8] American Institute of Chemical Engineers. Is sugar an explosion hazard? J Fail Anal Preven 2008;8:311-2.
[9] Fodor Z. Klemes ]. Waste as alternative fuel-minimising emissions and effluents by advanced designo Pracess Saf Enviran 2012;90:263-84. [lO] Eckhoff RK. Dust explosions in the pracess industries. Oxford:
Butterworth-Heinemann; 2003.
[11] Lebecki K. Functional safety in industrial explosion pratection. Transactions 2012:44-8.
[12] Amyotte PRo Eckhoff RK. Dust explosion causation. prevention and mitigation: an overview. J Chem Health Saf 2010;17:15-28.
[13] Ramírez Á, García-TorrentJ. Aguado Pj. Determination ofparameters used to prevent ignition of stored material s and to pratect against explosions in food industries. J Hazard Mater 2009;168:115-20.
[14] Huéscar Medina C. Phylaktou H. Sattar H. Andrews G. Gibbs B. The development of an experimental method for the determination of the minimum explosible concentration of biomass powders. Biomass Bioenergy 2013;53:95-104.
[15] López-González D. Fernandez-Lopez M. Valverde J. Sanchez-Silva L Thermogravimetric-mass spectrametric analysis on combustion of lignocellulosic biomass. Bioresour Technol 2013;143:562-74.
[16] Cashdollar KL Coal dust explosibility. J Loss Prevent Pracess 1996;9:65-76. [17] Harrison EZ. Oakes SR. Hysell M. Hay A. Organic chemicals in sewage sludges.
Sci Total Enviran 2006;367:481-97.
[18] Metcalf L. Eddy HP. Tchobanoglous G. Wastewater engineering: treatment. disposal. and reuse. McGraw-Hill; 1972.
[19] Beamish B. Arisoy A. Effect of mineral matter on coal self-heating rateo Fuel 2008;87:125-30.
[20] Calle S. Klaba L. Thomas D. Perrin1.,Dufaud O. Influence ofthe size distribution and concentration on wood dust explosion: experiments and reaction modelling. Powder Technol 2005;157:144-8.
[21] Eckhoff RK. Understanding dust explosions. The rale of powder science and technology.J Loss Prevent Pracess 2009;22:105-16.
[22] Traoré M. Dufaud O. Perrin L. Chazelet S. Thomas D. Dust explosions: how should the influence of humidity be taken into account? Pracess Saf Enviran 2009;87:14-20.
[23] Klippel A. Scheid M. Krause U. Investigations into the influence of dustiness on dust explosions. J Loss Prevent Pracess 2013;26:1616-26.
[24] Fuentes MJ. FontR,Gómez-Rico MF. Moltój. Multivariant statistical analysis of
PCDDjFSin sewage sludges fram different areas of the Valencian Community (Spain). Chemosphere 2007;67:1423-33.
[25] García-Delgado M. Rodríguez-Cruz M. Lorenzo L. Arienzo M. Sánchez-Martín M. Seasonal and time variability of heavy metal content and of its chemical forms in sewage sludges fram different wastewater treatment plants. Sci Total Enviran 2007;382:82-92.
[26] Ramírez Á, García-Torrent J. Tascón A. Experimental determination of self-heating and self-ignition risks associated with the dusts of agricultural material s commonly stored in silos. J Hazard Mater 2010;175:920-7. [27] García Torrent J. Cámara Rascón Á, Queral Aragón E. New thermogravimetric
techniques applications for characterizing the susceptibility of coal to selfcombustion. In: XI Congreso Internacional de Industria. Minería y Metalurgia. Zaragoza; 2002.