ACE 34
THE INFLUENCE OF LIFESTYLE AND BUILT
ENVIRONMENT FACTORS ON TRANSPORT CO
2
EMISSIONS: THE CASE STUDY OF
AUTONOMOUS UNIVERSITY OF BARCELONA
Julio A. Soria-Lara, Carme Miralles-Guasch & Oriol Marquet
Cómo citar este artículo: SORIA-LARA, J. A.; MIRALLES-GUASCH, C. & MARQUET, O. The
influence of lifestyle and built environment factors on transport CO2 emissions: the case study of
THE INFLUENCE OF LIFESTYLE AND BUILT ENVIRONMENT FACTORS ON TRANSPORT CO2 EMISSIONS: THE CASE STUDY OF AUTONOMOUS UNIVERSITY OF BARCELONA
Soria-Lara,
Julio A.
1Miralles-Guasch, Carme
2Marquet, Oriol
3Remisión inicial: 24-03-2016 Remisión final: 14-06-2017
Key words: Survey; greenhouse emissions; sustainability; Climate Change
Structured abstract
Transport is a major user of carbon-based fuels and is seen as crucial intervention sector for
meeting CO2 emission reduction targets. While the academic literature has traditionally focused
more on correlating built environment factors (i.e. urban density, trip distance, etc.) and production of CO2 in the transport sector, only limited attention has been paid to the influence of
lifestyle factors. This paper examines the effects of lifestyle and built environments factors on
transport CO2 emissions generated by the daily commutes to and from the Autonomous
University of Barcelona (UAB) in Greater Barcelona (Spain). The analysis revealed that lifestyle choices were as relevant as the built environment for understanding the emitting sources and CO2 volume. Accordingly, the study provides insights how the design of efficient transport policy
packages can integrate lifestyle factors as a central focal point.
1. Introduction
Climate change is a very serious and urgent issue. The concentration of atmospheric CO2 has
increased significantly, representing around 78% of total anthropogenic greenhouse gas (GHG) emissions since 2004. Academia and institutions agree that the transport sector is a major source of GHG and has the fastest growth in CO2 emission of any sector (Berrittella et al., 2008;
Dulal et al., 2011). Carbon dioxide is not directly toxic to most plants and animals, but it has other negative impacts on the environment, which ultimately results in global warming. Due to the fact that the most significant GHG are the product of the oxidation of carbon through the combustion of carbon-based fuels, part of the response for achieving low-carbon cities should be based on reducing CO2 emissions from the transport sector (Aamaas et al., 2013; Abid,
2015; Hickman et al., 2010; 2011; Hysing, 2009).
1
Transport Research Centre – TRANSyT. Universidad Politécncia de Madrid, C/Profesor Aranguren, 3, 28040 Madrid, Spain. E-mail: [email protected]
2
Department of Geography, Institute of Environmental Science and Technology, ICTA, Autonomous University of Barcelona (Spain), Campus de Bellaterra, Edifici B,08193 Bellaterra, Barcelona, Spain. E-mail: [email protected]
3
A more in-depth understanding about the causes behind transport CO2 emissions is crucial for
designing transport policy packages that further low-carbon cities and regions. While there is growing interest in combining personal behaviour, technology, land use and fuel quality to achieve significant reductions in the CO2 production from the transport sector (Ahanchian and
Biona, 2013; Begg and Gray, 2004; Dulal and Akbar, 2013; Meggers et al., 2012), the literature has paid more attention to exploring the correlation between built environments and transport CO2 emissions. Only limited attention has been paid to understanding the production of CO2 in a
more comprehensive way, including the impact of individual lifestyle choices and socio-demographic factors (Miralles-Guasch, 2012).
Under the assumption “planning more to travel less” (Banister, 1999; Bertolini et al., 2008), scholars have come to realize that integrated built environment and transport planning at the city level can deliver a significant contribution to meeting sustainable planning goals (Banister, 2008; Silva and Pinho, 2011; Soria-Lara et al., 2015; Switzer et al., 2013). This view is also reflects a long-standing body of theory on the relationship between the built environment and the transport sector (Cervero and Kockelman, 1997; Ewing and Cervero, 2010). Specifically, Banister (2005) identified six groups of key factors that interconnect the built environment and transport: settlement size (Hickman and Banister, 2007; Naess, 2009); urban density (Oakes et al., 2007; Liu et al., 2014; Soria-Lara and Valenzuela-Montes, 2014); land use diversity (Pitombo et al., 2010; Song and Knaap, 2004; Soria-Lara et al., 2014); urban design; local accessibility (Cervero et al., 2009); and finally the provision of parking (Albert and Mahalel, 2006). Supported by the abovementioned issues, there has been a proliferation of studies based on correlating transport CO2 emissions and built environment factors as an initial step to
designing transport policy packages for CO2 mitigation (Bart, 2010). Despite the strong
correlations between the built environment and transport CO2 emissions (Bart, 2010), it is
unclear whether land use planning strategies alone are sufficient for meeting the desired CO2
reduction targets.
Accordingly, many researchers find that for a better understanding of daily travel behaviour the existing connections between the built environment and transport need to be further explored (Thøgersen, 2006). The academic literature has identified a number of issues that underlie this challenge: Bhat and Guo (2007) discussed the non-existence of a true causality in the connection between built environment and transport; typical demographic variables are significantly affecting to modal transport choice providing decision-makers useful insights for design transport policies (Choo and Mokhtarian, 2004); the distinction between planned, habitual and impulsive travels is crucial in forecasting travel behaviour (Gärling et al., 1998); studying socio-demographic factors of mobile populations is key for understanding the daily use of transport modes (Marquet & Miralles-Guasch, 2014; Miralles-Guasch et al., 2014); the effects of a direct connection between residential neighbourhood on car availability are small compared to the influence of other variables, such as age and travel attitude. Extending the previous
argument to transport CO2 emissions, certain scholars highlight the need to assess the impact
of lifestyle and socio-demographic factors (Ma et al., 2014; Nicolas and David, 2009).
This paper aims to contribute to the abovementioned discussion by exploring the following central research question: How do lifestyle and built environment factors affect transport CO2
travel demand created by Autonomous University of Barcelona (UAB) within Greater Barcelona provides the empirical focus. For the year 2020, the government of Catalonia has set a CO2
reduction target of 20%, based on 1990 emission levels, which is in line with Spanish targets under the European 2020 strategy. We explored the indicated research question using a personal travel demand survey disseminated in 2013 among UAB members (n=5,814). First, the transport CO2 daily emissions were estimated (in kilograms CO2 passenger-1day-1), followed
by a non-parametric Mann–Whitney U test (U-test) to correlate the CO2 emission estimates with
lifestyle and built environment factors. The selected lifestyle factors were (i) car availability; (ii) weekly attendance at the UAB campus; (iii) role at UAB; (iv) daily stay at UAB. The built environment factors included (i) trip distance; (ii) public transport accessibility to UAB; (iii) urban density; (iv) settlement size.
After the review of recent academic insights on transport CO2 emissions outlined above, Section
2 describes the research method, including an in-depth description of the study case. In Section 3 the main results of our research are presented including a discussion on potential transport policy packages in the case study. The paper closes with several concluding remarks and recommendations for further inquiries.
2. Research design
2.1
The UAB campus in the Greater Barcelona and travel demand database
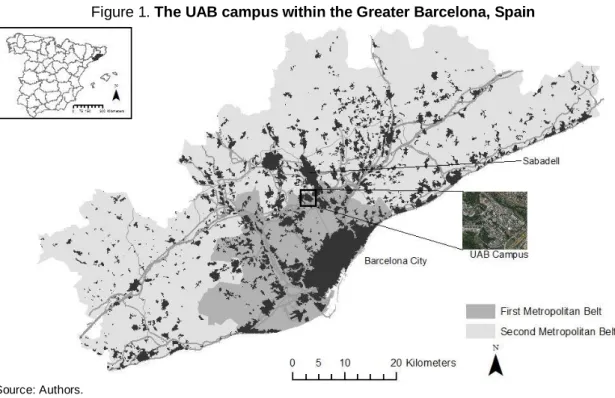
UAB campus provides the empirical focus of our research. It is located in a suburban area within Greater Barcelona, a region that covers an area of 3,242 km2, including approximately 5 million inhabitants and 164 municipalities. Greater Barcelona is made up of two metropolitan belts that extend from the city outwards. The first belt has both high residential density and high land use diversity. However, the second belt is characterized by low residential density and a poor dotation of public transport systems (Miralles-Guasch and Domene, 2010; Miralles-Guasch et al., 201; Soria-Lara et al., 2017). The UAB campus is located some 15 km from the city centre and shares some of urban characteristics from the second metropolitan belt, like low urban densities and scattered urban developments. It is situated at the intersection between two major motorways, the AP-7 and the C-58 (see Figure 1). Parking at the campus is free for all. Despite its suburban setting, it is worth noting that the UAB campus has high public transport accessibility; three train stations, with direct connections to Barcelona and other surrounding cities, as well as several metropolitan bus stations have been built. The price of a single ticket either by bus or train from Barcelona to the University is 2.15 euros and the expected travel time can range from 25 to 40 minutes.
In 2013 the UAB community was asked to participate in a personal, travel demand survey online. The survey was hosted in the university intranet and was available to be answered online for the whole university community for several weeks. An informative banner was set in the University webpage to encourage participation. In total 5,814 respondents filled out the form, a 12.5% response ratio and a low margin error of ±1.29%. Results were weighted according to its distribution by gender and role at the university, in order to balance the sample to the universe of study. This travel demand survey has been carried out six times since 2001. It provides valuable information, not only because it is a faithful reflection of movement patterns in a unique area such as the UAB campus, but also because it is a longitudinal study over a 13-year period.4 The survey was structured in four main blocks: (i) general socio-demographic questions, such as age, gender and car availability; (ii) daily mobility habits, such as number of trips or number of hours at the UAB; (iii) usual transport modes and modal choice; and (iv) other questions. For the evaluation of the received enquiries, respondents were required to provide details about their professional activity, such as residential location, role at the university (student, academic staff, administrative staff) etc.
Overall, the suburban location makes it difficult to commute to the campus by no motorized transports (5.8%). The majority of the university community get to the campus either by Public Transport, which represents 59.7% of the travels, or by private modes of transport that represent the remaining 34.5%.
Figure 1. The UAB campus within the Greater Barcelona, Spain
Source: Authors.
2.2
Calculation of transport CO2 emissions
4
All of the calculations of transport CO2 emissions were based on regular inventories, made at
national and European level, to assess the production of CO2 and its allocation per specific
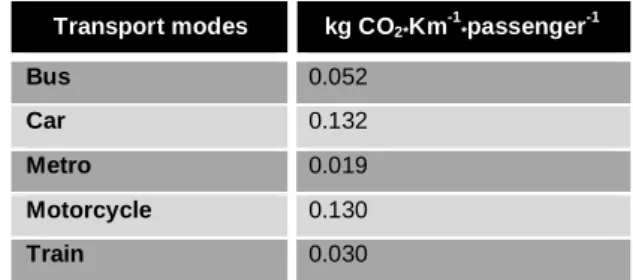
sector (EU, 2010; Soria-Lara and Valenzuela-Montes, 2014). Carbon dioxide emission coefficients for each transport mode can be consulted in table 1. Given that respondents indicated the transport modes used to travel to the UAB Campus as well as the amount of kilometres covered, the calculations of transport emissions in kg CO2 passenger-1day-1 were
directly obtained according to next equation, Estimate of transport CO2 emissions.
Where distance is the total of kilometres daily covered by UAB members and is the
CO2 emission coefficient per each transport mode j (table 1). The case of car emissions
coefficient was corrected taken into consideration that the 43% of car in the region used diesel fuel according to regional statistics in 2013.
Table 1. Carbon dioxide emissions coefficient according to transport mode
Transport modes kg CO2*Km-1*passenger-1
Bus 0.052
Car 0.132
Metro 0.019
Motorcycle 0.130
Train 0.030
Source: European Commission, 2010.
2.3
Statistical analysis and selection of lifestyle and built environment factors
The second part analysed how lifestyle and built environment factors affect the production of CO2 from the transport sector. Each lifestyle and built environment factor was divided in
subgroups of discrete variables (see table 2). The Mann–Whitney U test (U-test) was conducted to analyse statistically significant differences at p-level 0.05. It is a non-parametric test of the null hypothesis that two populations (in our case factors of lifestyle and built environment) are the same against an alternative hypothesis especially that a particular population tends to have larger values than the other. The test involves the calculation of a statistic, usually called U, whose distribution under the null hypothesis is known. Significant differences at p-level 0.05 for
each subgroup of analysed variables would indicate stronger influence on transport CO2
emissions and vice versa.
As previously indicated, The U-test was used because of the sample’s non-parametric characteristics. The production of CO2 will be presented in Section 3 as the interval of emissions
formed by 25th percentile and 75th percentile (50% of representative CO2 emissions).
LIFESTYLE BUILT ENVIRONMENT
Factors Subgroup of variables Factors Subgroup of variables
Car
availability
1) Yes 2) Not
Trip distance 1) <7.5 km
2) Between 7.5 – 15 km 3) Between 15 – 30 km 4) >30 km
Attendance at
UAB
1) 1 day 2) 2 days 3) 3 days 4) 4 days 5) 5 days 6) 6 days 7) 7 days
Public transport
accessibility
1) Direct 2) 1 transfer 3) 2 transfers 4) >2 transfers
Role at UAB 1) Student (<2 years)
2) Student (>2 years) 3) PhD students 4) Research staff 5) Teaching staff 6) Others
Urban density 1) <5,000 pop/km2
2) 5,000 – 10,000 pop/km2 3) 10,000 – 15,000 pop/km2 4) 15,000 – 20,000 pop/km2 5) >20,000 pop/km2
Daily stay at
UAB
1) <4 h
2) Between 4h – 8h 3) >8h
Settlement size 1) <1,000 pop
2) 1,000 – 5,000 pop 3) 5,000 – 1,0000 pop 4) 10,000 – 50,000 pop 5) 50,000 – 100,000 pop 6) 100,000 – 200,000 pop 7) > 200,000 pop
Source: Autonomous University of Barcelona.
In the selection of lifestyle and built environment factors two relevant issues were considered. First, lessons from the academic literature about the connection travel demand-lifestyle-built environment. Second, the availability of information from travel demand survey (see Section 2.1). It is worth to emphasize that the travel demand survey used during the research was not specifically designed for the study; its scope was wider and orientated towards the management of daily mobility created by the UAB campus in the Greater Barcelona.
were affected when UAB members could travel daily to and from the UAB campus by car. Almost half (47%) of the respondents had access to a car (figure 2). Second, “weekly attendance of the UAB” shows whether more/less frequent attendance at the UAB campus affects the choice of transport mode, and in turn CO2 emissions. Most of respondents came to the UAB campus 5 days a week (65%) (Figure 2). The third factor was the “personal role at UAB”, which was directly associated with income levels. As can be seen in figure 2, most of respondents were students (61%).
Finally, the consideration of hours spent per visit (“daily stay at UAB”) would indicate how CO2 emissions were affected by the fact that UAB members daily stayed at the UAB campus longer or shorter period of daily time. Specifically, 15% of participants spent 4h per day (15%), 54% indicated 4–8h per day and 31% indicated more than 8h per day (figure 2).
Regarding the built environment, four factors were explored: (i) trip distance; (ii) public transport accessibility; (iii) urban density; and (iv) settlement size. The source of these data was both the travel demand survey described in Section 1 and the statistics office from government of Catalonia. 5 The first factor to be studied was “trip distance”, considered in the academic literature as one of the most important factors for understanding the relationship between mobility and urban form. The largest segment of respondents lived between 15 and 30 km (43%) away from the campus (also coinciding to the distance of the city of Barcelona), while the smallest portion (12%) lived between 7.5 and 12 km (figure 2). Second, “public transport accessibility” to the UAB campus was another important factor (as indicated in other studies, see Cervero et al. (2009) for Bogotá, Colombia). In our study, 34% had a direct public transport connection with the UAB campus; 14% had 1 transfer, 27% had 2 transfers and a total of 24% respondents had more than 2 transfers (figure 2). The last two selected factors were “urban density” and “settlement size”. Both factors are considered crucial for understanding the link between the built environment and transport (Oakes et al., 2007).
Regarding “settlement size”, most of respondents lived in municipalities with more than 200,000 inhabitants, including the city of Barcelona (48%), while “urban density” was more compact as most respondents lived in communities with population densities between 15,000 and 20,000 pop/km2.
Figure 2. Distribution of respondents according to lifestyle and built environment factors
3. Results
3.1
Lifestyle factors and transport CO
2emissions
Car availability was the first factor to be studied. UAB members with car access had clearly higher CO2 emissions (see figure 3). Specifically, 50% of the transport CO2 emissions from the
population with car access were estimated between 0.79 and 7.16 kg CO2 passenger
-1
day-1. On the other hand, 50% of transport CO2 emissions from persons without car access were
estimated between 0.24 and 0.79 kg CO2 passenger -1
day-1. U-test showed major significant differences at p-level 0.05 between the two groups (table 3). It is worth highlighting that the survey indicated higher car ownership rates (0.69 vehicles UAB member-1) compared to the other Spanish regions (0.41 vehicles habitant-1).
The location of the UAB campus could be responsible for this situation. Despite the fact that the UAB campus is apparently well-connected by public transport, its location at the heart of Greater Barcelona seem subjectively to instigate an increase in car availability for persons who work or study at UAB. Accordingly, car availability should play a crucial role in designing transport policy packages that help mitigate the production of carbon dioxide. In this sense, the promotion of a car-free UAB campus could be fostered through regulatory policies (e.g. limiting car access to the UAB campus for several days a week), economic policies (e.g. implementing parking taxes at the UAB campus) or positive discrimination measures (i.e. prioritizing parking facilities for electric cars or free parking for carpooling).
The second lifestyle factor to be studied was weekly attendance atthe UAB campus. With the
exception of UAB members who attended 7 days per week (a limited group of people associated with security staff and a few researchers), the results showed that UAB members with attendance levels of 3 days or less emitted higher kg CO2 passenger-1day-1values than
UAB members who came 4, 5 and 6 days per week (figure 3). Actually, the U-test showed major significant differences at p-level 0.05 between these two weekly attendance patterns (table 3).
For attendance levels of 3 days or less, 50% of emissions were between 0.793 and 2.61 kg CO2
passenger-1day-1 (1 day), 3.44 kg CO2 passenger -1
day-1 (2 days) and 3.07 kg CO2 passenger
-1
day-1 (3 days). For the group that attended 4 days or more, CO2 production ranged from 0.46 (4
days), 0.54 (5 days) and 0.29 (6 days) to maximum of 1.96 kg CO2 passenger -1
day-1. It was highlighted that UAB members with attendance levels of 3 days or less had higher car ownership rates than their colleagues who visited the campus 4 days or more. The conclusion is that those members with occasional trips to UAB were less worried about car use costs and other associated negative externalities.
However, with more frequent attendance, UAB members took car costs more into consideration and opted for public transport. Similar to car availability, frequency of attendance at the UAB campus is also a relevant factor for reducing transport CO2 emissions. Transport policy
Income levels were represented in the survey through role at UAB variable. This was the third factor to be analysed. Research staff had the highest levels; 50% of their transport CO2
emissions ranged from 0.79 to 3.39 kg CO2 passenger
-1
day-1. The second group was teaching
staff; 50% of their CO2 emissions were between 0.55 and 2.57 kg CO2 passenger
-1
day-1 (figure
3). On the other hand, the group of UAB members with the lowest CO2 production was students
with less than 2 years of experience; 50% of their emissions ranged from 0.45 to 1.50 kg CO2
passenger-1day-1. These results seem to follow a logical sequence in the Spanish context, with the highest income levels (research and teaching staff) using mainly private transport modes and correspondingly higher CO2 emissions. The U-test verified a significant difference at p-level
0.05 between students with less than 2 years of experience and the other groups (table 3). Two relevant factors could explain these findings. First, students with less than 2 years of experience lived in municipalities closer to the UAB campus, thus leading to shorter trip distance and consequently lower production of carbon dioxide. Second, car availability rates of research and teaching staff were the lowest among the rest of UAB members. Statistically significant differences were also noted between the production of CO2 from teaching/research staff and
students with more than 2 years of experience (including PhD students) (table 3). The location of the homes of teaching and research staff seemed to be crucial in understanding their higher CO2 emissions rates compared to the other groups. An optimization of the public transport
network and promotion of electric transport modes could contribute to reduce transport emissions due to role differences at UAB.
Finally, daily stay at UABwas the fourth and last lifestyle factor to be studied. The group of UAB
members that stayed at the UAB campus 4-8h per day had the highest transport CO2
emissions; 50% of their emissions ranged from 0.55 to 23.51 kg CO2 passenger
-1
day-1.
Respondents who stayed at UAB less than 4h showed the lowest CO2 production; 50% of such
emissions were between 0.45 and 14.78 kg CO2 passenger-1day-1 (figure 3). Several reasons
Figure 3. Emission of Kilograms CO2 passenger-1day-1
3.2
Built environment factors and transport CO
2emissions
The second group of factors regarding transport CO2 emissions is related to the built
environment in Greater Barcelona. Trip distance was the first factor to be studied. Results
showed that higher trip distances to the UAB campus meant higher CO2 values. As can be seen
in figure 3, 50% of CO2 emissions in cases of trip distances >30 km were from 1.5 to 3.2 kg CO2
passenger-1day-1, followed by 15–30 km, which were between 0.79 and 2.6 kg CO2 passenger
-1
day-1. The lowest CO2 production was found in trip distances <7.5 km, between 0.45 and 0.72
kg CO2 passenger -1
day-1. The U-test showed statistically significant differences at 0.05 p-level between the four subgroups (table 3). Research and teaching staff had higher trip distance than other UAB members. Taking into consideration that transport emissions from research and teaching staff were also higher than other UAB members, this could be one of the key reasons behind the higher emissions. Therefore, we propose similar measures for designing transport policy packages: the optimization of the public transport network as well as the promotion of electric transport modes among members of this group.
The second factor was public transport accessibility to UAB. The results indicate that UAB members who enjoyed direct connections to the UAB campus by public transport showed lowest CO2 values. Specifically, 50% of CO2 emissions from persons who lived in municipalities
with direct public transport connection to the UAB campus ranged from 0.79 to 0.84 kg CO2
passenger-1day-1, while 50% of CO2 emissions from those with at least 2 public transport
transfers were between 0.88 and 3.57 kg CO2 passenger-1day-1 (figure 3). The U-test showed
strong correlations, showing statistically significant differences between the four subgroups of variables: direct connection, 1 transfer, 2 transfers, >2 transfers. Similar to the trip distance factor, public transport accessibility seemed to be very relevant for transport CO2 (table 3).
Transport policy packages should focus on optimizing the public transport network, especially in those municipalities where most UAB members currently reside.
The third factor to be studied was urban density (pop/km2). The analysis showed that municipalities with lower urban densities had a higher production of CO2 (see figure 3); 50%
CO2 transport emissions of municipalities with urban densities lower than 15,000 pop/km
2
were from 0.69 to 2.51 kg CO2 passenger
-1
day-1, meanwhile 50% CO2 transport emissions from
municipalities with urban densities higher than 15,000 pop/km2 were from 0.79 to 1.35 kg CO2
passenger-1day-1. Differences in transport CO2 emissions were significant at p-level 0.05
according to the U-test in most urban density subgroups (Table 2). The main explanation behind the difference seems to follow the problem with weaker public transport services in municipalities with lower urban densities.
Settlement size within the Greater Barcelona was the fourth and last built environment factor analysed. In general, the obtained pattern indicated that smaller municipalities produced higher kg CO2 passenger-1day-1 than bigger municipalities, with the exception of municipalities between
100,000 and 200,000 inhabitants. As can be seen in figure 3, 50% of CO2 emissions from
people who lived in municipalities with less than 50,000 inhabitants were between 2.4 and 10.5 kg CO2 passenger
-1
day-1, while UAB members living in municipalities with more than 50,000 inhabitants had 0.18 to 8.8 kg CO2 passenger
-1
23
ACE© AÑO 12, núm.34, JUNIO 2017 |THE INFLUENCE OF LIFESTYLE AND BUILT ENVIRONMENT FACTORS ON TRANSPORT CO2 EMISSIONS: THE CASE STUDY OF AUTONOMOUS UNIVERSITY OF BARCELONA
Julio A. Soria-Lara, Carme Miralles-Guasch &Oriol Marquet recommendations for decision-makers follow the argumentation that reinforcing public transport connections between the UAB campus and smaller municipalities with many UAB residents would sink CO2 emissions.
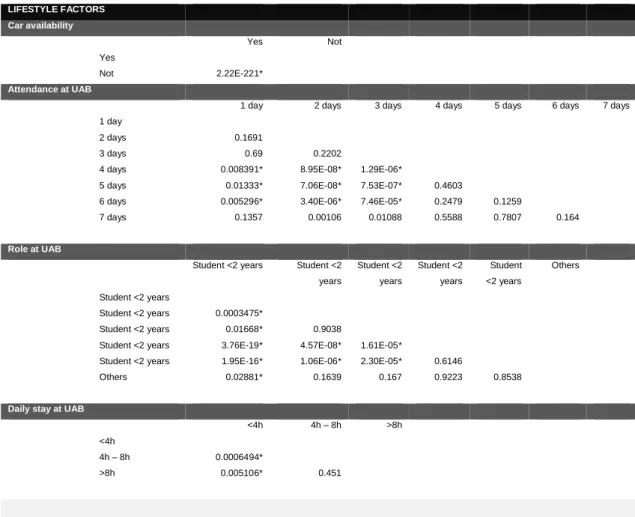
Table 3. Statistical analysis (Mann-Whitney U-test)
LIFESTYLE FACTORS Car availability
Yes Not Yes
Not 2.22E-221* Attendance at UAB
1 day 2 days 3 days 4 days 5 days 6 days 7 days 1 day
2 days 0.1691
3 days 0.69 0.2202
4 days 0.008391* 8.95E-08* 1.29E-06*
5 days 0.01333* 7.06E-08* 7.53E-07* 0.4603
6 days 0.005296* 3.40E-06* 7.46E-05* 0.2479 0.1259
7 days 0.1357 0.00106 0.01088 0.5588 0.7807 0.164
Role at UAB
Student <2 years Student <2 years Student <2 years Student <2 years Student <2 years Others
Student <2 years
Student <2 years 0.0003475*
Student <2 years 0.01668* 0.9038
Student <2 years 3.76E-19* 4.57E-08* 1.61E-05*
Student <2 years 1.95E-16* 1.06E-06* 2.30E-05* 0.6146
Others 0.02881* 0.1639 0.167 0.9223 0.8538
Daily stay at UAB
<4h 4h – 8h >8h <4h
4h – 8h 0.0006494*
>8h 0.005106* 0.451
BUILT ENVIRONMENT FACTORS Trip distance
<7.5 km 7.5 – 15 km 15 – 30 km >30 km <7.5 km
7.5 – 15 km 1.48E-116*
15 – 30 km 0* 1.31E-146* >30 km
0* 3.28E-151* 4.24E-217*
Public transport accessibility
Direct 1 transfer 2 transfers >2 transfers Direct
1 transfer 2.33E-11*
2 transfers 1.20E-18* 8.18E-15*
>2 transfers 2.81E-98* 7.37E-178* 6.54E-99*
Settlement size
<1000 1000-5000
5000-10000 10000-50000 50000-100000
100000-200000 >200000 <1000 pop
1000-5000 pop 6.74E-10*
5000-10000 pop 1.22E-14* 0.2429
10000-50000 pop 5.22E-31* 6.70E-16* 1.89E-18*
50000-100000 pop 4.98E-54* 4.36E-52*
4.69E-100* 1.20E-112* 100000-200000
pop 1.40E-15* 0.6581
1 2.78E-06* 3.99E-46*
>200000 pop 1.59E-53* 5.65E-49*
3.31E-79* 8.79E-43* 6.32E-130*
3.92E-34*
Urban density
<5000 5000-10000
10000-15000
15000-
20000 >20,000 <5,000 pop/km2
5000-10000
10000-LIFESTYLE FACTORS Car availability
Yes Not Yes
Not 2.22E-221* Attendance at UAB
1 day 2 days 3 days 4 days 5 days 6 days 7 days 1 day
2 days 0.1691
3 days 0.69 0.2202
4 days 0.008391* 8.95E-08* 1.29E-06*
5 days 0.01333* 7.06E-08* 7.53E-07* 0.4603
6 days 0.005296* 3.40E-06* 7.46E-05* 0.2479 0.1259
7 days 0.1357 0.00106 0.01088 0.5588 0.7807 0.164
Role at UAB
Student <2 years Student <2 years Student <2 years Student <2 years Student <2 years Others
Student <2 years
Student <2 years 0.0003475*
Student <2 years 0.01668* 0.9038
Student <2 years 3.76E-19* 4.57E-08* 1.61E-05*
Student <2 years 1.95E-16* 1.06E-06* 2.30E-05* 0.6146
Others 0.02881* 0.1639 0.167 0.9223 0.8538
Daily stay at UAB
<4h 4h – 8h >8h <4h
4h – 8h 0.0006494*
>8h 0.005106* 0.451
BUILT ENVIRONMENT FACTORS Trip distance
<7.5 km 7.5 – 15 km 15 – 30 km >30 km <7.5 km
7.5 – 15 km 1.48E-116*
15 – 30 km 0* 1.31E-146* >30 km
0* 3.28E-151* 4.24E-217*
Public transport accessibility
Direct 1 transfer 2 transfers >2 transfers Direct
1 transfer 2.33E-11*
2 transfers 1.20E-18* 8.18E-15*
>2 transfers 2.81E-98* 7.37E-178* 6.54E-99*
Settlement size
<1000 1000-5000
5000-10000 10000-50000 50000-100000
100000-200000 >200000 <1000 pop
1000-5000 pop 6.74E-10*
5000-10000 pop 1.22E-14* 0.2429
10000-50000 pop 5.22E-31* 6.70E-16* 1.89E-18*
50000-100000 pop 4.98E-54* 4.36E-52*
4.69E-100* 1.20E-112* 100000-200000
pop 1.40E-15* 0.6581
1 2.78E-06* 3.99E-46*
>200000 pop 1.59E-53* 5.65E-49*
3.31E-79* 8.79E-43* 6.32E-130*
3.92E-34*
Urban density
<5000 5000-10000
10000-15000
15000-
20000 >20,000 <5,000 pop/km2
5000-10000
pop/km2 1.48E-21*
10000-15000pop/km2 1.00E+00 1.04E-05*
15000-20000pop/km2 2.92E-04* 6.94E-13*
8.94E-15*
>20,000 pop/km2 1.00E+00 0.5349 1.55E-15* 2.71E-318
* Statistically significant correlations at p-level 0.05
Source: Autonomous University of Barcelona
4. Conclusions and discussion
We can now answer the question at the beginning of this paper: How do lifestyle and built environment factors affect transport CO2 emissions in the case study of Autonomous University
of Barcelona? The question will be answered in the context of daily commutes to and from the UAB campus in Greater Barcelona (Spain). The obtained results demonstrate two interesting tiers of findings. First, lifestyle factors are as relevant as built environment factors in understanding transport CO2 emissions. Second, a combined analysis of lifestyle and built
environment factors can provide decision-makers with the required knowledge for integrated transport policy planning for CO2 mitigation.
A shift in how transport CO2 emissions are traditionally studied seems to be needed. Several
authors – for example Ma et al. (2014) and Nicolas and David (2009) – have already indicated
that socio-demographic and lifestyle issues are crucial for understanding the patterns of CO2
transport emissions. Our findings confirm this assertion for the lifestyle factors car availability, weekly attendance at UAB, role at UAB and daily stay at UAB. The U-test revealed the existence of statistically significant differences in CO2 emissions at p-level 0.05 between the
variables car access and no car access as well as between attending UAB 3 days a week or less and attending 4 days or more: they strongly affected the choice of transport mode and consequently the production of CO2. Higher income levels were correlated to higher CO2
public transport dotation, settlement size and urban density) and transport CO2 emissions, as
also indicated by previous research, such correlations should be only contemplated as one part in understanding the production of CO2 from the transport sector.
The second tier of findings was based on the possibilities to design integrated transport policy packages for CO2 mitigation. As can be seen in this research, studying simultaneously the
influence of lifestyle choices and the built environment on CO2 production provide
decision-makers with a more comprehensive view on the driving forces behind motorized personal transport. The results show that UAB members with higher income levels (permanent staff) covered longer trip distances than those with lower income levels (mostly students), who also lived closer to the UAB campus. Therefore, combined policy packages linking income levels and trip distance would be more effective than other types of partial packages. Another relevant finding was the connection between settlement size and car availability. UAB members who lived in smaller settlement had higher car availability and vice versa. In conclusion, the
effectiveness of CO2 mitigation policies should be based on integrated and combined strategies
based on the connection between lifestyle and built environment factors.
It is worth to note that both the methodological design of the paper and the identification of transport CO2 emissions patterns in the specific context of the UAB campus within Greater
Barcelona is an initial step in this research field. Main limitations in this research are associated to the use of CO2 emissions coefficients, which are highly related to trip distance. The use of
other indicators such as carbon footprint can help to overcome these limitations in further research. Moreover, qualitative researches based on how university community perceive the modal choice can also help to gain more insights into the problem of carbon emissions. In this respect, future efforts could focus on the use of multivariate statistics to gain more insight into the existing correlations between lifestyle and built environment as well as on the design of backcasting scenarios on CO2 mitigation for application in Greater Barcelona.
Acknowledgements
This research was carried out whithin the framework of the research project Movilidad cotidiana
activa y saludable en entornos urbanos de proximidad. enfoques multimetodológicos: tracking living labs, encuestas de movilidad y estudios cualitativos, funded by Ministerio de Economía y Competitividad, Subdirección General de Proyectos de Investigación. Ref: CSO2016-74904-R.
References
AAMAAS, B.; BORKEN-KLEEFELD, J. & PETERS, G. P. The climate impact of travel behavior:
A German case study with illustrative mitigation options. In: Environmental Science & Policy, 33:
273-282. November 2013. DOI: https://doi.org/10.1016/j.envsci.2013.06.009
AHANCHIAN, M, & MANUEL BIONA, J. B. Energy demand, emissions forecasts and mitigation strategies modeled over a medium-range horizon: The case of the land transportation sector in Metro Manila. In: Energy Policy 66: 615-629. 2014
ALBERT, G. & D. MAHALEL. Congestion tolls and parking fees: A comparison of the potential
effect on travel behaviour. In: Transport Policy, 13 (6): 496-502. November 2006. DOI:
https://doi.org/10.1016/j.tranpol.2006.05.007
BANISTER, D. Planning more to travel less: Land use and transport. In: Town Planning Review,
70 (3), 313-319. 1999. DOI: http://dx.doi.org/10.3828/tpr.70.3.e7p3837505516833
BANISTER, D. Unsustainable transport: City transport in the new century. London, Routledge. 2005. 304 p.
BANISTER, D. The sustainable mobility paradigm. In: Transport policy, 15 (2): 73-80. March 2008. DOI: https://doi.org/10.1016/j.tranpol.2007.10.005
BART, IE. Urban sprawl and climate change: A statistical exploration of cause and effect, with
policy options for the EU. In: Land Use Policy 27 (2): 283-292. April 2010. DOI:
https://doi.org/10.1016/j.landusepol.2009.03.003
BEGG, D. & GRAY, D. Transport policy and vehicle emission objectives in the UK: is the marriage between transport and environment policy over? In: Environmental Science & Policy, 7
(3): 155-163. June 2004. DOI: https://doi.org/10.1016/j.envsci.2004.02.001
BERRITTELLA, M.; CERTA, A.; ENEA, M. & ZITO, P. Transport policy and climate change: How to decide when experts disagree. In: Environmental science & policy, 11 (4): 307-314. June 2008. DOI: https://doi.org/10.1016/j.envsci.2008.01.008
BERTOLINI, L.; CLERCQ, F. L. & STRAATEMEIER, T. Urban transportation planning in
transition. In: Transport Policy, 15 (2): 69-72. March 2008. DOI:
https://doi.org/10.1016/j.tranpol.2007.11.002
BHAT, C. R., & GUO, J. Y. A comprehensive analysis of built environment characteristics on household residential choice and auto ownership levels. In: Transportation Research Part B: Methodological, 41 (5): 506-526. June 2007. DOI: https://doi.org/10.1016/j.trb.2005.12.005
CERVERO, R. & KOCKELMAN, K. Travel demand and the 3Ds: Density, diversity and design.
In: Transportation Research, 2 (3): 199-219. September 1997. DOI:
https://doi.org/10.1016/S1361-9209(97)00009-6
CERVERO, R.; SARMIENTO, O. L.; JACOBY, E.; GOMEZ, L. F. & NEIMAN, A. Influences of built environments on walking and cycling: lessons from Bogotá. In: International Journal of
Sustainable Transportation, 3 (4): 203-226. June 2009. DOI:
http://dx.doi.org/10.1080/15568310802178314
CHOO, S. & MOKHTARIAN, P. L. What type of vehicle do people drive? The role of attitude and
lifestyle in influencing vehicle type choice. In: Transportation Research Part A: Policy and
Practice, 38 (3): 201-222. March 2004. DOI: https://doi.org/10.1016/j.tra.2003.10.005
DULAL, H.B. & AKBAR, S. Greenhouse gas emission reduction options for cities: Finding the “Coincidence of Agendas” between local priorities and climate change mitigation objectives. In:
Habitat International, 38: 100-105. April 2013. DOI:
https://doi.org/10.1016/j.habitatint.2012.05.001
EWING, R. & CERVERO, R. Travel and built environment. In: Journal of the American Planning
Association, 76: 265-294. May 2010. DOI: http://dx.doi.org/10.1080/01944361003766766
GÄRLING, T.; GILLHOLM, R. & GÄRLING, A. Reintroducing attitude theory in travel behavior research: The validity of an interactive interview procedure to predict car use. In: Transportation, 25 (2): 129-146. May 1998.
HICKMAN, R. & BANISTER, D. Looking over the horizon: Transport and reduced CO2
emissions in the UK by 2030. In: Transport Policy, 14 (5): 377-387. September 2007. DOI:
https://doi.org/10.1016/j.tranpol.2007.04.005
HICKMAN, R.; ASHIRU, O. & BANISTER, D., Transport and climate change: Simulating the options for carbon reduction in London. In: Transport Policy 17 (2): 110-125. March 2010. DOI:
https://doi.org/10.1016/j.tranpol.2009.12.002
HICKMAN, R.; ASHIRU, O. & BANISTER, D. Transitions to low carbon transport futures: strategic conversations from London and Delhi. In: Journal of Transport Geography, 19 (6):
1553-1562. November 2011. DOI: https://doi.org/10.1016/j.jtrangeo.2011.03.013
HYSING, E. Greening transport-explaining urban transport policy change. In: Journal of
Environmental Policy & Planning, 11 (3): 243-261. August 2009. DOI:
http://dx.doi.org/10.1080/15239080903056417
LIU, Y.; SONG, Y. & SONG, X., An empirical study on the relationship between urban compactness and CO2 efficiency in China. In: Habitat International, 41: 92-98. January 2014. DOI: https://doi.org/10.1016/j.habitatint.2013.07.005
MA, J.; HEPPENSTALL, A.; HARLAND, K. & MITCHELL, G. Synthesising carbon emission for
mega-cities: A static spatial microsimulation of transport CO2 from urban travel in Beijing. In:
Computers, Environment and Urban Systems, 45: 78-88. May 2014. DOI:
https://doi.org/10.1016/j.compenvurbsys.2014.02.006
MEGGERS, F.; LEIBUNDGUT, H.; KENNEDY, S.; QIN, M.; SCHLAICH, M.; SOBEK, W. & SHUKUYA, M. Reduce CO2 from buildings with technology to zero emissions. In: Sustainable
Cities and Society, 2 (1): 29-36. February 2012. DOI: https://doi.org/10.1016/j.scs.2011.10.001
MARQUET, O. & MIRALLES-GUASCH, C. Walking short distances. The socioeconomic drivers
for the use of proximity in everyday mobility in Barcelona. In: Transportation Research Part A:
Policy and Practice, 70: 210-222. December 2014. DOI:
https://doi.org/10.1016/j.tra.2014.10.007
MIRALLES-GUASCH, C. Las encuestas de movilidad y los referentes ambientales de los
transportes. In: EURE. Revista Latinoamericana de Estudios Urbano Regionales, 38(115), 33-45. September 2012.
MIRALLES-GUASCH, C.; MARTINEZ MELO, M. & MARQUET SARDA, O. On user perception of private transport in Barcelona Metropolitan area: an experience in an academic suburban space. In: Journal of Transport Geography, 36: 24-31. April 2014. DOI:
https://doi.org/10.1016/j.jtrangeo.2014.02.009. 2014
NAESS, P. Residential self selection and appropriate control variables in land use: travel studies. Transport Reviews, 29 (3): 293-324. 2009
NICOLAS, J. P. & DAVID, D. Passenger transport and CO2 emissions: What does the French
transport survey tell us?. In: Atmospheric Environment, 43 (5): 1015-1020. February 2009. DOI:
https://doi.org/10.1016/j.atmosenv.2008.10.030
OAKES, J. M.; FORSYTH, A. & SCHMITZ, K.A. The effects of neighborhood density and street
connectivity on walking behavior: The Twin Cities walking study. In: Epidemiologic Perspectives & Innovations, 4 (16): 113-224. 2007.
PITOMBO, C.S.; KAWAMOTO, E. & SOUSA. A.J. An exploration analysis of relationships
between socioeconomic, land use, activity participation variables and travel patterns. Transport Policy, 18 (2): 347-357. 2010.
SILVA, C. & PINHO, P. The Structural Accessibility Layer (SAL): Revealing how urban structures constrains travel choice. In: Environment and Planning A, 42 (11): 2735-2752. November 2010.
SONG, Y. & KNAAP, G. Measuring urban form. In: Journal of American Planning Association, 70 (2): 2220-2225. 2004.
SORIA-LARA J.A. & VALENZUELA-MONTES L.M. Diseño de un sistema de evaluación del
rendimiento ambiental en corredores de movilidad urbana. In: ACE, Architecture, City and
Environment, 9 (25): June 2014. DOI: http://dx.doi.org/10.5821/ace.9.25.3621
SORIA-LARA, J. A., MARQUET, O., & MIRALLES-GUASCH, C. The influence of location, socioeconomics, and behaviour on travel-demand by car in metropolitan university
campuses. Transportation Research Part D: Transport and Environment, 53, 149-160. 2017
SORIA-LARA, J.A.; LÓPEZ, A. A. & BENAVENTE, F. A. Explorando el uso de métricas
espaciales para identificar “entornos de movilidad” urbanos. Anales de Geografía de la Universidad Complutense, 34 (2): 185-208. 2014
SORIA-LARA, J.A.; VALENZUELA-MONTES, L.M. & PINHO, P. Using ‘Mobility Environments'
in Practice: Lessons from a Metropolitan Transit Corridor in Spain. In: Journal of Environmental
Policy & Planning, 17 (5): 553-572. December 2015. DOI:
http://dx.doi.org/10.1080/1523908X.2014.991779
SWITZER, A.; BERTOLINI, L. & GRIN, J. Transitions of mobility systems in urban regions: A heuristic framework. In: Journal of Environmental Policy & Planning, 15 (2): 141-160. January 2013. DOI: http://dx.doi.org/10.1080/1523908X.2012.746182