A new PET prototype for proton therapy: comparison
of data and Monte Carlo simulations
ABSTRACT: Ion beam therapy is a valuable method for the treatment of deep-seated and radio-resistant tumors thanks to the favorable depth-dose distribution characterized by the Bragg peak. Hadrontherapy facilities take advantage of the specific ion range, resulting in a highly conformal dose in the target volume, while the dose in critical organs is reduced as compared to photon ther-apy. The necessity to monitor the delivery precision, i.e. the ion range, is unquestionable, thus dif-ferent approaches have been investigated, such as the detection of prompt photons or annihilation photons of positron emitter nuclei created during the therapeutic treatment. Based on the measure-ment of the induced jS+ activity, our group has developed various in-beam PET prototypes: the
one under test is composed by two planar detector heads, each one consisting of four modules with a total active area of 10 x 10 cm2. A single detector module is made of a LYSO crystal matrix
coupled to a position sensitive photomultiplier and is read-out by dedicated frontend electronics. A preliminary data taking was performed at the Italian National Centre for Oncological Hadron Therapy (CNAO, Pavia), using proton beams in the energy range of 93-112 MeV impinging on a plastic phantom. The measured activity profiles are presented and compared with the simulated ones based on the Monte Carlo FLUKA package.
Contents
1 Introduction 1
2 Methods and materials 2
2.1 Experimental setup 2 2.2 Reconstruction algorithm 3 2.3 Data analysis and simulations 3
3 Results and discussion 3
4 Conclusion 5
1 Introduction
Proton therapy is a treatment modality of great interest in radiation oncology, because it allows for highly conformal dose distribution and improved sparing of critical structures as compared to treatments with photons. However, proton treatments are much more sensitive to uncertainties such as proton range errors, patient positioning errors, and anatomical variations compared to radiother-apy with photons. As a result, the dose delivered with protons may be significantly different from what was planned, hereby possibly erasing the beneficial effects of proton therapy. To ensure a successful dose delivery, it is highly desirable to have a direct verification of the particle range and delivered dose.
One of the most promising techniques for this purpose is Positron Emission Tomography (PET). PET imaging is based on the detection of the two annihilation gamma-rays following the decay of jS+ isotopes created during irradiation with hadrons. Non-invasive dose monitoring is
achieved by comparing the measured and pre-calculated jS+ activity distributions, during and/or
after therapeutic irradiation. PET is already successfully used in cancer treatments with parti-cles [1, 2] to verify the ion range. However the distal fall-off of the activity distribution from proton irradiation cannot directly be matched to the dose distribution, making it a challenging task. Information about the delivered dose can be obtained by measuring the activity profile, which are indirectly correlated [3]. In [4], we presented a PET prototype developed at the INFN and the Physics Department of the University of Pisa with an active area of 5 x 5 cm2, which already proved
its capability to acquire data under clinical conditions. Here, we test the performance of a new, larger, PET prototype with an active area of 10 x 10 cm2 regarding the determination of the activity
distal fall-off position in a PMMA target, irradiated with mono-energetic protons of energies in the range 93-112 MeV. This is done by comparing the reconstructed jS+ activity distributions from
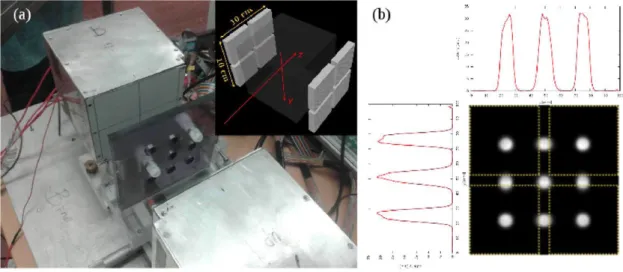
Figure 1. (a) The PET detector system and the phantom with two out of 9 FDG-fllled test tubes mounted.
Each tube has an outer diameter of 7 mm; the distance between two test tubes is 26 mm. The layout of the phantom was chosen so that the tubes are positioned either in the centre or along the gap between the four detector modules. The inset shows a schematic view of the PET detector system. Each of the two stationary heads contains four independent, closely mounted detector modules with an active area of roughly 5 x 5 cm2 each. The 6 mm gaps between the modules are visible. The beam direction is parallel to the z axis,
(b) Reconstructed image averaging 20 central slices in the y — z plane and the corresponding profiles along the y and z direction. The software allows reconstructing the activity contained in the tubes independently from their positioning along the y — z plane.
2 Methods and materials
2.1 Experimental setup
The compact PET detector system developed at the INFN and the University of Pisa is designed to be compatible with the installation on a gantry for beam delivery for in-beam data taking. It is composed of two stationary planar heads with an active area of 10 x 10 cm2, positioned 14 cm
apart, see figure 1. The best spatial resolution is achieved along the beam (¿) axis to optimize the determination of the distal fall-off of the induced activity. The plastic phantoms were centred in be-tween the two heads, irradiated by a horizontally impinging proton beam. The new device followed closely the layout of our former PET prototype ( 5 x 5 cm2), already described in detail in [4]. In
short, each head contains four detector modules, made of a position sensitive photomultiplier cou-pled to a scintillating LYSO crystal matrix (23 x 23 pixels, pitch 2.0 mm). Each module is read out by dedicated front-end electronics, based on short deadtime pulse discriminators and a series of peak detectors providing position and energy signals. A modular acquisition system has been used for detecting and storing the coincidences between opposing heads [9] with a coincidence window of 10 ns. The energy resolution is 18% at 511 keV (FWHM). The acquisition coincidence rate was in the range of a few kHz.
5 x 10 cm3 was irradiated with 5 x 10⁹ protons for about 30 seconds. The experimental data were
acquired for 20 minutes starting directly after the irradiation of the target (off-beam measurement).
2.2 Reconstruction algorithm
To reconstruct the acquired coincidences a fully three-dimensional list-mode Maximum Likelihood Expectation Maximization (MLEM) algorithm was implemented. For a detailed description of the algorithm the reader is referred to [10].
The system response probabilities needed for the MLEM are calculated on-the-fly using el-liptic tubes of response whose parameters are derived from Monte Carlo simulation. The software makes use of massive parallelism, therefore only few seconds per iteration are needed to recon-struct one acquisition. A total of five iterations are carried out for each acquisition as no further improvements were visually detected after the 5th iteration. The reconstructed images cover a Field of View (FOV) of 10 x 10 x 10cm3 with an isotropic voxel size of 1 mm.
2.3 Data analysis and simulations
The data analysis focused on the determination of the distal fall-off of the jS+ activity profiles
acquired for 20 minutes after the end of proton irradiation.
Starting from both experimental and simulated activity distributions, the activity profiles were made by summing all events within a cylinder with its centre corresponding to the beam axis and projecting the sum of each slice onto the z (beam) axis. To determine the position ¡i of the distal fall-off at the 50% level of the activity profile along z, a complementary error function was fitted to the data (see section 3, figure 2(b)). After having determined the proximal rising edge at the 50% level, it was used to set the z = 0 mm.
Monte Carlo simulations were performed using the FLUKA development version, providing information on the complete transport of the primary protons and the produced secondary particles. We have applied the default settings for hadron therapy. The geometry used in the simulation code consisted of the CNAO proton beamline [4] and a thick PMMA target of 5 x 5 x 10 cm3. We
scored the jS+ activity through the USRBIN parameter ACTIVITY at a time t = 20 minutes after
proton irradiation. According to the simulation the main activity contribution within 20 minutes after proton irradiation comes from the jS+ decaying isotopes 1 50 (Ti/2 = 122 sec) and nC (Ti/2 =
20.39 min).
3 Results and discussion
-20 -10 0 lü 20 30 40 50 60 70 80 -10 0 10 20 30 40 50 60 70 80
z [mm] z [mm]
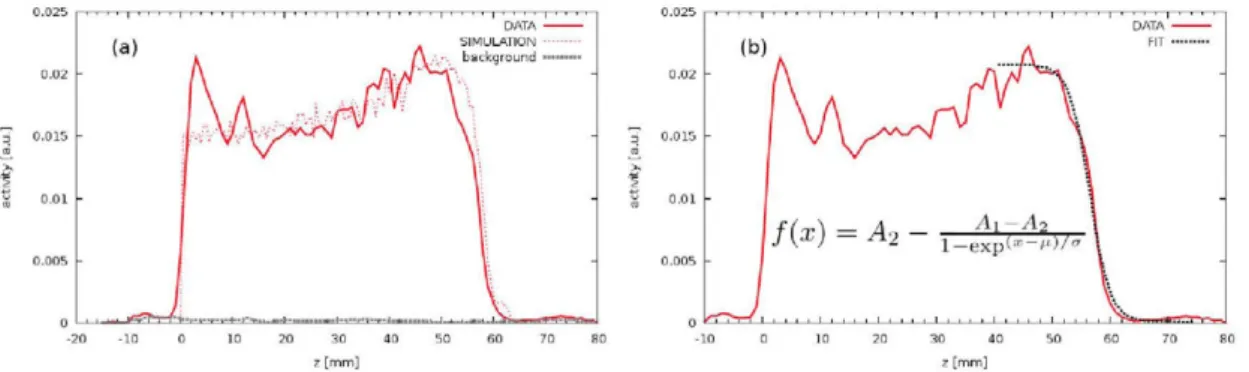
Figure 2. Figure (a) shows the normalized experimental and simulated activity profile along the z (beam)
axis acquired for 20 minutes after proton irradiation for a proton energy of 99 MeV. The positions of the 50% distal fall-off agree quite well. The dotted line corresponds to a constant reconstructed background can be seen all over the reconstructed volume. In figure (b) the complementary error function f(x) was fitted to the 99 MeV data yielding the plateau and base value of the profile (Al and A2, respectively), the position of the 50% distal fall-off (p,) and the slope (a) of the distribution.
As a result of the analysis on the data, taken at the CNAO therapy centre, figure 2(a) shows the non-quantitative activity profile along the beam (z) axis for the 99 MeV beam energy data set as well as the corresponding simulated profile 20 minutes after proton irradiation of a PMMA target.
The noise which is seen for z < 0 mm and after the distal fall-off is compatible with the recon-structed activity background which is shown in figure 2(a), dotted line. The activity background profile was taken from a region outside the irradiated phantom volume and is constant all over the reconstructed FOV.
For a direct comparison, the background corrected area under the profiles is normalized to 1. Despite small oscillations in the plateau region due to a preliminary reconstruction model for the experimental data, the figure shows that the positions of the fall-off for data and simulation agree within 1 mm, which was also verified for the other proton energies.
In figure 2(b) we show an example of the 99 MeV data fitted with the complementary error function returning the mean value ¡i and standard deviation of the distal 50% fall-off depths. The mean value ¡i was tested to be stable within 1 mm by varying the fitting region in z between 0 and 80 mm.
Results reported from now on are obtained using a fitting region of 30 mm around the activ-ity distal fall-off. The dependence of the fit on the counting statistics was studied by analysing subsets of the entire data acquisition. This was done by varying the diameter of the cylinder (see subsection 2.2) from 5 to 25 mm in 5 mm steps. For each profile, the fit yielded a robust value for ¡i, changing less than 1 mm. A diameter of 15 mm was chosen as default value, close to the beam diameter.
ST-80 75 70 ó 5 o0 55 50 45 40
1 . 1 1 , 1 . 1 1 , 1 . 1 1
DATA 1—•—1 ' SIMULATION • ....;
L
1
r
:f
• » • ' ' •
-i
....--i
i
- • ' , , , , ¡ , , , , ¡ , , , ,
I . I I , I . I .
• r. - -jd
, , , , ¡ , , , ,
i . i . , i . i i _
,.'' \
-:::íl
i j
i ;
i ;
• ;
1
, , , , ¡ , , , ,
-85 90 95 100 105
proton energy [MeV]
110 115 120
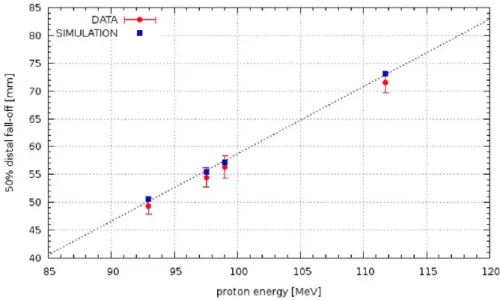
Figure 3. Comparison of the position of the 50% fall-off between FLUKA simulation and data for the energies 93, 97.5, 99 and 112 MeV. We determine a 1 mm accuracy for the determination of the distal fall-off for our 10 x 10 cm2 PET prototype. The error bar represents the a value of the fit. (We assume a
systematic error of 1 mm for all energies coming from the positioning of the phantom with respect to the detector heads, which is not shown here.)
4 Conclusion
In this study we have for the first time tested the performance of a new 1 0 x 1 0 cm2 PET prototype
in terms of the activity profile fall-off position for monoenergetic protons between 93 and 112 MeV impinging on a homogeneous PMMA target. The precision of the system to determine the proton fall-off position is of the order of 1 mm. The reconstruction algorithm is still under development and will be refined. The achieved spatial resolution is sufficient to extend this study to both multi-material and antropomorphic phantoms. As already demonstrated with our previous 5 x 10 cm2
PET prototype, full in-beam measurements are feasible [11]. An analysis of the in-beam data for the 10 x 10 cm2 prototype is currently being performed and will be presented in a future work.
A c k n o w l e d g m e n t s
This research has been supported by the company Ion Beam Applications (IBA),by the INFN-RT 60141 POR CRO FSE 2007-2013, Spain's Ministry of Economy (TEC2010-21619-C04-03, TEC2011-28972-C02-02 and AMIT-CDTI) and Comunidad de Madrid (ARTEMIS S2009/DPI-675 1802, FP7-Envision project funded by EU Seven Framework.
References
[1] W Enghardt et al., Charged hadron tumour therapy monitoring by means of PET, Nucl. Instrum. Meth. A 525 (2004) 284.
[3] F. Attanasi et al., Extension and validation of an analytical model for in vivo PET verification of proton therapy — a phantom and clinical study, Phys. Med. Biol. 56 (2011) 5079.
[4] S. Vecchio, A PET Prototype for "In-Beam" Monitoring of Proton Therapy, IEEE Trans. Nucl. Sci.
56 (2009) 51.
[5] www.cnao.it.
[6] G. Battistoni et al., The FLUKA code: description and benchmarking, AIP Conf. Proc. 896 (2007) 31.
[7] A. Ferrari et al., FLUKA: a multi-particle transport code, CERN-2005-10, INFN-TC-2005-11, SLAC-R-773 (2005).
[8] S. Rossi, The status ofCNAO, Eur. Phys. J. Plus 126 (2011) 78.
[9] G. Sportelli et al., Reprogrammable Acquisition Architecture for Dedicated Positron Emission Tomography, IEEE Trans. Nucl. Sci. 58 (2011) 695.
[10] G. Sportelli et al., Massively parallelizable LM-OSEM using an elliptical Gaussian model, Med. Phys. 40 (1) (2013).