Cepstral peak prominence: A comprehensive analysis
Ruben Fraile*, Juan Ignacio Godino-Llorente
Circuits & Systems Engineering Department, ETSIS Telecomunicacion, Universidad Politecnica de Madrid, Campus Sur, Carretera de Valencia Km.7, 28031 Madrid, Spain
A B S T R A C T
An analytical study of cepstral peak prominence (CPP) is presented, intended to provide an insight into its meaning and relation with voice perturbation parameters. To carry out this analysis, a parametric approach is adopted in which voice production is modelled using the traditional source-filter model and the first cepstral peak is assumed to have Gaussian shape. It is concluded that the meaning of CPP is very similar to that of the first rahmonic and some insights are provided on its dependence with fundamental frequency and vocal tract resonances. It is further shown that CPP integrates measures of voice waveform and periodicity perturbations, be them either amplitude, frequency or noise.
1. Introduction
Cepstral peak prominence (CPP) is an acoustic measure of voice quality that has been qualified as the most promising and perhaps robust acoustic measure of dysphonia severity [1]. Such a definite statement made by Maryn et al is based on a meta-analysis that considered previous results by Wolfe and Martin [2], Wolfe et al. [3], Heman-Ackah et al. [4], Halberstam [5], and Eadie and Baylor [6]; yet, later results are also consistent with that assertion, as those published by Awan et al. [7], Awan and Roy [8], Maryn et al. [9,10], Shueetal. [11], Alpan et al. [12], and Petterson et al. [13]. Conclu-sions from these have led some researchers to suggest the inclusion of CPP in the computation of some objective measures of dyspho-nia such as the acoustic indexes of dysphodyspho-nia severity proposed by Awan and Roy [8,7], the Acoustic Voice Quality Index [9,10], and the Cepstral Spectral Index of Dysphonia [13]. Being a widely tested measure of dysphonia severity, CPP has also been proposed as a relevant measure to assess the effect of different treatments. For instance, Hartl et al. proposed to use CPP in combination with other parameters to assess the effects of surgical treatments [14], Awan and Roy considered CPP in the evaluation of the effects of a therapy based on manual circumlaryngeal techniques [8], and Solomon et al found that CPP was useful for following patients' voice evolution after thyroidectomy [15].
Apart from its correlation with overall dysphonia, the relation between CPP and specific voice disorders has also been studied:
* Corresponding author. Tel.: +34 913367830.
E-mail addresses: [email protected] (R. Fraile), [email protected] (J.I. Godino-Llorente).
Merk et al. proposed the variability in CPP to be used as a cue to detect neurogenic voice disorders [16], Rosa et al. reported that the combination of CPP with other acoustic cues is relevant for the detection of laryngeal disorders [17], Hartl et al. [18] [19] and Bal-asubramanium et al. [20] concluded that patients suffering from unilateral vocal fold paralysis exhibited significantly lower values of CPP than healthy individuals, Kumar et al. arrived to a similar conclusion for the case of vocal fold nodules [21], and Watts and Awan found CPP relevant for discriminating hypo-functional from normal voices [22]. The consistent performance of CPP in the clin-ical evaluation of voice quality has inspired some researchers to propose its application to other purposes such as the assessment of speech intelligibility [23], the detection of cognitive load [24], or even the evaluation of the sexual appeal of voice [25].
may presently be considered as well-founded, although the specific degree of correlation may depend on the language of the speaker [32] and on the linguistic experience of the listener [33]. Further-more, CPP is also related to the physiological processes behind the production of breathiness, although variations in CPP occur due to several underlying anatomic and vibratory vocal-fold properties, so it is not feasible to identify the specific causes of a given change in CPP [29].
While CPP was firstly intended to measure breathiness, its use has been extended to the evaluation of overall voice quality, as mentioned before. Nevertheless, its usefulness for discriminating among voice qualities other than breathy seems to be limited, if any. Wolf and Martin [2] reported that CPP is a discriminant mea-sure for distinguishing strain from other dysphonic voice types (hoarseness and breathiness) but that does not help in further dis-tinctions among voice qualities; yet, the same authors later found that CPP calculated for band-pass filtered voices might be useful for the identification of voice qualities [3]. Similarly, Heman-Ackah et al concluded on the one hand that CPPs correlates with dys-phonia severity more than NHR (noise-to-harmonics ratio), APQ (amplitude perturbation quotient), RAP (relative average pertur-bation) or smoothed PPQ (pitch perturbation quotient) [4,34] and also with breathiness and roughness but, on the other hand, that correlation with roughness is not relevant [4]. A similar conclusion was reached by Awan and Roy [35]. More specifically, Eadie and Baylor pointed out that CPPs only correlates with roughness for running speech but shimmer is a better predictor of roughness for vowels [6]. Coherently, Howard et al. found out that voice pertur-bation measures calculated in time domain are more correlated to specific perceptual features than CPP [36]. Results published by Moers et al. show that CPP and CPPs calculated in running speech provide higher correlations with perceived breathiness and hoarseness than perturbation and noise measures, but for rough-ness, noise measures provide somewhat higher correlations [37]. When analysing the prediction of voice qualities, Lowell et al. also concluded that dysphonic-rough voice quality is less accurately classified by cepstral-based measures than dysphonic-breathy and normal voice qualities [38]. From the point of view of phonetics, Esposito pointed out that CPP can help in distinguishing breathy from modal or creaky voices, but cannot help in discriminating between modal and creaky [39]. On the contrary, a relevant cor-relation between CPP and roughness (in addition to breathiness) has been reported by Cannito et al. [40] and Shue et al detected some correlation between CPP and pressed voice quality [11].
In spite of its demonstrated usefulness for the clinical evalu-ation of voice, to present there is not a definite explanevalu-ation of what CPP actually measures. In fact, CPP shares with other cep-stral measures the lack of an intuitive interpretation relative to the underlying physiology of vocal fold vibration [41 ]. Hillenbrand et al. assumed that the height of the cepstral peak used to compute CPP is affected by the periodicity of the signal (or harmonic organisa-tion), the window size and the signal's total energy [26,27]. Their assumption was based on the high correlation measured between CPP and the autocorrelation peak for band-pass and high-pass fil-tered voices, though correlation was not so high for full spectrum signals. They also assumed that the CPP measure is similar in prin-ciple to a cepstrum-based signal-to-noise ratio calculation [26]; a similar assumption was also made by Awan et al. [42] when defin-ing the CPP as the dominance of the first rahmonic with respect to the background noise level. The relation with the periodicity of the signal has also been assumed by Ferrer et al. [43]. In turn, the relationship between CPP and the noise level present in the voice signal has been rigorously reasoned by Murphy [44], who showed the linear relation between cepstral peak, i.e. first rahmonic, and the average of the harmonics to between harmonics ratio in the log-arithmic spectrum. In order to have an additional insight into the
meaning of CPP, some authors have sought for correlations between CPP and other acoustic parameters. Heman-Ackah et al. reported greater correlations between CPP and pitch perturbation measures (RAP and sPPQ) than between CPP and measures of noise (NHR) and amplitude perturbation (APQ) [4]. On the contrary, Samlan et al. concluded that HNR is correlated to CPP [29]. Last, Cannito et al. measured relevant correlations between CPP and several measures of aperiodicity [40].
In this paper, we present an analysis of CPP that intends to provide an insight into its meaning and relation with perturbation parameters that on the one hand helps to interpret previous find-ings mostly reported from clinical studies and, on the other hand, complements previous studies, notably those published by Mur-phy [44], Alpan et al. [45] and Samlan and Story [31 ]. To carry out this analysis, we adopt a parametric approach in which we model voice production using the traditional source-filter model [46] so as to infer the meaning of the log-linear regression involved in the computation of CPP and we model the first cepstral peak (first rah-monic) as a Gaussian pulse in order to derive its meaning in spectral domain. Later, we use this combined approach to deduce the effect of signal windowing and sampling on the value of CPP and also to analytically seek for a relation between CPP and perturbation parameters such as shimmer, jitter and harmonics-to-noise ratio.
2. Analysis of CPP for infinitely long, continuous-time and noiseless voice signals
2.1. Definition of real cepstrum
Given a signal s(r), its real cepstrum, or power cepstrum, is equal to the Fourier transform of the logarithm of its power spectrum, according to the first definition of cepstrum [47]:
Q(q) = ^{log|S(f)|2} (1)
where S2(f) is the power spectrum of the signal:
S2(f) = ms(t)-s*(t-t)]} (2)
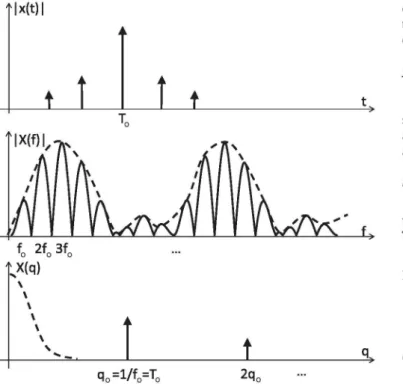
The cepstrum was primarily developed to detect echoes in seis-mic signals [47]. When a time signal is composed by echoes of an impulse (Fig. 1, top), the cross correlation between the origi-nal impulse and its echoes is a combination of impulses having its maximum located at the delay corresponding to the main echo. Being the cross correlation a sum of impulses, its Fourier trans-form is periodic. Its apparent frequency corresponds to the delay of the main echo, while secondary echoes surrounding the main one impose an amplitude modulation to the spectrum (Fig. 1, centre).
The logarithm previous to the Fourier transform in (1) allows converting the multiplicative effect of the modulating signal into an additive effect. Since the modulating signal in the spectrum is smoother than its periodic component, the cepstrum separates them, thus allowing a clearer identification of the delay of the main echo in cepstral domain (Fig. 1, bottom).
Later formalisation of cepstral analysis led to the definition of the complex cepstrum, which includes information of the phase spectrum [48]:
Cc(q) = Hlog S(f)} (3)
being:
iogscn = iogiscm+j-4(scn) (4)
|x(t)|
1
±
Fig. 1. When the spectrum of a signal is a periodic signal multiplied by an envelope (centre), the low quefrency part of the cepstrum (bottom) conveys information on the multiplicative envelope while the periodic component of the spectrum produces a corresponding sequence of impulses in cepstral domain (rahmonics).
2.2. Speech cepstrum
According to the source-filter model of speech production [46], a voiced speech signal s(r) can be modelled as:
s(t)=g(t)*v(t)*r(t) (5)
where g(t) is the glottal signal, v{t) is the impulse response of the vocal tract and r(r) is the effect of the acoustic wave radiation at the lips, modelled as an impulse response. Both v{t) and r(r) vanish with time, while g{t) is usually modelled as an indefinitely long train of glottal pulses.
In spectral domain we have:
S(f) = G(f)-V(f)-R(f) = G(f)-H(f) (6)
where H(f) is the combined effect of vocal tract and lip radiation. The power spectrum can be estimated as:
S2(f) = G2(f)-H2(f) (7)
According to the definition of cepstrum given in [47], the real cepstrum allows transforming the convolution in (5) and the prod-uct in (6) into an addition:
G(<7) = ^"{log \S(f)\2} = ^"{log \G(f)\2} + ^"{log \H(f)\2 (8) Yet, the computation of the inverse Fourier transform in (1) and (8) instead of the direct Fourier transform is usual, as indicated in [48,49]. According to the duality property of the Fourier trans-form [50], computing the inverse Fourier transform instead of the direct Fourier transform has the combined effect of reflection in the independent variable (quefrency) and multiplication by a constant. Since the speech signal s(r) is real, \S(f)\ is positive and symmetric with respect to the vertical axis. Then, log \S(f)\ is real and symmet-ric. Therefore, its Fourier transform is real and symmetric too. As a consequence, reflection with respect to the quefrency axis has no effect and the only difference between both approaches, i.e. direct and inverse Fourier transforms, is a multiplicative constant. Additionally, due to the logarithm operation, taking out the square
exponent in the power spectrum only has the effect of a multiplica-tive constant. Thus, both approaches can be considered equivalent, except for some multiplicative factor.
2.3. Effect of vocal tract and lip radiation on speech cepstrum
The vocal tract filter v{t) in (5) is usually modelled as an all-pole system; in turn, lip radiation r(r) is commonly assumed to behave as a single-pole filter [46]. Therefore, H(f) in (8) can be modelled as an all-pole filter:
H(f):
HoIlpLiO^-Sp)
\co=7nf = H(M)\(o=2jtf (9)where np is the number of poles and sp are the poles themselves.
Taking the logarithm of the modulus we get:
np
E»
p=i
log | H f » | = log |H0| - > , log \jco - sp\
The real cepstrum can then be calculated as:
np
Q(q) = ^{log |H0|} - ^ > { l o g \jco - sp\}
p=i
Solving we get (see Appendix A for details):
(10)
(11)
/ "rp , , "cp
1 Tr\eak\q\ ^ A
Cr(q) = 27T-logH0-<5(q) + — • I } ^ ^ ~ + 2 ^C O s ( f t ) , < 7 )'
e°ilg|
(12)
where <5( •) is the Dirac delta function, nrp is the number of real
poles in (9), ncp is the number of complex conjugate pole pairs in
(9) and o\ and &>/ respectively are the real and complex parts of such poles. Note that the all-pole system that models the effect of the vocal tract plus lip radiation is represented in cepstral domain by the combination of an impulse centred at zero quefrency plus a sum of negative exponentials (0^ < 0 if we assume that the vocal tract behaves as a stable system) and damped sinusoids.
Fig. 2 shows the responses of three simulated vocal tracts in cepstral domain. For quefrency values above a certain threshold the damped behaviour, linear decrease of the envelope in decibels, is self-evident.
2.4. Log-linear regression and vocal tract response
As outlined before, in cepstral analysis of speech it is commonly assumed that the glottal signal g(r) is periodic (or quasi-periodic) while vocal tract and lip radiation have a finite-length impulse response h{t). The convolution of both signals results in a peri-odic speech signal s{t) having a fundamental frequency (fa) equal to that of the glottal signal. With these assumptions, the cepstrum of s(r) has two well differentiated parts (Fig. 1): for high quefrencies (<J><Jo = l//o) it consists of a series of peaks (rahmonics) placed at multiples of q0 corresponding to the transformation of the spectral
l/(Jo)-f(Hz)
x105
X :
*....L3<
X X * v
X * X
X X x* x
X x x * *
X X . . . v . .X
x ; x
;*#*
1.5 1 0.5 • -0.5 -1 -1.5
-4000 -3000 -2000 -1000 Real {s) x 1 05 a
0 0
-50
i
H^i
-50^ - - - ^ ^ :
-100
-150
.Nrlh*L--100
-150
ZIITfflH
-100
-150
r ] ; I
HHj|
0.005 0.01 q(s)
a
0.015 0.02
1.5 1 0.5 0 -0.5 -1 -1.5
-2500 -2000 -1500 -1000 Real {s)
X : ^ \ ^
* x x x
A--50
o" -ioo
-150
^Ks
0.005
1.5
1
0.5
0
-0.5
-1
-1.5 x10
-10000 -5000
Real {s}
Fig. 2. Cepstral analysis of three different vocal tract shapes taken from [51 ]. Shapes correspond to vowels j\j (i on the graph), /a/ (a) and /u/ (U). The grey lines corresponds to transforms ofthe impulse response ofthe vocal tract simulated using the Kelly-Lochbaum model and the simulator described in [52] (Fourier transform on the left and cepstrum on the right). The middle column corresponds to the pole plots in the s-plane. The black line corresponds to the linear regression ofthe cepstral values computed in dB (right) and to the effect ofthe subtraction of such regression in frequency domain (left). Only values for q > 1.5 ms have been used for regression.
As the logarithm is a monotonic function, this is equivalent to stat-ing that the power spectrum also has a periodic component with the same period. Furthermore, for this to happen, it is not neces-sary that the signal, more precisely its autocorrelation function, is periodic in time domain.
Regarding the specific case of CPP, one of the key factors in its definition seems to be the cepstral log-linear regression, accord-ing to Heman-Ackah [53]. This log-linear regression is obtained in order to subtract its value from the cepstral peak (or rahmonic). Awan and Roy proposed to consider only cepstral values corre-sponding to <j>2ms for regression, arguing that values for lower quefrencies mainly correspond to the vocal tract [35]. Alpan et al put the limit in q = 1 ms [ 12]. Recalling Eq. (12), if the vocal tract plus lip radiation response consisted in a one-pole system, subtracting the log-linear regression would imply removing the effect of the whole response from the cepstrum. Since the system is multiple-pole, its cepstral representation is more complex, as depicted in Fig. 2. However, for quefrencies above a certain threshold a limited number of poles become dominant and the log-regression fits well the envelope ofthe cepstrum ofthe vocal tract plus lip radiation. Therefore, setting a minimum quefrency for the calculation ofthe log-regression implies not considering the part of the cepstrum which is affected by a greater number of poles, hence modelling only the most dominant ones.
The quefrency threshold below which the cepstrum ofthe vocal tract response departs from the log-linear behaviour depends on the specific configuration of the vocal tract and its associated all-pole model. Therefore, when a fixed threshold is selected for computing CPP (typically between 1 and 2 ms, as mentioned before) it is not surprising that the obtained value is affected by vowel type (i.e. vocal tract) [54]. This effect can be appreciated in Fig. 2. While for the first two vowels (/i/ and /a/) the log-linear descent of
the cepstral envelope happens for q > 2 ms, this threshold changes to <j>4ms for the third one (/u/). Thus, setting a fixed threshold ((Jthres = 1.5 ms in this case) implies not being able to model the
descent of the cepstral envelope equally well for all vocal tracts. It is then coherent that the averaging of CPP values for differ-ent articulatory configurations, that is, the computation of CPP from running speech, provides higher correlations with perceived dysphonia [55,5,4] and also measurements that are more robust against changes in utterances, both in length and phonemic con-tent [56]. Yet, one should bear in mind that the calculation of CPP from sustained vowels and from running speech leads to different statistical distributions ofthe obtained measurements [34].
The regression in cepstral domain can be mathematically expressed as:
20.1og10Crregr(<7) = b0 + h-\q\ —• Crregr(q) = 10(b°/20Mfibi/20> -™
= B0-eBi|<3l (13)
where bo and b\ are the regression coefficients and the definitions of Bo and B\ can be easily deduced from the previous equation. By calculating the inverse Fourier transform, in spectral domain we get:
log|Sregr(f)| 1 1 -2Bno°i B 1
2 2TT B\ + {2nff 2 j r Bi 1 + (27r//B1)2
(14)
In spectral domain, the subtraction of the cepstral regression line implies dividing the spectrum by the exponential ofthe previ-ous expression:
_ _ ^ o 1 1
Thus, subtraction of the cepstral regression line is approxi-mately the same as dividing the Fourier transform by fi = e-(Bo/2?rBi)
for low frequencies (f-> 0) and dividing it by 1 for high frequen-cies (f-> oo). The frequency threshold between both asymptotic behaviours approximately is/= (Bj /27T). An estimate of the value for this threshold can be obtained from Fig. 2. In that graph, the slopes of the regression lines are b\ ss -5.4 dB/ms for /i/, b\ ss -5.0 dB/ms for/a/, and b\ ss -1.9 dB/ms for /u/, which correspond to frequency thresholds equal to 99, 91 and 36 Hz, respectively. Since the fun-damental frequency of the voice signal frequently is above such thresholds and the formant resonances are above it, the subtrac-tion of the regression line in the voice cepstrum has little effect on the overall shape of the spectrum. It only affects the low fre-quency components, usually below the fundamental frefre-quency (see left plots in Fig. 2).
According to basic theory of linear systems [50], the poles asso-ciated to the longest responses (both in time and quefrency) are the nearest to the imaginary axis. In Fig. 2, the steepest regression corresponds to the vocal tract response having its poles furthest from the imaginary axis (/i/) and vice-versa. Consequently, the longest responses are also associated with the highest resonances in spectral domain. Therefore, the subtraction of the cepstral log-regression in the calculation of CPP theoretically would imply the compensation of the greatest resonances in the signal spectrum; to some extent, it should be a spectral flattening operation. How-ever, since only the tail of the vocal tract response is modelled by the regression, the flattening operation only affects the lowest frequencies of the spectrum.
2.5. log-linear regression and glottal pulses
The glottal signal g{t) in (5) is usually modelled as the convo-lution of a fix pulse waveform p(r) and a series of impulses that
account for the instants t^ at which the glottal pulses happen (e.g. [46]):
g(t) = p(t)* ^2ak-S(t-tk) (16)
where ak is the amplitude of the kth glottal pulse. Similarly to the
case of the vocal tract and the lip radiation, the glottal pulse wave-form p(r) is usually modelled as an all-pole signal, typically having two or three poles [57]. As a consequence, the previous analysis is also valid for the case of the glottal pulse. The effect of the cepstral log-linear subtraction on the signal spectrum is also similar to the case of the vocal tract (see Fig. 3): only very low frequencies are affected.
Thus, the main effect of the subtraction of the cepstral regres-sion is on very low frequencies; so its effect on the overall voice spectrum may be neglected. In other words, what CPP measures in spectral domain is basically the same as what is measured by the cepstral peak, or first rahmonic. This is consistent with the findings of Alpan et al. [45] regarding the similar correlations with perceptual rates that can be obtained CPP and the first rahmonic.
2.6. Relationship between cepstral peaks and spectrum
As illustrated in Fig. 1, the low-quefrency part of the cepstrum represents the smooth variations of spectral amplitude, which com-monly are associated to H(f) for speech signals [46]. In contrast, the periodic part of the spectrum corresponds in cepstral domain to linearly spaced peaks called rahmonics. Having previously paid attention to the effect of H(f) on the cepstrum, we now analyse the case of the periodic component of the spectrum. To do that, let us assume that the high-quefrency part of the cepstrum can be
-"_ - 6 0 •
0.276 0.278 t(s)
0.02 0.03
q(s) f(Hz)
log |s M l
Fig. 4. Logarithmic spectrum corresponding to one Gaussian-shaped rahmonic hav-ing amplitude Ak and width ak.
modelled as the sum of a series of rahmonic peaks, the form of which correspond to Gaussian functions:
C
T(q) = J2
Ak-(
e-((q-k-qo)2/2-ffk 2) + g - t t q + k W / Z - ^2) - , (17)where it has been assumed that the real cepstrum is symmetric, which is the case for speech signals, as justified before. The ampli-tude of each rahmonic peak is fixed by the coefficient Ak while
its width is governed by ak. The spectral representation of such
rahmonic series can be computed by taking the inverse Fourier transform:
\og\S(f)\=^1{Q(q)}
CO
"k' + e~
YAk-^.e-H^.2.cos{kqo-co)
t-^ *J2%
E ^ W ^ e " ^ = )/2)cos(kg0-a>) (18)
Therefore, each rahmonic corresponds to one damped sinusoid in the logarithmic spectrum (Fig. 4). The damping of the sinusoid is affected by the width of the rahmonic crk while the amplitude of
the damped sinusoid is proportional to the product Ak • ak, which
is a measure of the rahmonic's energy.
2.7. Discussion on the relationship between cepstral peaks and spectrum
Murphy [44] interpreted the first rahmonic (i.e. the first cepstral peak) as a measure of the average of the harmonics to between harmonics ratio in the logarithmic spectrum. According to the rea-soning above, if we consider that the first rahmonic is usually dominant over the second and following ones then the envelope of the harmonic peaks in the logarithmic spectrum is:
l o g | Sh a r m( J ) | f « W l i a i e-{<y]{2xf)1/2)
--Ax
o\-/2JX
-((^(27tf)2)/2)
(19)
On the opposite, the envelope of the inter-harmonics valleys is:
l o g iSinter-harmCni ™ -A\<7\ •
1 /27T
. e-((^(27tf)2)2)
(20)
The average of the harmonics to between harmonics ratio (gmHNR, using Murphy's notation) can the be approximated in log-arithmic scale as:
gmHNR a / log | c 5 h a r m C f ) Id/
'inter-harmU J
log |Sharm(/')|d/ - / log |Sinter_harm(/)|df
o Jo
: 2 A l ai._i_.e-((a2(2xf)2))/2df
12%
(21)
This integral corresponds to the value of a Gaussian distribution function at is median point [58]. Therefore:
gmHNR a 2AX ••A, (22)
Since A\ is the magnitude of the first rahmonic, our analysis is completely coincident with Murphy's conclusions when the mag-nitudes of second and following rahmonics are negligible when compared to the first one.
Being the height of the cepstral peak a measure related to the harmonic structure of the voice signal, it easily follows its close relation with the glottal signal. In fact, when the glottal signal is absent, the cepstral peak loses its relevance for assessing voice quality. This is the case of tracheo-oesophageal voice, whose qual-ity cannot be evaluated using CPP [59,60]. Similarly, while some researchers have calculated CPP from running speech without any attempt to previously remove unvoiced signal intervals (e.g. [27]), Lowell et all have recently shown that preserving unvoiced signal segments has the effect of compressing the average values of CPP mean and CPP standard deviation for all voice quality groups and, simultaneously, to increase their dispersion, hence providing more overlapped distributions [38]. Thus, CPP calculated from unvoiced signal segments seems not to be significant for the evaluation of voice quality. Similarly, it is known that increases in loudness are associated to increases in the relevance of the harmonic compo-nent of the voice signal with respect to non-periodic compocompo-nents [61]. Thus, voice intensity is related to the magnitude of the har-monics, as measured byAk • ak (see Fig. 4). This correlation between
the cepstral peak, or CPP, and voice intensity has been measured byAwanetal. [54].
The relationship between CPP and breathiness has already been mentioned in the introductory section. Apart from CPP, breathy voice quality is know to be correlated with the noise energy, mostly at high frequencies, and with the relative height of the first harmonic with respect to the rest [26-28]. High levels of high frequency noise imply that the highest harmonics of the periodic component of the signal are less relevant in the spectrum. This is associated to a reduction in the value of (\\ak) in Fig. 4. Similarly, a
relative increase in the relevance of the first harmonics with respect to the rest is also related to a narrowing of the spectral envelope in Fig. 4. For a rahmonic peak having a given energy Ak -ak, any
reduction in (\\ak) (increase in ak) corresponds to a proportional
reduction v\Ak, i.e. a reduction on the height of the cepstral peak.
So, the relation between CPP and breathiness can be explained by using this Gaussian model for cepstral peaks and assuming that the first one is much more relevant than the rest.
with the same model: any increase in the speed of a part of the glottal waveform is linked to an increase in the level of the high-frequency harmonics. In turn, this is related to an increase in (1 jcrk),
or decrease in ak. Since ak and Ak are inversely related, a more
prominent cepstral peak is produced. This relationship between CPP and the glottal waveform was also deduced by Shue et al [ 11 ].
3. Effect of windowing and sampling
The processing of infinitely long, continuous time signals is not feasible. Instead, discrete-time windowed signals are processed by nowadays systems. Thus, the effect of these two operations (windowing and sampling) on the cepstral peak should not be dis-regarded.
3.1. Windowing
A windowed signal can be expressed as:
sw(r) = s(r).w(r) (23)
where w(t) is null for r<0 and for t>x, being x the window length. If such a signal is sampled, the next discrete time signal is obtained:
sw[n]=s[n]-w[n]=s(nTs)-w(nTs) (24)
where Ts is the sampling period and w[n] is null for n<0 and
for n>L, being L the length of the discrete window. Samples of the Fourier transform of sw[n] can be obtained using the discrete
Fourier transform (DFT) [63]:
i - i
Sw(Ik) = }_^s[n] • w[n] • e-i " 2^ T- fk-.
n=0 L-Ts
•0<k<L (25)
Let us suppose that s[n] is periodic, being No its fundamental period, and that the window is rectangular: w[n] = 1 VO < n < I. Let us also assume that the windowed signal comprises more than
one period but its length may not be a multiple of No, that is, L = mNo+aNo,where m> 1 and 0 < a < l . T h e n :
(m+a)JV0-l
SW(fk): ^
mNo-l
= 53
n=0
s[n]-e-j-n-2nfk-Ts+ V ^ s[n]-e-j-n-2nfk-Ts (26) n=mJVo
Since we have assumed that s[n] is periodic, the first term in (26) is proportional to the coefficients of the Fourier series expan-sion corresponding to s[n] when fk • Ts = //No for integer values of
/ and it is null for the rest of cases [50]. The second term is a result of sampling the Fourier transform of a fraction a of the signal period:
J V n - l
S
w{f
k) = 27rm-^2s[l]S
fkTs1=0 No
(m+a)N0-l
+ V ^ s[n]-e-jn2jTfi<^
n=mJV0
(27)
being <5[-] the Kronecker delta.
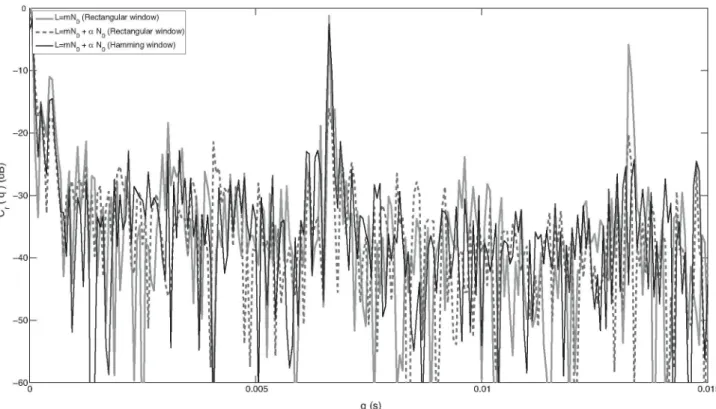
Fig. 5 shows the DFT of the voice signal corresponding to the glottal pulses plotted in Fig. 3. The impulsive structure of the DFT can be easily appreciated, with impulses or harmonics appearing at one every five samples (No = 5), in the graph corresponding to a rectangular window having a length that is an exact multiple of the fundamental period (a = 0). When this condition does not happen, i.e. a>0, the second term in (27) increments the values of the DFT samples at inter-harmonic locations due to the nulls of the Fourier transform of the window not being coincident with the frequen-cies of the DFT samples [63]. According to the reasoning before, such an increment directly affects the amplitude of the first cepstral peak (see Fig. 6). However, the use of a window having lower side lobes in spectral domain can help in keeping a difference between harmonic and inter-harmonic values similar to the case of a = 0 (continuous line in Fig. 5 for a Hamming window). Note that with respect to the first case, this graph does not have the same impul-sive waveform but one that resembles more a sinusoid. Yet, the
1
:
1 Q L=mN (Rectangular window)-
• L=mN + a N (Rectangular window) •-
x L=mN + a N (Hamming window)-
00 < •
o A
Q • • / \ mA • =
- K" 6
H
f \ f\ f °
A A
1 t • / 1 \" if *-' • J \
^ / \ •
A • 1 1 i • • M • A 1 / • \ . / \
/ • • r ' T • 1 " r 1 \ T 7 % " / i
1 i. \ T •
• f 1"" 1 «
- • T • r J " 1 I • I ~
:• 1 |
' °- k °- °" • =
'- 1 '
' °- k °- °" • =
L o o o \ 'A' 1 \ °
, ,""7\ o"- A •••
f° 1 o ° i i \ \- \ r ?""• "-M K
m,iH if ?1° l •\ \ \ h 1 /\
T 9 o \ \ ^f \
~-: v oP
J J / v°
\
\ / \ / 1 J
:_ o
; \ 0
\
)/ \ ° o o l \ / 1 M
:o ° 1J
0 \t Jo ° 1J
o0
° ^ A kj . \ / \ \~
o ° \ 1
0 ° o °0o ° o ]/ o A 0&° o oo oo w
r ° o \
° o °0o ° o ]/ o A 0&
° o oo oo w
:o '
° o °0o ° o ]/ o A 0&
° o oo oo w
0
;
-1 1 1 1 °
f(Hz)
Fig. 5. DFT of a windowed voice signal corresponding to the glottal flow depicted in Fig. 3 (fundamental period JV0 = 106, sampling period Ts = 1/16, 000). Empty circles
_ L=mN (Rectangular window) . - - L=mN + a N (Rectangular window)
L=mN + a N (Hamming window)
q ( s )
Fig. 6. Real cepstrum calculated from the spectral representation in Fig. 5.
amplitudes of both waveforms are similar. This results in the first rahmonic having a similar height but the next ones still differing (Fig. 6).
This analysis explains why the use of period-synchronous cep-stral analysis leads to values of the cepcep-stral peak that are higher than in the case of period-asynchronous analysis [45,44]. The fac-tor m in the first term of (27) accounts for the increase of energy in time domain that results from taking several periods for calculat-ing the Fourier transform. Normalisation would imply takcalculat-ing that factor out and multiplying the second term by a 1/m factor. The effect of this would be an increase in the resolution of the harmon-ics representation in spectral domain. As pointed out by Murphy [44], such an increased resolution implies a flattening of the cep-strum that results in a reduction of the first rahmonic. However, the overall cepstral energy included in the whole set of rahmon-ics is increased as the number of periods included in the window grows. This is consistent with the behaviour of the sum of rahmonic amplitudes reported in [64].
The graphs in Figs. 5 and 6 also show that the choice of an appro-priate window w[n] can help to reduce the impact of carrying out a pitch-asynchronous computation of CPP.
Conversely, as the limit frequency (or sampling rate) is increased, the cepstral terms corresponding to the rahmonic structure grow (recall (27)) while the between-rahmonic values do not. A second effect of any increase on the limit frequency is an improved resolution in the rahmonics of the cepstrum.
If frequency limitation is carried out harmonic-synchronously then the between-rahmonic values are reduced. Potentially, they would disappear for a perfectly periodic spectrum.
Therefore, limiting the spectrum, be it either by sampling or by spectral windowing, implies reducing the height of the cep-stral peaks. However, according to the interpretation of the spectral meaning of A\ explained before, if it is removed only the part of the spectrum for which the harmonics are not significantly higher than the inter-harmonics level, the effect of spectrum limitation on the value of A\ can be diminished. Furthermore, the previously enumerated effects explain why the cepstral peak and the sum of cepstral peaks grow with fundamental frequency and also why a harmonic-synchronously limited spectrum also provides higher cepstral peaks [44,64].
3.2. Sampling
Sampling in time domain corresponds to a windowing opera-tion in spectral domain, that is, limiting the maximum frequency of the resulting signal [50]. Consequently, sampling has in cepstral domain effects similar to that of windowing in spectral domain:
• Limiting the spectrum (or log-spectrum) implies convolution in cepstral domain, which results in a widening of the rahmonic peaks and a reduction of their maximum values Ak. Thus, in
prin-ciple sampling causes a reduction in the amplitude of the cepstral peak: the lower the sampling rate, the greater the reduction in the cepstral peak amplitude.
4. Effect of perturbations
In this section we analyse the relations between CPP and typical perturbation parameters used for measuring aperiodicities on the acoustic voice signal: amplitude perturbation, frequency perturba-tion and noise.
4.1. Amplitude perturbation
sP(f) =gp(t)*v(t)*r(t)= I ^a-8(t-kT0)\ * p(t) * v(t) * r(t)
\k=-co J
= ( £VS(t-feT
0)) */(t)
(28)A signal with amplitude perturbations (i.e. shimmer) is a quasi-periodic signal in which the amplitudes of the periods vary according to a certain random distribution. If we call mk the
ran-dom values obtained from such a distribution, which has zero mean, then:
SshimCO = I J 3 a • (1 + mk) • 5(t - /<T0) */(t)
\k=-co J
In spectral domain:
(29)
intervals. Therefore, for a voice signal affected by random shimmer, i.e. shimmer that can be modelled as white noise, to a great extent the harmonic amplitudes remain unaffected by shimmer variance. Such variance has its main impact on the between harmonic inter-vals. This result is consistent with the spectral interpretation of shimmer reported in [66].
The harmonic envelope is:
SharmCf) = ^F(f)W(f = 0) = ^F(J)W0
and its inter-harmonic counterpart:
CSHIM ^inter-harmU J ^ a'
27T\/fs •F(f)
(34)
(35)
Recalling (21), the first cepstral peak is proportional to the geo-metric mean of the harmonics to inter-harmonics ratio. For the case of shimmer:
iSshimCf )l = I Y, a •(1 + mk) • e~i2nm° l • lF(I)l = lY,a- e~i2nm°
k=—co k=—co
CO
+ ^2a-mk-e-j2lTfkT°\-\F(f)\ (30)
Note that the second term in (30) is the Fourier transform of a random sequence. If such random sequence is white noise with zero mean and variance cr2mM then, on average [65]:
|Sshim(f)l Y^ a • e->7nfkT» + acrSHii
•ifcni
To : = - c o
CSHIM
+ a •F(J)
where B is the signal bandwidth. For a windowed signal sampled at a rate/s = 1/TS, that is B=/s/2:
rfs/2
A\ (x I log Jo
SharmCf)
•/s/2
log
^inter-harmU )
2nJf~sW0
df>
•/s/2
log (a/T0)F(f)W0
2n^/fs •F(f)
C S H I M T Q d/
d/
(36)
Calculating the integral:
A\ a - log 2nJfsW0
C S H I M T Q log
2nJfsW0
To logcrsmM (37)
Therefore, for certain values of Co and C\ that depend on the fun-damental period T0, the sampling frequency fs and the time window
w(t):
(31) A1 a C o - C i • logcrSHiM (38)
Consequently, the amplitude of the first rahmonic has an inverse relation to shimmer.
isi
m(ni
a
J2
F
(
27t
r)
w
(
27tf
-
27t
To To
+a
.^™L.F(f)*W(f)
2-TtJh
(32)
W(f) is the Fourier transform of the time window w(t). In what follows we will assume that it has a much narrower bandwidth thanF(/); so F(f) * W(f) is a local averaging of F(f) and F(f) * W(f)^F(f). Thus:
isThimCni
ii>KM^-
2
-l
+q. g s™ -F(f) 2TtJfs
(33)
4.2. Frequency perturbation
Using the same notation as in (29), a quasi-periodic voice signal affected by frequency perturbation (i.e. jitter) can be modelled as:
Sjit(t) ••
J2a-S(t-kTo-T
k)\ *f(t)
(39)where xk is random variable. In what follows, it is assumed that xk
is uniformly distributed in the interval [- Tj/2, Tj/2]; consequently, its average is zero and its variance a?n = T,2/12 [65].
According to the spectral jitter model proposed by Vasilakis and Stylianou [67], the spectrum of Sjit(r) when jitter is cyclic can be
written as:
|C(f)|2 = ^ ^ ( l + c o s T2
(To-rk)k
k=-o To
s(f-2To) (40)
The first term in (33) corresponds to the spectral harmonic
4.3. Noise
\Gw(f)\2
T2
EO
T2
1 n
+ COS (To - rk)k
To
0 k=-co
lax - rk
w
"-i)
""-A)
V ^ I 1 + cos[/or] cos *k kn
To
W ( / - A ) (41)
Glottal noise can be modelled as the combined effect of two
components: pulsatile noise, that is, proportional in amplitude to
the glottal pulse, and additive noise
[69].
Therefore, a noisy voice
signal can be expressed as:
s
n( 0 = X ) a - ( l + n i ( 0 ) - P ( t - f c r
0) + n
2( 0 J * h ( 0
\k=-oo J
In \G"(f)\2 the harmonics correspond to even values of k.
There-fore, if VV0 = W(f= 0) then the harmonic envelope is:
lGrarmCf)l2 = ^ ( l + c o s [ 2 7 r / rk] )
and in the inter-harmonic positions (odd values of k):
M
m
2TtWo
L0
(1 -COS[27T/Tk])
(42)
(43)
IG;
The average spectral envelopes are (see (B.3) in Appendix B):
(44)
1
icr
armtni
2^ ^
+_ L s i n (
7r / T
J)
nter-harm
(f)\
2_W0 _ _
0 V K
T2
1 n
sin(7T/Tj)
And the ratio between them:
nCf)
nCf)
TT/TJ + sin(7r/Tj) = (7r/Tj/sin(7r/Tj)) + 1
7T/T| - sin(7T/T|) " (7T/T|/sin(7T/T|)) - 1 (46)
The first cepstral peak is then proportional to:
G|iarm(/)
log d/
^inter-harmU J
(7r/T|/sin(7r/T|)) + l log
(TT/TJ/sin ( T T / T , ) ) - 1 d/
(47)
Since |(TT/TJ/sin(7T/Tj))| >1 for/>0, the logarithm can be written as a series [58]:
log (7r/Tj/sin(7r/Tj)) + l
2
E
(7r/Tj/sin(7r/Tj))-l
1
d/
2n + l
m )
2n+l
d/ (48)
Using the solution of the integral reported in [68]:
(7r/Tj)/sin(7r/Tj)) + l
log d/
(7r/Tj/sin(7r/Tj))-l
l y f ( - D
r( » - r + (l/2))
3"
n=0 r=0 r ! ( 2 n - r + l ) !(49)
Therefore, the first cepstral peak is proportional to the inverse of the standard deviation of period perturbations (i.e. jitter):
1 1 Ai a
0]IT 2V3
(50)
= £ V p ( t - f e T o ) J *h(t)+ ^ a . n
1( t ) p ( t - / < T
0)
\k=-co / \k=-co /
*h(t) + n2(t)*h(t) (51)
The first term in (51) corresponds to the periodic component of the signal, the second term corresponds to a windowed glottal noise signal where the glottal pulse shape acts as a window and the third term is a white noise filtered by the vocal tract plus lip radiation response. Recalling that/(t) = p(t)* h(t), the spectral representation of (51) is similar to that of a signal with shimmer plus an additive noise component:
(
45) isncni
2nal b "
i>K>
+
S '
w
27tf-27T^)+a-^=-P-F(f)
hJ V2B
(52)
where P=/_°^|PCnid/. Using the result in (37):
Ai a Jj log
InJfsWo
( a
n l. P + ^ ) T
0log iTtJUWo To
log cr„l-P + Onl (53)
Thus, the relationship between the first cepstral peak and the glottal noise power is similar to the relationship between the first cepstral peak and shimmer, except for the dependence on the glot-tal pulse shape and amplitude.
4.4. Discussion on the relation between cepstral peak and perturbation measures
CD
Fig. 7. Relation between cepstral peak A] and standard deviation of shimmer, jitter and noise. The graph for shimmer and noise corresponds to (37) and (53), with
a = <T„I • P+(<T„2 /a) for the case of noise. The graph for jitter corresponds to (50) with a constant term in dB added for the sake of easing comparison between both graphs.
as measured by the amplitude parameter a, that has also been reported by Awanet al. [54]. Additionally, (53) highlights again the fact that CPP integrates information on noise level and pulse shape [62].
Last, it should be considered that the afore mentioned rela-tions have been analysed independently from each other. However, in the analysis of real signals, perturbations do not happen inde-pendently; this may explain the differences in the conclusions obtained by diverse researchers when analysing different sets of voice recordings.
5. Conclusions
CPP has been reported to be one of the most reliable and robust acoustic cues of dysphonia [1]. To a significant extent, its robust-ness comes from the fact that it does not need previous pitch detection and tracking [26], an advantage that makes it outperform other acoustic measures when voice is recorded in non-controlled environments (e.g. office or clinic) [70]. To date, insights on what CPP actually measures had been provided via the analysis of the first cepstral peak, or first rahmonic [44], and the analysis of cor-relations with video-endoscopic measures [62], voice production model parameters [29,31], other acoustic measures [4,29,34] and perceived voice quality [1,26,40,45].
In this paper we have firstly analysed the meaning of the cepstral log-linear regression involved in the calculation of CPP following a parametric approach based on the classical source-filter model of voice production. From such an analysis we have concluded that the subtraction of the log-linear regression from the value of the first rahmonic in order to calculate the CPP has little impact on the spectrum of the signal. As a consequence, the conclusions of Heman-Ackah [53] regarding the relevance of the regression may well be more related to the relevance of calculating CPP following a systematic algorithm than to the effect of the regression itself. A second consequence of our analysis is that the interpretations on the meaning of the first rahmonic pointed out by Murphy [44] can be extrapolated to CPP.
In a second step, we have studied the relationship between the first cepstral peak and the spectrum by assuming that the cepstral peak has a Gaussian shape. Our results are fully coincident with the conclusions of Murphy [44] and they allow concluding that cepstral analysis based on CPP is only meaningful for voiced signals, hence discarding unvoiced segments or tracheo-oesophageal voice. This analysis also explains the relation between CPP and breathiness unveiled by Hillenbrand et al [26] and subsequent results.
Thirdly, the impact of signal windowing and sampling on the cepstral peak has been studied. The reasons why pitch-synchronous and harmonic-synchronous cepstral analyses provided better indi-cators of voice quality [44,45] have been illustrated. We have also shown that by an appropriate choice of the framing window, the effects of carrying out a pitch-asynchronous analysis can be reduced, thus keeping the advantage of CPP of not requiring pitch estimation. Additionally, the same analysis explains the direct rela-tion between fundamental frequency and the amplitude of the cepstral peak. This relation together with the dependence between vocal tract response and the cepstral log-linear regression are plau-sible explanations for the variability of CPP with age [71] and sex [72].
Last, using an analytical framework we have shown that there is an inverse relation between the amplitude of the first cepstral peak and the variance of amplitude, frequency and noise pertur-bations of the voice signal. By considering both this last result and the above mentioned ones, one can confirm the previously pub-lished intuitions that CPP integrates measures of several features describing the aperiodicity and waveform of the acoustic voice sig-nal [26,40,62]. In turn, this integration of several measures explains the relation between CPP and overall dysphonia [1] and, simulta-neously, the fact that CPP is not particularly adequate for predicting specific aspects of voice quality, even when these are related to breathiness [73].
Acknowledgement
Appendix A. Real cepstrum of an all-pole function Appendix B. Average value of the spectral envelope of a jittered signal
The following relations are based on the properties of the Fourier transform (see e.g. [50]). As for the first term in (11), the Fourier transform of a constant is an impulse (Dirac delta):
^{log|H0|} = 27T-log|H0|-%) (A.1)
Regarding the second term in (11), given a complex pole sp, it
can be expressed as sp = av +j(op. Therefore:
:F{log \ja> - sp\} = :F{log | - CTP +j(co - cop)\}
^{log yaj+(w-wp)2
•F{\og(aj+((o-(oPY)} (A.2)
Additionally, if we apply the time differentiation property of the Fourier transform:
^{log \jco - Sp 1 1 J 2(co-cop) •T
2 jq [a2 +(co-cop)
Considering now the time shift property:
(A3)
^{log \jco - Sp 1 1 2 jq
g-jqojpyr 2(o
a2 +(D2
(A.4)
Applying the frequency differentiation property to (A.4):
According to (42) and (43), the envelopes of the spectrum of a windowed jittered signal can be expressed as
|G™vCf)|2 = ^ ( 1 -cospcos[2jr/rk]) (B.l)
with <p e {0, 7t\. If rk is uniformly distributed in [- Tj/2, Tj/2], then
the average spectral envelope can be calculated as:
| Gen v ( j ) | —
Solving:
T'/2 nW(
Tj/2 '0
—^ (1 + cos <p cos[ 27Tfrk ])—dxk (B.2)
\r |2 TTWo , TTWo 1
|GenvCf)| =—r + —rTCOSCp
Tj/2
cos[27r/T(<]dT(<
Tj/2
7tW0 ( 1
^ ^ l ^ c o s ,
TTWQ
2TT/ sin(27T/rk) Tj/2
rk=-Tj/2
T2
1 I T
1 + 2 ^ yc o s^ -2 s i n(2 7 r /2
W0 { 1 . , „>
J
2[
7T+W
C0S(P
sm\
7Tf
r!,
(B.3)^{log \joj-Sp\} = l - l - e-to** -J-^-(rl 1
2 jq j dq V 1 a2 + a>2
L
e-N-
P.l(r
l 1dq V 1 cr2 + a>2
(A.5)
The last Fourier transform in (A.5) corresponds to one basic transform pair. Considering that av < 0 for the all-pole system to
be stable:
r{\og\jw-Sp\} = - e-jqiop _ J±_ I >• .gOplql
q dq \ -2crp
I . e-k(oP . I . e-w ifq < o q 2
I . e-JWp . _ I . eW ifqr > 0
q 2
1 .e-]qo}p .gOplql
(A.6)
Since the speech signal is real valued, all poles either are real or they come in complex-conjugate pairs. If we assume that the system has nrp real poles (cop = 0) and 2 • ncp complex poles so that
nr p+2-nCp=np then:
eakl<il e-n0}i + eti°}i p=i
2|q|
^ { l o g ^ - s p , } ^ - ^ + ^ - ^ - ^ _ . e ^
l 1=1
/ "rp "cp
1
'E^+E
005
^-^
191
191
a = i 1=1
(A.7)
References
[1] Y. Maryn, N. Roy, M. De Bodt, P. Van Cauwenberge, P. Corthals, Acoustic mea-surement of overall voice quality: a meta-analysis, J. Acoust. Soc. Am. 126 (2009) 2619-2634.
[2] V. Wolfe, D. Martin, Acoustic correlates of dysphonia: type and severity, J. Commun. Disord. 30 (1997) 403-416.
[3] V.I. Wolfe, D.P. Martin, C.I. Palmer, Perception of dysphonic voice quality by naive listeners, J. Speech Lang. Hear. Res. 43 (2000) 697-705.
[4] Y.D. Heman-Ackah, D.D. Michael, G.S. Coding, The relationship between cep-stral peak prominence and selected parameters of dysphonia, J. Voice 16 (2002) 20-27.
[5] B. Halberstam, Acoustic and perceptual parameters relating t o connected speech are more reliable measures of hoarseness than parameters relating to sustained vowels, ORL 66 (2004) 70-73.
[6] T.L. Eadie, C.R. Baylor, The effect of perceptual training on inexperienced lis-teners' judgments of dysphonic voice, J. Voice 20 (2006) 527-544.
[7] S.N. Awan, N. Roy, C. Dromey, Estimating dysphonia severity in continuous speech: application of a multi-parameter spectral/cepstral model, Clin. Lin-guist. Phonetics 23 (2009) 825-841.
[8] S.N. Awan, N. Roy, Outcomes measurement in voice disorders: application of an acoustic index of dysphonia severity, J. Speech Lang. Hear. Res. 52 (2009) 482-499.
[9] Y. Maryn, P. Corthals, P. Van Cauwenberge, N. Roy, M. De Bodt, Toward improved ecological validity in the acoustic measurement of overall voice quality: com-bining continuous speech and sustained vowels, J. Voice 24 (2010) 540-555.
[10] Y. Maryn, M. De Bodt, N. Roy, The acoustic voice quality index: toward improved treatment outcomes assessment in voice disorders, J. Commun. Disord. 43 (2010)161-174.
[11] Y.L. Shue, G. Chen, A. Alwan, On the interdependencies between voice quality, glottal gaps, and voice-source related acoustic measures, in: Proc. Interspeech, Makuhari, 2010, pp. 34-37.
[12] A. Alpan, Y. Maryn, A. Kacha, F. Grenez, J. Schoentgen, Multi-band dysperiodicity analyses of disordered connected speech, Speech Commun. 53 (2011) 131-141.
[13[ E.A. Peterson, N. Roy, S.N. Awan, R.M. Merrill, R. Banks, K. Tanner, Toward validation of the Cepstral Spectral Index of Dysphonia (CSID) as an objective treatment outcomes measure, J. Voice 27 (2013)401-410.
[14] D.M. Haiti, J. Vaissiere, O. Laccourreye, D.F. Brasnu, Acoustic analysis of autol-ogous fat injection versus thyroplasty in the same patient, Ann. Otol. Rhinol. Laryngol. 112 (2003) 987-992.
[15] N.P. Solomon, S.N. Awan, L.B. Helou, A. Stojadinovic, Acoustic analyses of thyroidectomy-related changes in vowel phonation, J. Voice 26 (2012) 711-720.
of Vocal Emissions for Biomedical Applications, MAVEBA, Florence, 1999, pp. 83-85.
M.O. Rosa, J.C. Pereira, M. Greller, A.C.P.L.F. Carvalho, Signal processing and [44
statistical procedures to identify laryngeal pathologies, in: Proc. IEEE
Inter-nal Conf. Electronics, Circuits, and Systems, ICECS'99, vol. 1, Pafos, 1999, pp. [45
423-426.
D.M. Haiti, S. Hans, J. Vaissiere, D.F. Brasnu, Objective acoustic and aerodynamic [46
measures of breathiness in paralytic dysphonia, Eur. Arch. Oto Rhino Laryngol.
260(2003)175-182. [47
D.M. Haiti, S. Hans, J. Vaissiere, M. Riquet, D.F. Brasnu, Objective voice quality [48
analysis before and after onset of unilateral vocal fold paralysis, J. Voice 15
(2001)351-361. [49
R.K. Balasubramanium, J.S. Bhat, S. Fahim III, R. Raju III, Cepstral analysis of
voice in unilateral adductor vocal fold palsy, J. Voice 25 (2011) 326-329. [50
B.R. Kumar, J.S. Bhat, N. Prasad, Cepstral analysis of voice in persons with vocal [51
nodules, J. Voice 24 (2010) 651-653.
C.R. Watts, S.N. Awan, Use of spectral/cepstral analyses for differentiating nor- [52
mal from hypofunctional voices in sustained vowel and continuous speech contexts, J. Speech Lang. Hear. Res. 54 (2011) 1525-1537.
T. Haderlein, C. Moers, B. Mobius, F. Rosanowski, E. Noth, Intelligibility rat- [53
ing with automatic speech recognition, prosodic, and cepstral evaluation, in: I.
Habernal, V. Matousek (Eds.), Text, Speech, and Dialogue, Volume 6836 of Lee- [54
ture Notes in ComputerScience, Springer, Berlin Heidelberg, 2011, pp. 195-202.
T.F.Yap.J. Epps, E.Ambikairajah, E.H.C. Choi, Voice source features for cognitive [55
load classification, in: Proc. IEEE Internat. Conf. Acoustics, Speech, and Signal Processing - ICASSP 2011, Prague, 2011, pp. 5700-5703.
R.K. Balasubramanium, J.S. Bhat, M. Srivastava, A. Eldose, Cepstral analysis of
sexually appealing voice, J. Voice 26 (2012) 412-415. [56
J. Hillenbrand, R.A. Cleveland, R.L. Erickson, Acoustic correlates of breathy vocal quality, J. Speech Lang. Hear. Res. 37 (1994) 769-778.
J. Hillenbrand, R.A. Houde, Acoustic correlates of breathy vocal quality: dys- [57
phonic voices and continuous speech, J. Speech Lang. Hear. Res. 39 (1996)
311-321. [58
R. Shrivastav, CM. Sapienza, Objective measures of breathy voice quality
obtained using an auditory model, J. Acoust. Soc. Am. 114(2003) 2217-2224. [59
R.A. Samlan, B.H. Story, K. Bunton, Relation of perceived breathiness to laryn-geal kinematics and acoustic measures based on computational modeling, J.
Speech Lang. Hear. Res. 56(2013) 1209-1223. [60
A. Alpan, J. Schoentgen, Y. Maryn, F. Grenez, P. Murphy, Cepstral analysis of vocal dysperiodicities in disordered connected speech, in: Proc. Interspeech,
Brighton, 2009, pp. 959-962. [61
R.A. Samlan, B.H. Story, Relation of structural and vibratory kinematics of the
vocal folds to two acoustic measures of breathy voice based on computational [62
modeling, J. Speech Lang. Hear. Res. 54 (2011) 1267-1283.
B. Blankenship, The timing of nonmodal phonation in vowels, J. Phonetics 30 (2002) 163-191.
CM. Esposito, The effects of linguistic experience on the perception of phona- [63
tion.J. Phonetics 38 (2010) 306-316.
Y.D. Heman-Ackah, R.J. Heuer, D.D. Michael, R. Ostrowski, M. Horman, M.M. [64
Baroody, J. Hillenbrand, R.T. Sataloff, Cepstral peak prominence: a more reliable
measure of dysphonia, Ann. Otol. Rhinol. Laryngol. 112(2003)324-333. [65
S.N. Awan, N. Roy, Acoustic prediction of voice type in women with functional
dysphonia, J. Voice 19 (2005) 268-282. [66
D.M. Howard, E. Abberton, A. Fourcin, Disordered voice measurement and
audi-tory analysis, Speech Commun. 54 (2012) 611-621. [67
C Moers, B. Mobius, F. Rosanowski, E. Noth, U. Eysholdt, T. Haderlein,
Vowel-and text-based cepstral analysis of chronic hoarseness, J. Voice 26 (2012) [68
416-424.
S.Y. Lowell, R.H. Colton, R.T. Kelley, S.A. Mizia, Predictive value and discriminant
capacity of cepstral- and spectral-based measures during continuous speech, l"^
J. Voice 27 (2013) 393-400.
CM. Esposito, An acoustic and electroglottographic study of White Hmong tone and phonation, J. Phonetics 40 (2012) 466-476.
M.P. Cannito, M. Doiuchi, T. Murry, G.E. Woodson, Perceptual structure of l ' °
adductor spasmodic dysphonia and its acoustic correlates, J. Voice 26 (2012),
818.e5-818.el3.
D.D. Mehta, R.E. Hillman, Voice assessment: updates on perceptual, acoustic, I ' *
aerodynamic, and endoscopic imaging methods, Curr. Opin. Otolaryngol. Head Neck Surg. 16(2008)211-215.
S.N. Awan, N.P. Solomon, L.B. Helou, A. Stojadinovic, Spectral-cepstral estima- I ' ^
tion of dysphonia severity: external validation, Ann. Otol. Rhinol. Laryngol. 122 (2013)40-48.
CA. Ferrer, M.S. De Bodt, Y. Maryn, P. Van de Heyning, M.E. Hernandez-Diaz, I7 3
Properties of the cepstral peak prominence and its usefulness in vocal qual-ity measurements, in: Internat. Workshop on Models and Analysis of Vocal
Emissions for Biomedical Applications - MAVEBA 2007, Florence, 2007, pp. 93-96.
P.J. Murphy, On first rahmonic amplitude in the analysis of synthesized aperi-odic voice signals, J. Acoust. Soc. Am. 120 (2006) 2896-2907.
A. Alpan, J. Schoentgen, Y. Maryn, F. Grenez, P. Murphy, Assessment of disor-dered voice via the first rahmonic, Speech commun. 54(2012)655-663. LR. Rabiner, R.W. Schafer, Digital Processing of Speech Signals, Prentice-Hall, 1978.
A.M. Noll, Cepstrum pitch determination.J. Acoust. Soc. Am. 41 (1967) 293-309. D.G. Childers, D.P. Skinner, R.C. Kemerait, The cepstrum: a guide to processing, Proc. IEEE 65 (1977) 1428-1443.
A. Oppenheim, R. Schafer, Homomorphic analysis of speech, IEEE Trans. Audio Electroacoust. 16 (1968) 221-226.
S. Haykin, B.V. Veen, Signals and Systems, John Wiley & Sons, 2001. B.H. Story, LR. Titze, Parameterization of vocal tract area functions by empirical orthogonal modes, J. Phonetics 26 (1998) 223-260.
R. Fraile, M. Kob, J.I. Godino-LIorente, N. Saenz-Lechon, V.J. Osma-Ruiz, J.M. Gutierrez-Arriola, Physical simulation of laryngeal disorders using a multiple-mass vocal fold model, Biomed. Signal Process. Control 7 (2012) 65-78. Y.D. Heman-Ackah, Reliability of calculating the cepstral peak without linear regression analysis, J. Voice 18 (2004) 203-208.
S.N. Awan, A. Giovinco, J. Owens, Effects of vocal intensity and vowel type on cepstral analysis of voice, J. Voice 26 (5) (2012), 670.el5-e20.
T. Haderlein, C. Moers, B. Mobius, E. Noth, Automatic rating of hoarseness by text-based cepstral and prosodic evaluation, in: P. Sojka, A. Horak, I. Kopecek, K. Pala (Eds.), Text, Speech, and Dialogue, Volume 7499 of Lecture Notes in ComputerScience, Springer, Berlin Heidelberg, 2012, pp. 573-580.
S.Y. Lowell, R.H. Colton, R.T. Kelley, Y.C Hahn, Spectral- and cepstral-based measures during continuous speech: Capacity to distinguish dysphonia and consistency within a speaker, J. Voice 25 (2011) e223-e232.
D.G. Childers, C.K. Lee, Vocal quality factors: analysis, synthesis, and perception, J. Acoust. Soc. Am. 90 (1991) 2394-2410.
M. Abramowitz, LA. Stegun, Handbook of Mathematical Functions, Dover Pub-lications, 1972.
R.P. Clapham, C.J. Van As-Brooks, M.W.M. Van den Brekel, F.J.M. Hilgers, R.J.J.H. Van Son, Automatic tracheoesophageal voice typing using acoustic parameters, in: Proc. Interspeech, Lyon, 2013, pp. 2162-2166.
K. Nagle, T. Eadie, Determining time- and frequency-based acoustic correlates of listener effort in tracheoesophageal speech, in: Proc. Internat. Conf. Advances in Quantitative Laryngology - AQL 2013, Cincinnati, 2013, pp. 99-100. P. Dejonckere, Effect of louder voicing on acoustical measurements in dyspho-nic patients, Logoped. Phoniatrics Vocol. 23 (2) (1998) 79-84.
D.D. Mehta, S.M. Zeitels, J.A. Burns, A.D. Friedman, D.D. Deliyski, R.E. Hillman, High-speed videoendoscopic analysis of relationships between cepstral-based acoustic measures and voice production mechanisms in patients undergoing phonomicrosurgery, Ann. Otol. Rhinol. Laryngol. 121 (2012) 341-347. A.V. Oppenheim, R.W. Schafer, J.R. Buck, Discrete-Time Signal Processing, Pren-tice Hall, 1999.
P.J. Murphy, Periodicity estimation in synthesized phonation signals using cep-stral rahmonic peaks, Speech Commun. 48 (2006) 1704-1713.
K.S. Shanmugan, A.M. Breipohl, Random Signals: Detection, Estimation, and Data Analysis, Wiley, 1988.
P.J. Murphy, Spectral characterization of jitter, shimmer, and additive noise in synthetically generated voice signals, J. Acoust. Soc. Am. 107 (2000) 978-988. M. Vasilakis, Y. Stylianou, Spectral jitter modeling and estimation, Biomed. Signal Process. Control 4 (2009) 183-193.
R.G. Medhurst, J.H. Roberts, Evaluation of the integral I„(b) = | j°° (SM. Vcos(ftx)dx, Math. Comput. 19 (1965) 113-117.
S. Fraj, F. Grenez, J. Schoentgen, Synthesis of breathy and rough voices with a view to validating perceptual and automatic glottal cycle pattern recogni-tion, in: Internat. Workshop on Models and Analysis of Vocal Emissions for Biomedical Applications - MAVEBA 2011, Florence, 2011, pp. 135-138. K. Leong, M.J. Hawkshaw, D. Dentchev, R. Gupta, D. Lurie, R.T. Sataloff, Reliabil-ity of objective voice measures of normal speaking voices, J. Voice 27 (2013) 170-176.
R. Vipperla, S. Renals, J. Frankel, Ageing voices: the effect of changes in voice parameters on ASR performance, EURASIP J. Audio Speech Music Process. 2010 (2010)525783.
G. Chen, X. Feng, Y.L. Shue, A. Alwan, On using voice source measures in auto-matic gender classification of children's speech, in: Proc. Interspeech 2010, Makuhari, 2010, pp. 673-676.
![Fig. 2. Cepstral analysis of three different vocal tract shapes taken from [51 ]. Shapes correspond to vowels j\j (i on the graph), /a/ (a) and /u/ (U)](https://thumb-us.123doks.com/thumbv2/123dok_es/6747826.828515/4.892.96.816.80.520/cepstral-analysis-different-shapes-shapes-correspond-vowels-graph.webp)
![Fig. 3. Analysis of the effect of cepstral log-regression subtraction o n a glottal signal obtained w i t h the simulator described i n [52]](https://thumb-us.123doks.com/thumbv2/123dok_es/6747826.828515/5.892.103.784.637.1072/analysis-cepstral-regression-subtraction-glottal-obtained-simulator-described.webp)

![Fig. 7. Relation between cepstral peak A] and standard deviation of shimmer, jitter and noise](https://thumb-us.123doks.com/thumbv2/123dok_es/6747826.828515/11.892.133.745.84.444/fig-relation-cepstral-standard-deviation-shimmer-jitter-noise.webp)