www.the-cryosphere.net/10/681/2016/ doi:10.5194/tc-10-681-2016
© Author(s) 2016. CC Attribution 3.0 License.
Thinning of the Monte Perdido Glacier in the
Spanish Pyrenees since 1981
Juan Ignacio López-Moreno1, Jesús Revuelto1, Ibai Rico2, Javier Chueca-Cía3, Asunción Julián3, Alfredo Serreta4, Enrique Serrano5, Sergio Martín Vicente-Serrano1, Cesar Azorin-Molina1, Esteban Alonso-González1, and José María García-Ruiz1
1Dept. of Geoenvironmental Processes and Global Change, Pyrenean Institute of Ecology, CSIC, Campus de Aula Dei, P.O. Box 13.034, 50.080 Zaragoza, Spain
2Dept. of Geography, University of the Basque Country, Prehistory and Archeology, Vitoria, Spain 3Dept. of Geography, University of Zaragoza, Zaragoza, Spain
4Dept. of Graphic Design and Engineering, University of Zaragoza, Huesca, Spain 5Dept. of Geography, University of Valladolid, Valladolid, Spain
Correspondence to: Juan Ignacio López-Moreno ([email protected])
Received: 10 August 2015 – Published in The Cryosphere Discuss.: 29 September 2015 Revised: 9 March 2016 – Accepted: 10 March 2016 – Published: 17 March 2016
Abstract. This paper analyzes the evolution of the Monte Perdido Glacier, the third largest glacier in the Pyrenees, from 1981 to the present. We assessed the evolution of the glacier’s surface area by analysis of aerial photographs from 1981, 1999, and 2006, and changes in ice volume by geode-tic methods with digital elevation models (DEMs) gener-ated from topographic maps (1981 and 1999), airborne li-dar (2010) and terrestrial laser scanning (TLS, 2011, 2012, 2013, and 2014) data. We interpreted the changes in the glacier based on climate data from nearby meteorological stations. The results indicate that the degradation of this glacier accelerated after 1999. The rate of ice surface loss was almost three times greater during 1999–2006 than dur-ing earlier periods. Moreover, the rate of glacier thinndur-ing was 1.85 times faster during 1999–2010 (rate of surface eleva-tion change = −8.98±1.80 m, glacier-wide mass balance = −0.73±0.14 m w.e. yr−1) than during 1981–1999 (rate of surface elevation change= −8.35±2.12 m, glacier-wide mass balance = −0.42±0.10 m w.e. yr−1). From 2011 to 2014, ice thinning continued at a slower rate (rate of surface elevation change = −1.93±0.4 m yr−1, glacier-wide mass balance= −0.58±0.36 m w.e. yr−1). This deceleration in ice thinning compared to the previous 17 years can be attributed, at least in part, to two consecutive anomalously wet win-ters and cool summers (2012–2013 and 2013–2014), coun-teracted to some degree by the intense thinning that occurred
during the dry and warm 2011–2012 period. However, lo-cal climatic changes observed during the study period do not seem sufficient to explain the acceleration of ice thinning of this glacier, because precipitation and air temperature did not exhibit statistically significant trends during the study period. Rather, the accelerated degradation of this glacier in recent years can be explained by a strong disequilibrium between the glacier and the current climate, and likely by other fac-tors affecting the energy balance (e.g., increased albedo in spring) and feedback mechanisms (e.g., heat emitted from recently exposed bedrock and debris covered areas).
1 Introduction
calculated for the Swiss Alps was−0.65 m w.e. yr (Fischer et al., 2015), which clearly exceeds the values presented by Huss et al. (2010) for the same region over the 20th century (close to−0.25 m w.e. yr−1). In the Sierra Nevada of south-ern Spain, the Veleta Glacier, which formed during the LIA, evolved into a rock glacier during the mid-20th century and has suffered marked degradation during the last two decades (Gómez-Ortiz et al., 2014).
The glaciers in the Pyrenees, which are among the south-ernmost in Europe (Grunewald and Scheithauer, 2010), have also undergone significant retreat. In 1850, these glaciers had an estimated area of 2060 ha, but this had decreased to 321 ha by 2008 (René, 2013). Since 1850, the different massifs have had variable reductions in area covered by ice, with a 59 % reduction in the Vignemale Massif and an 84 % reduction in the Posets–Llardana Massif (Gellatly et al., 1995; René, 2013). A total of 111 glaciers disappeared in the Pyrenees from 1850 to 2005, and only 31 actual glaciers (with ice mo-tion) remain. There has been a rapid glacial recession since the 1990s, and many of these glaciers face imminent extinc-tion. Chueca et al. (2005 and 2008) reported that the rates of glacial shrinkage during the last two decades of the 20th century and the beginning of the 21st century were similar to those observed from 1860 to 1900, immediately after the end of the LIA. A similar conclusion has been reached by Marti et al. (2015) for the Ossoue Glacier (French Pyrenees).
Most studies agree that global warming is responsible for the observed glacier shrinkage and the recent acceleration of this shrinkage and glacier thinning. The air temperature in-crease has been particularly strong since the 1970s in most mountain ranges of the world (Haeberli and Beniston, 1998; Beniston et al., 2003; Nogués-Bravo et al., 2008; Gardent et al., 2014). Global warming has increased the equilibrium line altitudes (ELAs) and reduced the accumulation area ra-tios (AARs) of glaciers, such that most glaciers are not in equilibrium with current climate (Mernild et al., 2013) and many cannot persist for much longer (Pelto, 2010). In the case of the Pyrenees, the annual air temperature has in-creased by a minimum of 0.9◦C since the culmination of the LIA (Dessens and Bücher, 1995; Feulliet and Mercier, 2012). More recently, Deaux et al. (2014) reported an
re-porting rates of loss (glacier-wide mass balance) of −0.36 and−0.39 m w.e. yr−1, respectively.
This paper focuses on the recent evolution of the Monte Perdido Glacier, the third largest glacier in the Pyrenees. We document changes in the glacier surface area from 1981 to 2006 and provide updated information on surface eleva-tion changes by comparing DEMs derived from topographic maps from 1981 and 1999 (Julian and Chueca, 2007), a new DEM obtained in 2010 from airborne lidar, and four succes-sive terrestrial laser scanning (TLS) surveys that were per-formed during the autumns of 2011, 2012, 2013, and 2014. We examined these data in connection with data on precipi-tation, snow depth, and air temperature since 1983 from the closest meteorological station, and three longer air temper-ature and precipitation records (1955–2013) from neighbor-ing stations. Identifyneighbor-ing changes durneighbor-ing recent years in this region is particularly important because in the 21st century snowfall accumulation has been higher and the air temper-atures slightly cooler than in the last decades of the 20th century. This shift is associated with a persistently positive North Atlantic Oscillation (NAO) index during the beginning of the 21st century (Vicente-Serrano et al., 2011; Buisan et al., 2015). The recent response of remnant ice bodies to this climatic anomaly is as yet unknown. Moreover, the availabil-ity of annual TLS data in recent years permits detailed exam-ination of the relationship between changes in climate and glaciers.
2 Study area and review of previous research on the Monte Perdido Glacier
The Monte Perdido Glacier (42◦4005000N 0◦0201500E) is
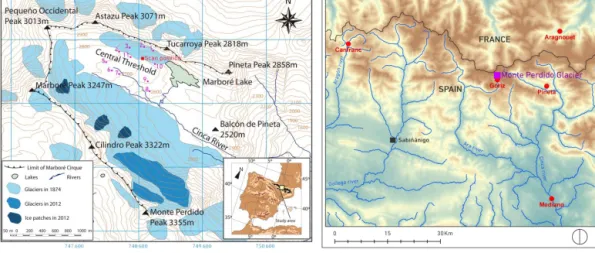
located in the Ordesa and Monte Perdido National Park (OMPNP) in the Central Spanish Pyrenees (Fig. 1). The ice masses are north-facing, lie on structural flats beneath the main summit of the Monte Perdido peak (3355 m), and are surrounded by vertical cliffs of 500–800 m in height (García-Ruiz and Martí-Bono, 2002). At the base of the cliffs, the Cinca River flows directly from the glacier and the surround-ing slopes, and has created a longitudinal west–east basin called the Marboré Cirque (5.8 km2).
Scientists have studied glaciers in the Marboré Cirque since the mid-19th century (Schrader, 1874), and many subsequent studies examined the status and extent of the ice masses and moraine features deposited during the LIA (Gómez de Llarena, 1936; Hernández-Pacheco and Vidal Box, 1946; Boyé, 1952). More recent studies have estab-lished the locations of moraines to deduce the dynamics and extent of LIA glaciers (Nicolás, 1981 and 1986; Martínez de Pisón and Arenillas, 1988; García Ruiz and Martí Bono, 2002; Martín Moreno, 2004) and have analyzed environmen-tal changes during the Holocene through the study of sedi-ments in Marboré Lake (Oliva-Urcía et al., 2013) and by dat-ing of Holocene morainic deposits (García-Ruiz et al., 2014).
The map of Schrader (1874), numerous old photographs, and the location of the LIA moraines (García Ruiz and Martí Bono, 2002) indicate a unique glacier at the foot of the large north-facing wall of the Monte Perdido Massif (Monte Per-dido, Cilindro and Marboré peaks) (Fig. 1). The map of Schrader (1874) distinguishes the Cilindro–Marboré Glacier, with three small ice tongues that joined at the headwall, from the Monte Perdido Glacier, which was divided into three stepped ice masses connected by serac falls until the mid-20th century. The glacier that existed at the lowest elevation was fed by snow and ice avalanches from the intermediate glacier, but disappeared during the 1970s (Nicolás, 1986; García-Ruiz et al., 2014). The two remaining glacier bod-ies, which are currently unconnected, are referred to in this paper as the upper and lower Monte Perdido Glaciers. The glacier beneath the Cilindro and Marboré peaks has trans-formed into three small and isolated ice patches (García-Ruiz et al., 2014). It is noteworthy that Hernández-Pacheco and Vidal Box (1946) previously estimated a maximum ice thick-ness of 52 m for the upper glacier and 73 m for the lower glacier. In 2008, 82 % of the ice cover present at the end of the LIA had already disappeared. The upper and lower ice bodies have mean elevations of 3110 and 2885 m (Julián and Chueca, 2007). Despite the high elevation of the up-per glacier, snow accumulation is limited due to the minimal avalanche activity above the glacier and its marked steepness (≈40◦).
No direct observation has been made of the current loca-tion of the ELA in the upper Cinca valley, but studies at the end of the 20th and beginning of the 21st century placed it at about 2800 m in the Gállego Valley, west of the OMPNP (López-Moreno, 2000), and at about 2950 m in the Maladeta Massif, east of the OMPNP (Chueca et al., 2005). The mean annual air temperature at the closest meteorological station (Góriz at 2250 m a.s.l., 2.7 km from the glacier) is 5.03◦C, although this station is on the south-facing slope of the Monte Perdido Massif. Assuming a lapse rate of 0.55 to 0.65◦C ev-ery 100 m, the annual 0◦C isotherm should be roughly at 2950 to 3150 m a.s.l. The climate in this region can be de-fined as high-mountain Mediterranean. Precipitation as snow can fall on the glacier at any time of year, but most snow ac-cumulation is from November to May, and most ablation is from June to September.
3 Data and methods 3.1 Comparison of DEMs
es-Figure 1. Monte Perdido study area and extent of ice cover at the culmination of the Little Ice Age (according to the map of Schrader, 1874) and in 2008. Red squares mark the scanning positions, numbered points indicate the positions of the fixed targets used for georeferencing and merging the different clouds of points. Red circles in the right panel inform of the location of the analyzed meteorological stations.
timate the surface elevation changes in the Monte Perdido Glacier. Two DEMs (1981 and 1999) were derived from to-pographic maps and one (2010) was from airborne lidar mea-surements. All three DEMs had a cell size of 2×2 m, and they were used in the context of a geographic information system (GIS), working under the European Datum ED50 (UTM pro-jection, zone 30).
The 1981 DEM was obtained from the cartography pub-lished by the Spanish Instituto Geográfico Nacional (IGN) (Sheet 146-IV, Monte Perdido; Topographic National Map Series, scale 1 : 25 000). This map was published in 1997 and its cartographic restitution was based on a photogrammet-ric flight in September 1981. The 1999 DEM was also de-rived from cartography published by the IGN (Sheet 146-IV, Monte Perdido; Topographic National Map Series MTN25, scale 1 : 25 000). It was published in 2006 and its carto-graphic restitution was based on a photogrammetric flight in September 1999. The 2010 DEM was obtained from an airborne lidar flight (MDT05-LIDAR) made by the IGN in September 2010 in the context of the National Plan for Aerial Orthophotography (NPAO).
The root mean squared error (RMSE) in elevation calcu-lated by the IGN for their digital cartographic products at 1 : 25 000 scale is ±1.5 and ±0.2 m for their lidar-derived DEMs. To verify these accuracies, we compared 2010–1999, 2010–1981 and 1999–1981 pairs of DEMs in areas of ice-free terrain situated near the studied glaciers. The results showed good agreement with the accuracy indicated by the IGN in almost all areas, although larger vertical errors were identified in several sectors with very steep terrain (slopes > 65◦ in most cases) located in the Monte Perdido glacial cirque (sharp-edged crests and abrupt cliffs linked to the ge-ological and structural disposition of the area). In those sec-tors, differences between the DEMs reached 10–15 m. As both the upper and lower Monte Perdido glaciers are placed
well outside those areas and have smoother topographical surfaces, it was assumed that the altimetric data provided by the IGN has an appropriate consistency over the glaciated terrain.
the glacier. A resampling procedure using cubic convolution was used to generate the final rectified images.
The most recent estimates of the evolution of the glacier were from annual TLS surveys. Lidar technology has devel-oped rapidly in recent years, and terrestrial and airborne lidar have been used in diverse geomorphology studies, including monitoring changes in the volume of glaciers (Schwalbe et al., 2008; Carturan et al., 2013b). The device employed in the present study is a long-range TLS (RIEGL LPM-321) that uses time-of-flight technology to measure the time between the emission and detection of a light pulse to produce a three-dimensional point cloud from real topography. The TLS used in this study employed light pulses at 905 nm (near-infrared), which is ideal for acquiring data from snow and ice cover (Prokop, 2008; Grünewald et al., 2010; Egli et al., 2011), a minimum angular step of 0.0188◦, a laser beam divergence
of 0.0468◦, and a maximum working distance of 6000 m.
When TLS is used for long distances, various sources of error must be considered, in particular, the instability of the device and errors from georeferencing the clouds of points (Reshetyuk, 2006). We used an almost frontal view of the glacier (similar to the view used for the photos shown in Fig. 4) with minimal shadow zones in the glacier and a scan-ning distance of 1500 to 2500 m. We also used indirect reg-istration, also called target-based registration (Revuelto et al., 2014), so that scans from different dates (September of 2011 to 2014) could be compared. Indirect registration uses fixed reference points (targets) that are located in the study area. Eleven reflective targets of known shape and dimen-sions (cylinders of 10×10 cm for targets located closer than 200 m, and 50×50 cm squares for longer distances) were placed at reference points on rocks situated 200 to 500 m from the scan station. Using standard topographic methods, we obtained accurate global coordinates for the targets by use of a differential global positioning system (DGPS) with post-processing. The global coordinates were acquired in the UTM 30 coordinate system in the ETRS89 datum. The fi-nal precision for the set of target coordinates was ±0.05 m in planimetry and ±0.10 m in altimetry. A total of 65 ref-erence points around the ice bodies (identifiable sections of rocks and cliffs) were used to assess measurement accuracy. Ninety percent of the reference points had an error of less than 0.40 m. Thus 0.4 m was taken as the uncertainty (error bars) when calculating the ice thinning and mass loss rates. The conversion of mean surface elevation change to annual mass budget rate was performed by applying a mean density of 900 kg m−3(Chueca et al., 2007; Marti et al., 2015). Use of this value assumes the absence of firn, which has a lower density. This assumption was mostly valid at the end of the study period, but likely some firn was present during the early 1980s (Fig. 3a suggests the presence of firn). Unfortunately, a lack of additional information forced us to adopt this gen-eralization, which may have led to a slight overestimation of the mass loss rate for 1981–1999.
3.2 Climatic data
The Spanish Meteorological Agency (AEMET) provided cli-matic data from the Góriz manual weather station, located at 2250 m a.s.l. on the southern slope of the Monte Perdido Massif. The absence of changes in instrumentation and ob-servation practices in the meteorological station since 1983, and the proximity of the meteorological station to the glacier (2.7 km), suggest that the station accurately recorded the cli-mate variability over the glacier. The climatic record con-sists of daily data of air temperature, precipitation, and snow depth. From these data, we derived annual series of max-imum and minmax-imum air temperatures for the main periods of snow accumulation (November–May) and ablation (June– September), precipitation during the accumulation season, and maximum snow depth in April (generally the time of maximum snowpack at this meteorological station). The lack of detailed meteorological or mass balance data over the glacier made it necessary to define the accumulation and the ablation seasons in a subjective manner based on our experience. We are aware that May and October are transi-tional months between accumulation and ablation conditions depending on specific annual conditions. However, we set these periods because June and November are the months when ablation and accumulation, respectively, become gen-erally evident over the surface of the glacier. The statisti-cal significance of the linear climate trends was assessed using the non-parametric correlation coefficient of Mann– Kendall’sτ-b(Kendall and Gibbons, 1990). Results obtained for Góriz were contrasted with those from three other ob-servatories (see Fig. 1) with precipitation (Pineta, Aragnouet and Canfranc), and air temperature (Mediano, Aragnouet and Canfranc) data for 1983–2013, and also for 1955–2013. The non-parametric Mann–Whitney U test (Fay and Proschan, 2010) was used to detect statistically significant differences in the medians of precipitation and air temperature when the 1983–1999 and 2000–2010 periods were compared.
4 Results
4.1 Climatic evolution and variability from 1983 to 2014
temper-Figure 2. Interannual fluctuations and overall trends (straight lines) of minimum and maximum air temperatures during the accumu-lation and abaccumu-lation periods, precipitation during the accumuaccumu-lation period, and maximum snow depth during April, based on data from the Góriz meteorological station (1983 to 2014). Box plots at the right of each panel show the interannual variability during the last three years of the study period (2011/12, 2012/13, and 2013/14), when terrestrial laser scanning measurements were available. Box: 25th and 75th percentiles, bars: 10th and 90th percentiles, dots: 5th and 95th percentiles, black line: median, red line: average.
ature range was larger for the accumulation period (∼5◦C) than for the ablation period (∼2.5◦C). Table 1 shows that the evolution of air temperature at Góriz is in line with that observed at the three other meteorological stations (Medi-ano, Aragnouet and Canfranc). No statistically significant trends were observed for maximum or minimum air tem-perature during the 1983–2013 period. When maximum and minimum air temperature data were considered on a monthly basis, the four analyzed observatories exhibited statistically significant increases only in May and June, and statistically significant decreases only in November and December. The Mann–Whitney test did not reveal statistically significant dif-ferences in the medians of the series for the accumulation and ablation seasons at any observatory when the periods 1983– 1999 and 2000–2010 were compared.
Precipitation at Góriz during the accumulation period also exhibited strong interannual variability, with a range of ap-proximately 600 to 1500 mm (Fig. 2e). The trend line showed a slight increase, but this was not statistically significant. Similarly, maximum snow accumulation during April
var-Figure 3. Interannual fluctuations of minimum and maximum air temperatures during the accumulation and ablation periods and pre-cipitation during the accumulation period at the Aragnouet, Can-franc, Mediano (only air temperature) and Pineta (only precipita-tion) stations for 1955–2013. Numbers give theτ-b values f the trends. Asterisks indicate statistically significant trends (p<0.05).
ied from less than 50 to 250 cm, and there was no evident trend during the study period (Fig. 2f). Monthly trend anal-ysis (Table 1) found a significant increase in precipitation at Góriz only during May, and near zero τ-b coefficients for most other months. Very similar results were obtained for the other three analyzed stations (Pineta, Aragnouet and Can-franc), with no statistically significant trends for the accu-mulation and ablation periods. Significant increases in pre-cipitation were observed at Aragnouet only in May, and at Pineta only in March. No statistically significant differences in the median precipitation during the accumulation and abla-tion seasons of the 1983–1999 and 2000–2010 periods were found at any of the analyzed meteorological stations.
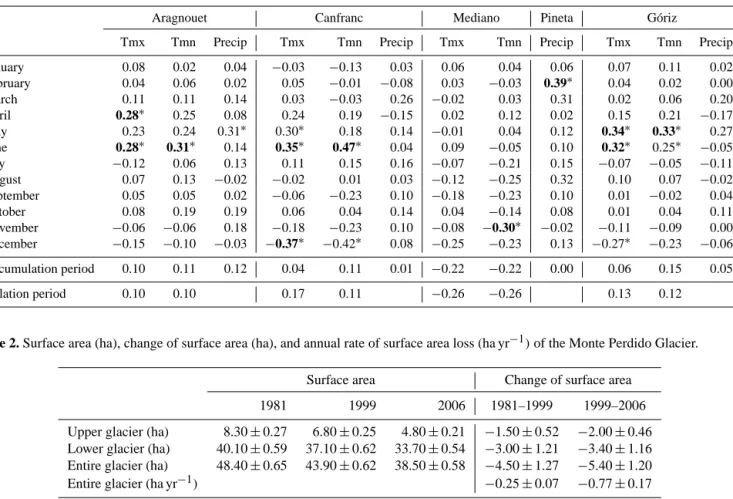
Table 1.τ-bvalues of the trends for the period 1983–2013 for air temperature and precipitation in the analyzed stations. Asterisks indicate statistically significant trends (p<0.05). Bold numbers are statistically significant differences in the medians of the period 1983–1999 and 2000–2010 according to the Mann–Whitney test.
Aragnouet Canfranc Mediano Pineta Góriz
Tmx Tmn Precip Tmx Tmn Precip Tmx Tmn Precip Tmx Tmn Precip
January 0.08 0.02 0.04 −0.03 −0.13 0.03 0.06 0.04 0.06 0.07 0.11 0.02 February 0.04 0.06 0.02 0.05 −0.01 −0.08 0.03 −0.03 0.39∗ 0.04 0.02 0.00 March 0.11 0.11 0.14 0.03 −0.03 0.26 −0.02 0.03 0.31 0.02 0.06 0.20 April 0.28∗ 0.25 0.08 0.24 0.19 −0.15 0.02 0.12 0.02 0.15 0.21 −0.17
May 0.23 0.24 0.31∗ 0.30∗ 0.18 0.14 −0.01 0.04 0.12 0.34∗ 0.33∗ 0.27
June 0.28∗ 0.31∗ 0.14 0.35∗ 0.47∗ 0.04 0.09 −0.05 0.10 0.32∗ 0.25∗ −0.05
July −0.12 0.06 0.13 0.11 0.15 0.16 −0.07 −0.21 0.15 −0.07 −0.05 −0.11
August 0.07 0.13 −0.02 −0.02 0.01 0.03 −0.12 −0.25 0.32 0.10 0.07 −0.02 September 0.05 0.05 0.02 −0.06 −0.23 0.10 −0.18 −0.23 0.10 0.01 −0.02 0.04 October 0.08 0.19 0.19 0.06 0.04 0.14 0.04 −0.14 0.08 0.01 0.04 0.11 November −0.06 −0.06 0.18 −0.18 −0.23 0.10 −0.08 −0.30∗ −0.02 −0.11 −0.09 0.00 December −0.15 −0.10 −0.03 −0.37∗ −0.42∗ 0.08 −0.25 −0.23 0.13 −0.27∗ −0.23 −0.06
Accumulation period 0.10 0.11 0.12 0.04 0.11 0.01 −0.22 −0.22 0.00 0.06 0.15 0.05
Ablation period 0.10 0.10 0.17 0.11 −0.26 −0.26 0.13 0.12
Table 2. Surface area (ha), change of surface area (ha), and annual rate of surface area loss (ha yr−1)of the Monte Perdido Glacier.
Surface area Change of surface area
1981 1999 2006 1981–1999 1999–2006
Upper glacier (ha) 8.30±0.27 6.80±0.25 4.80±0.21 −1.50±0.52 −2.00±0.46 Lower glacier (ha) 40.10±0.59 37.10±0.62 33.70±0.54 −3.00±1.21 −3.40±1.16 Entire glacier (ha) 48.40±0.65 43.90±0.62 38.50±0.58 −4.50±1.27 −5.40±1.20
Entire glacier (ha yr−1) −0.25±0.07 −0.77±0.17
Figure 2 also shows that 2011–2014, the period for which TLS measurements of annual glacier evolution were avail-able, showed extremely variable conditions. Mid-September 2011 to mid-September 2012 was one of the warmest recorded years (especially during the ablation period, which was in the 96th and 74th percentiles for maximum and min-imum air temperature, respectively) and with a rather dry accumulation period (27th percentile). The period of 2012 to 2013 had an accumulation period that was more humid than average (59th percentile) and the coolest recorded sum-mer (1st and 18th percentiles for maximum and minimum air temperatures, respectively), while the accumulation pe-riod of 2013 to 2014 was very wet (78th percentile) and slightly cooler than average, with air temperatures around or below the average (22th and 48th percentiles for maximum and minimum temperature, respectively) during the ablation period.
4.2 Glacier evolution from 1981 to 2010
Figure 4 shows photographs of the Monte Perdido Glacier taken in late summer in 1981 and 2011. A simple visual as-sessment shows the degree of degradation of the glacier
dur-ing this 30-year period. In 1981, the upper and lower glaciers were no longer united (they became disconnected between 1973 and 1978), and they exhibited a convex surface and sig-nificant ice depth with noticeable seracs hanging from the edges of the cliffs. Both ice bodies were heavily crevassed, with evidence of ice motion over the whole glacier. The pho-tograph from 2011 shows that the two ice bodies are further separated, as well as showing a dramatic reduction in ice thickness, evident in the concave surface, the disappearance of almost all seracs, and the retreat of ice from the edges of the cliffs. Crevasses are only observed in the eastern part of the lower glacier, indicating that the motion of the glacier has slowed or stopped in most of the two ice bodies. Moreover, there are rocky outcrops in the middle of the lower glacier and areas that are partially covered by debris deposits, pre-sumably originating from crevasses and rock falls in the up-per glacier.
Figure 4. Photographs of the Monte Perdido Glacier during late summer in 1981 and 2011.
2006, the glacier losses were −5.40±1.20 ha (a change of −2.00±0.46 ha in the upper glacier and −3.40±1.16 ha in the lower glacier), corresponding to an overall rate of −0.77±0.17 ha yr−1, more than three times the rate of the previous 18 years.
Comparison of the elevation of the glacier’s surfaces de-rived from the DEMs (1981 to 1999 vs. 1999 to 2010) also indicates an acceleration of glacier thinning over time (Fig. 5). During the 1981–1999 period, the ice thinning was −6.20±2.12 m in the upper glacier and −8.79±2.12 m in the lower glacier (−8.35±2.12 m overall); thus, the mean rates of glacier thinning were −0.34±0.11 m yr−1 and −0.48±0.11 m yr−1 (−0.46±0.11 m yr−1 overall or −0.42±0.10 m w.e. yr−1as a glacier-wide mass balance), re-spectively. Moreover, the changes in glacier elevation sur-face were not spatially homogeneous. No sector of either glacier showed increased thickness, but some small areas of the lower glacier showed only minor thinning, with de-clines in thickness of less than 5 m. The largest losses of glacier thickness were in the lower elevations and western regions of the upper and lower glaciers, with decreases that
Figure 5. Surface elevation change in the upper and lower Monte Perdido Glacier from 1981 to 1999 and from 1999 to 2010 based on comparison of DEMs.
exceeded 25 and 35 m, respectively. During the 1999–2010 period, the thinning was−7.95±1.8 m in the upper glacier and −9.13±1.8 m in the lower glacier (−8.98±1.80 m overall), corresponding to rates of−0.72±0.16 m yr−1and −0.83±0.16 m yr−1(−0.82±0.16 m yr−1overall or−0.73± 0.14 m w.e. yr−1), respectively. The spatial pattern of thin-ning resembled the pattern from 1981 to 1999, but areas of noticeable glacier losses were also observed further east-ward. The smallest decreases were observed in the higher elevation parts of the lower glacier and upper glacier, prob-ably due to more effective shading of these areas, and the greatest decreases were observed in the lower reaches and central-eastern parts of both ice bodies.
4.3 Evolution of the Monte Perdido Glacier from 2011 to 2014 from TLS measurements
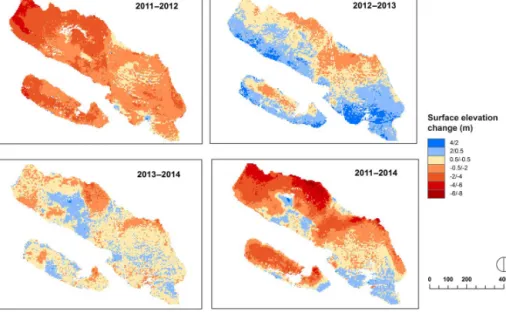
Figure 6. Surface elevation change of the upper and lower Monte Perdido Glacier based on terrestrial laser scanning from September of 2011 to 2012 (Fig. 5a), 2012 to 2013 (Fig. 5b), 2013 to 2014 (Fig. 5c), and 2011 to 2014 (Fig. 5d).
Figure 7. Surface elevation changes over the whole glacier, lower glacier, and upper glacier for the same four time periods examined in Fig. 5. Box: 25th and 75th percentiles, black line: median, red line: average, bars: 10th and 90th percentiles, dots: 5th and 95th percentiles.
distribution of change in surface elevation measured over the glacier for these periods.
The period of mid-September 2011 to mid-September 2012 was very dry during the accumulation period and very warm during the ablation period. These conditions led to dramatic glacier thinning, with an average decrease of −2.10±0.40 m (−2.08±0.40 m in the upper glacier and −2.12±0.40 m in the lower glacier). Ice thinning affected al-most the entire glacier (AAR=3.5 %), and was particularly intense in the western sectors of the upper and lower glaciers, where thinning exceeded 4 m. The few scattered points in-dicating depth increases in the middle of the lower glacier likely derive from a rising of the ice surface due to motion of existing crevasses.
Conditions were very different from 2012 to 2013, with a rather wet accumulation period and very cool ablation
was nearly three times greater during 1999–2006 than 1981– 1999, and the glacier thinning from 1999 to 2010 was al-most double that observed from 1981 to 1999. Acceleration in glacier thinning has also been reported for the Ossoue Glacier (French Pyrenees), where the mass balance during the period 2001–2013 (−1.45 m w.e. yr−1)was almost 50 % greater compared to that during 1983–2014 (−1 m w.e. yr−1) (Marti et al., 2015). Climatic analyses suggest that the recent acceleration in the thinning of the Monte Perdido Glacier cannot be explained solely by an intensification of climate warming or by a decline in snow accumulation. Climate data (1983–2014) of a nearby meteorological station, and three other Pyrenean meteorological stations, suggest that during most of the year air temperature has not exhibited statis-tically significant trends. The Mann–Whitney test did not reveal statistically significant differences in air temperature when the period 1983–1999 was compared to 2000–2010. Precipitation in the four analyzed stations during the accu-mulation period and maximum annual snow depth at Góriz were also stationary or slightly increased. Previous studies of the Pyrenees and surrounding areas showed that air tem-perature increased significantly throughout the 20th century, especially after the relatively cold period from the 1960s to the mid-1970s (López-Moreno et al., 2008; El Kenawy et al., 2012; Deaux et al., 2014). Similar trends were detected in the three air temperature series analyzed for this study cov-ering the 1955–2013 period. At the same time, there was a regional significant decline in snow accumulation from mid-March to late April/early May from 1950 to 2000 in the Pyre-nees (López-Moreno, 2005). The trends during this period of decreasing precipitation and milder air temperatures during winter and early spring can be related to changes in the NAO index (López-Moreno et al., 2008). More recent studies that used updated databases (including data of the 21st century) confirmed that a shift towards more negative NAO has af-fected the recent evolution of air temperature and precipita-tion over the Pyrenees. Thus, for the period 1983 to 2013, which does not include the effects of the cold and wet period of the 1960s to 1970s, no temporal trends of either variable are found near Monte Perdido. Vicente-Serrano et al. (2011) found that the increased occurrence of very wet winters
dur-this study (1980–2014) as a very strong positive anomaly of air temperature and a dry period compared to the period since the end of the LIA (Büngten et al., 2008; Deaux et al., 2014; Marti et al., 2015). More research is needed to fully assess the implications of the air temperature increase detected in May and June at the four analyzed meteorological stations. This warming could lead to less snow accumulation at the end of the accumulation season and a longer ablation period, and an early rise of albedo that may affect the mass and en-ergy balance of the glacier (Qu et al., 2014). Another factor that should be considered in future research is the effect of increases in the slope of the glacier due to greater thinning in the lower reaches. Increasing slope is expected to affect snow accumulation on the glacier and might constitute an-other feedback mechanism underlying the recent evolution of the glacier.
period 2011–2014, Fig. 6). Such a reduction in AAR would lead to an imbalance that would likely be exacerbated by neg-ative feedbacks. Because of this imbalance, the glacier is not able to recover ice losses during periods with favorable con-ditions (high accumulation and/or little ablation in the frame of the 1983–2014 period). This hypothesis is strongly sup-ported by our detailed TLS measurements from the last four years. In particular, these TLS data showed that two consec-utive anomalously positive years (2012/13 and 2013/14) did not allow the glacier to recover the losses from a negative year (2011/12). Thus, the glacier thinning during this three-year period was −1.93±0.4 m (−0.58±0.36 m w.e. yr−1), approximately one-quarter of the loss during 1981–1999, and during 1999–2010. The AAR for 2011–2014 was 16 %, and during a warm and dry year the ice thinning affects almost the whole glacier (AAR=3.5 %), indicating the lack of a persis-tent accumulation zone. Pelto (2010) observed that this is a symptom of a glacier that cannot survive. There can be years with mass gain, but mass loss occurs in most years and the retained snowpack of positive years is lost in negative years, such that there is no cumulative accumulation. Thus, the be-havior observed for the Monte Perdido Glacier during the study period is very likely explained by very negative mass balance in some years, as can be seen in Fig. 2. For exam-ple, air temperatures were very high in 2003, 2005 and 2012, and in the latter two years the high air temperatures were ac-companied by low winter precipitation. The feedback from decreased albedo and increasing glacier slope may also have played a key role in the recent acceleration of glacier thin-ning. Together, these findings indicate that the future of the Monte Perdido Glacier is seriously threatened, even under stationary climatic conditions. A ground-penetrating radar (GPR) survey of the lower glacier in 2010 reported a max-imum ice depth close to 30 m in the westernmost part of the lower glacier (unpublished report), suggesting that large ar-eas of this glacier may disappear within the next few years. This process may be accelerated by negative feedback asso-ciated with the recent rise of rocky outcrops in the middle of the glacier and the thin cover of debris, both of which may accelerate glacier ablation by decreasing the albedo and in-creasing the emissivity of long-wave radiation. The highly consistent spatial pattern of ice thinning in the last 30 years suggests that the westernmost part of this glacier will disap-pear first; the easternmost part will survive longer as a small residual ice mass because of greater snow accumulation dur-ing positive years and a lower rate of degradation. When the glacier is restricted to this smaller area, it is likely that its rate of shrinkage will decrease, as observed for other Pyre-nean glaciers (López-Moreno et al., 2006).
The future long-term monitoring of the Monte Perdido Glacier should provide important information on the year-to-year response of its mass balance to a variety of climatic con-ditions, and will allow detailed analysis of the role of posi-tive and negaposi-tive feedbacks in this much-deteriorated glacier. Thus, this glacier may serve as a model for studies of the
evolution of glaciers in other regions of the world that have similar characteristics.
Acknowledgements. This study was funded by two research grants:
“CGL2014-52599-P, Estudio del manto de nieve en la montaña española, y su respuesta a la variabilidad y cambio climático” (IBERNIEVE-Ministry of Economy and Competitivity), and “El glaciar de Monte Perdido: estudio de su dinámica actual y procesos criosféricos asociados como indicadores de procesos de cambio global” (MAGRAMA 844/2013). The authors are grateful for the support provided by the “Dirección General de Conservación del Medio Natural (Government of Aragón)” and to the staff of the Ordesa and Monte Perdido National Park during our field campaigns.
Edited by: E. Berthier
References
Abermann, J., Lambrecht, A., Fischer, A., and Kuhn, M.: Quantify-ing changes and trends in glacier area and volume in the Aus-trian Ötztal Alps (1969-1997-2006), The Cryosphere, 3, 205– 215, doi:10.5194/tc-3-205-2009, 2009.
Arenillas, M., Cobos, G., and Navarro, J.: Datos sobre la nieve y los glaciares en las cordilleras españolas. El programa ERHIN (1984–2008). Ed. Ministerio de Medio Ambiente y Medio Rural y Marino, Madrid, 231 pp., 2008.
Beniston, M.: Climatic change in mountain regions: a review of pos-sible impacts, Climatic Change, 59, 5–31, 2003.
Boyé, M.: Névés et érosion glaciaire, Revue de Géomorphologie Dynamique 2, 20–36, 1952.
Buisan, S. T., Saz, M. A., and López-Moreno, J. I.: Spatial and temporal variability of winter snow and precipitation days in the western and central Spanish Pyrenees, Int. J. Climatol., 35, 259– 274, 2015.
Buisan, S. T., López-Moreno, J. I., Saz, M. A., and Kochendorfer, J.: Impact of weather type variability on winter precipitation, tem-perature and snowpack in the Spanish Pyrenees, Clim. Res., in review, 2016.
Büngten, U., Frank, D., Grudd, H., and Esper, J.: Long-term sum-mer temperature variations in the Pyrenees, Clim. Dynam., 31, 615–631, 2008.
Carrivick, J. L. and Brewer, T. R.: Improving local estimations and regional trends of glacier equilibrium line altitudes, Geogr. Ann. A, 86, 67–79, 2004.
Carturan, L., Filippi, R., Seppi, R., Gabrielli, P., Notarnicola, C., Bertoldi, L., Paul, F., Rastner, P., Cazorzi, F., Dinale, R., and Dalla Fontana, G.: Area and volume loss of the glaciers in the Ortles-Cevedale group (Eastern Italian Alps): controls and im-balance of the remaining glaciers, The Cryosphere, 7, 1339– 1359, doi:10.5194/tc-7-1339-2013, 2013a.
graphic factors, J. Glaciol., 53, 547–557, 2007.
Chueca, J., Julián Andrés, A., and López Moreno, J. I.: The retreat of the Pyrenean Glaciers (Spain) from the Little Ice Age: data consistency and spatial differences, Terra Glacialis, 2008, 137– 148, 2008.
Cogley, J. G.: Geodetic and direct mass-balance measurements: comparison and joint analysis, Ann. Glaciol., 50, 96–100, 2009. Deaux, N., Soubayroux, J. M., Cuadrat, J. M., Cunillera, J., Este-ban, P., Prohom, M., and Serrano-Notivoli, R.: Homogénéisa-tion transfrontalière des températures sur le massif des Pyrénées, XXVII Colloque de l’Association Internationale de Climatolo-gie, 2–5 Julliet 2014, Dijon, France, 344–350, 2014.
Del Río, M., Rico, I., Serrano, E., and Tejado, J. J.: Applying GPR and Laser Scanner Techniques to Monitor the Ossoue Glacier (Pyrenees), J. Environ. Eng. Geoph., 19, 239–248, 2014. Dessens, J. and Bücher, A.: Changes in minimum and maximum
temperatures at the Pic du Midi in relation with humidity and cloudiness, 1882–1984. Atmos. Res., 37, 147–162, 1995. Egli, L., Griessinger, N., and Jonas, T.: Seasonal development of
spatial snow depth variability across different scales in the Alps, Ann. Glaciol., 52, 216–222, 2011.
El Kenawy, A., López-Moreno, J. I., and Vicente-Serrano, S. M.: Trend and variability of surface air temperature in northeastern Spain (1920–2006): linkage to atmospheric circulation, Atmos. Res., 106, 159–180, 2012.
Favey, E., Wehr, A., Geiger, A., and Kahle, H. G.: Some examples of European activities in airborne laser techniques and an appli-cation in glaciology, J. Geodynam., 34, 347–355, 2002. Fay, M. P. and Proschan, M. A.: Wilcoxon–Mann–Whitney or
t-test? On assumptions for hypothesis tests and multiple interpre-tations of decision rules, Statistics Surveys, 4, 1–39, 2010. Feuillet, Th. and Mercier, D.: Post-Little Ice Age patterned ground
development on two Pyrenean proglacial areas: from deglacia-tion to periglaciadeglacia-tion. Geogr. Ann. A, 94, 363–376, 2012. Fischer, M., Huss, M., and Hoelzle, M.: Surface elevation and mass
changes of all Swiss glaciers 1980–2010, The Cryosphere, 9, 525–540, doi:10.5194/tc-9-525-2015, 2015.
García Ruiz, J. M. and Martí Bono, C. E.: Mapa geomorfológico del Parque Nacional de Ordesa y Monte Perdido. Organismo Autónomo de Parques Nacionales, Madrid, 106 pp., 2002. García-Ruiz, J. M., Palacios, D., De Andrés, N., Valero-Garcés, B.
L., López-Moreno, J. I., and Sanjuán, Y.: Holocene and “Lit-tle Ice Age” glacial activity in the Marboré Cirque, Monte
Per-Solid Earth, 5, 979–993, doi:10.5194/se-5-979-2014, 2014. González-Trueba, J. J., Martín Moreno, R., Martínez de Pisón, E.,
and Serrano, E.: Little Ice Age glaciation and current glaciers in the Iberian Peninsula, The Holocene, 18, 569–586, 2008. Grunewald, K. and Scheithauer, J.: Europe’s southernmost glaciers:
response and adaptation to climate change, J. Glaciol., 56, 129– 142, 2010.
Grünewald, T., Schirmer, M., Mott, R., and Lehning, M.: Spa-tial and temporal variability of snow depth and ablation rates in a small mountain catchment, The Cryosphere, 4, 215–225, doi:10.5194/tc-4-215-2010, 2010.
Haeberli, W.: Glacier fluctuations and climate change detection, Ge-ogr. Fis. Din. Quat., 18, 191–195, 1995.
Haeberli, W. and Beniston, M.: Climate change and its impacts on glaciers and permafrost in the Alps, Ambio, 27, 258–265, 1998. Hernández-Pacheco, F. and Vidal Box, C.: La tectónica y la mor-fología del macizo de Monte Perdido y de las zonas de cumbres inmediatas en el pirineo Central, Pirineos, 4, 69–108, 1946. Huss, M., Hock, R., Bauder, A., and Funk M.: 100-year
mass changes in the Swiss Alps linked to the Atlantic Multidecadal Oscillation, Geophys. Res. Lett., 37, L10501, doi:10.1029/2010GL042616, 2010.
Julián, A. and Chueca, J.: Pérdidas de extensión y volumen en los glaciares del macizo de Monte Perdido (Pirineo central español): 1981–1999, Boletín Glaciológico Aragonés, 8, 31–60, 2007. Julián, A. and Chueca, J.: Pérdidas de extensión y volumen en los
glaciares del macizo de Monte Perdido (Pirineo central español): 1981–1999, Boletín Glaciológico Aragonés, 8, 31–60, 2007. Kendall, M. G. and Gibbons, J. D.: Rank correlation methods.
Ox-ford University Press, 272 pp., 1990.
López-Moreno, J. I.: Los glaciares del alto valle del Gaìllego (Piri-neo central) desde la Pequeña Edad de Hielo. Implicaciones en la evolucioìn de la temperatura, Geoforma Ediciones, Logroño, 77 pp., 2000.
López-Moreno, J. I.: Recent variations of snowpack depth in the central Spanish Pyrenees, Arct. Antarct. Alp. Res., 37, 253–260, 2005.
López-Moreno, J. I., Nogués-Bravo, D., Chueca-Cía, J., and Julián-Andrés, A.: Change of topographic control on the extent of cirque glaciers since the Little Ice Age, Geophys. Res. Lett., 33, L24505, doi:10.1029/2006GL028204, 2006.
future perspectives for Mediterranean mountains, Global Planet. Change, 66, 300–312, 2008.
López-Moreno, J. I., Fontaneda, S., Bazo, J., Revuelto, J., Azorín-Molina, C., Valero-Garceìs, B., Moraìn-Tejeda, E., Vicente-Serrano, S. M., Zubieta, R., Alejo-Cochachìn, J.: Recent glacier retreat and climate trends in cordillera Huaytapallana, Peru, Global Planet. Change, 112, 1–12, 2014.
Macias, D., Stips, A., and Garcia-Gorriz, E.: Application of the Sin-gular Spectrum Analysis Technique to Study the Recent Hia-tus on the Global Surface Temperature Record, PLOS ONE, 9, doi:10.1371/journal.pone.0107222, 2014.
Marshall, S.: Glacier retreat crosses a line, Science, 345, 872, doi:10.1126/science.1258584, 2014.
Marti, R., Gascoin, S., Houet, T., Ribière, O., Laffly, D., Con-dom, T., Monnier, S., Schmutz, M., Camerlynck, C., Tihay, J. P., Soubeyroux, J. M., and René, P.: Evolution of Ossoue Glacier (French Pyrenees) since the end of the Little Ice Age, The Cryosphere, 9, 1773–1795, doi:10.5194/tc-9-1773-2015, 2015. Martín-Moreno, R.: Comparación de dos glaciares:
Longyear-been (Spitsbergen) y Monte Perdido (Pirineos). Características y evolución desde la Pequeña Edad del Hielo, Ería, 63, 5–22, 2004.
Martínez de Pisón, E. and Arenillas, M.: Los glaciares actuales del pirineo español. En La nieve en el pirineo español, MOPU, Madrid, 287 pp., 29–98, 1988.
Marzeion, B., Cogley, J. G., Richter, K., and Parkes, D.: Attribution of global glacier mass loss to anthropogenic and natural causes, Science, 345, 919–921, 2014.
Marzeion, B., Leclercq, P. W., Cogley, J. G., and Jarosch, A. H.: Brief Communication: Global reconstructions of glacier mass change during the 20th century are consistent, The Cryosphere, 9, 2399–2404, doi:10.5194/tc-9-2399-2015, 2015.
Mernild, S. H., Lipscomb, W. H., Bahr, D. B., Radic, V., and Zemp, M.: Global glacier changes: a revised assessment of commit-ted mass losses and sampling uncertainties, The Cryosphere, 7, 1565–1577, doi:10.5194/tc-7-1565-2013, 2013.
Nicolás, P.: Morfología del circo de Tucarroya. Macizo de Monte Perdido, Pirineo Aragonés, Cuadernos de Investigación Geográ-fica, 7, 51–80, 1981.
Nicolás, P.: Morfología de un aparato glaciar: el glaciar nororien-tal de Monte Pedido. Pirineo de Huesca, in: Atlas de Geomor-fología, Alianza Editorial, Madrid, 189–207, 1986.
Nogués-Bravo, D., Lasanta, T., López-Moreno, J. I., and Araújo, J.: Climate change in Mediterranean mountains during the 21st century, Ambio, 37, 280–285, 2008.
Oliva-Urcía, B., Moreno, A., Valero-Garcés, B., and Mata, P.: Mag-netismo y cambios ambientales en registros terrestres: el lago de Marboré, Parque Nacional de Ordesa y Monte Perdido (Huesca), Cuadernos de Investigación Geográfica, 39, 117–140, 2013. Pastor, F.: Determinación del balance anual de masa y movimiento
del hielo en el glaciar de la Maladeta. Año hidrológico 2012– 2013, Technical report from ERHIN, Madrid, 68 pp., 2013. Pelto, M. S.: Forecasting temperate alpine glacier survival from
accumulation zone observations, The Cryosphere, 4, 67–75, doi:10.5194/tc-4-67-2010, 2010.
Prokop, A.: Assessing the applicability of terrestrial laser scanning for spatial snow depth measurements, Cold Reg. Sci. Technol., 54, 155–163, 2008.
Qu, B., Ming, J., Kang, S.-C., Zhang, G.-S., Li, Y.-W., Li, C.-D., Zhao, S.-Y., Ji, Z.-M., and Cao, J.-J.: The decreasing albedo of the Zhadang glacier on western Nyainqentanglha and the role of light-absorbing impurities, Atmos. Chem. Phys., 14, 11117– 11128, doi:10.5194/acp-14-11117-2014, 2014.
Reinwarth, O. and Escher-Vetter, H.: Mass Balance of Vernagt-ferner, Austria, From 1964/65 to 1996/97: Results for Three Sec-tions and the Entire Glacier, Geogr. Ann. A, 81, 743–751, 1999. René, P.: Le réchauffement climatique en images, Ed. Cairn. Pau
(France), 167 pp., 2013.
Reshetyuk, Y.: Calibration of Terrestrial Laser Scanners Callidus 1.1, Leica HDS 3000 and Leica HDS 2500, Surv. Rev., 38, 703– 713, 2006.
Revuelto, J., López-Moreno, J. I., Azorín-Molina, C., Zabalza, J., Arguedas, G., and Vicente-Serrano, S. M.: Mapping the annual evolution of snow depth in a small catchment in the Pyrenees using the long-range terrestrial laser scanning, Journal of Maps, 10, 359–373, 2014.
Rolstad, C., Haug, T., and Denby, B.: Spatially integrated geodetic glacier mass balance and its uncertainty based on geostatistical analysis: application to the western Svartisen ice cap, Norway, J. Glaciol., 55, 666–680, 2009.
Sanjosé, J. J., Berenguer, F., Atkinson, A. D. J., De Matías, J., Serrano, E., Gómez-Ortiz, A., González-García, M., and Rico, I.: Geomatics techniques applied to glaciers, rock glaciers and ice-patches in Spain (1991–2012), Geogr. Ann. A, 96, 307–321, 2014.
Schrader, F.: Carte du Mont-Perdu et de la region calcaire des Pyrénées. Expart des Mémoires de la Société des Sciences Physiques et Naturelles de Bordeaux, Bordeaux, Journal de L’imprimerie Chariol, 1874.
Schwalbe, E., Maas, H.-G., Dietrich, R., and Ewert, H.: Glacier ve-locity determination from multi-temporal long range laser scan-ner point clouds, International Archives of Photogrammetry and Remote Sensing, 18, 457–462, 2008.
Scotti, R., Brardinoni, F., and Crosta, G. B.: Post-LIA glacier changes along a latitudinal transect in the Central Italian Alps, The Cryosphere, 8, 2235–2252, doi:10.5194/tc-8-2235-2014, 2014.
Serrano, E., González-Trueba, J. J., Sanjosé, J. J., and Del Río, L. M.: Ice patch origin, evolution and dynamics in a temperate high mountain environment: the Jou Negro, Picos de Europa (NW Spain), Geogr. Ann., 93, 57–70, 2011.
Vicente-Serrano, S. M., Trigo, R. T., López-Moreno, J. I., Liberato, M. L. R., Lorenzo-Lacruz, J., and Beguería, S.: The 2010 ex-treme winter north hemisphere atmospheric variability in Iberian precipitation: anomalies, driving mechanisms and future projec-tions, Clim. Res., 46, 51–65, 2011.
Vincent, C., Ramanathan, Al., Wagnon, P., Dobhal, D. P., Linda, A., Berthier, E., Sharma, P., Arnaud, Y., Azam, M. F., Jose, P. G., and Gardelle, J.: Balanced conditions or slight mass gain of glaciers in the Lahaul and Spiti region (northern India, Himalaya) during the nineties preceded recent mass loss, The Cryosphere, 7, 569– 582, doi:10.5194/tc-7-569-2013, 2013.