ESCUELA TÉCNICA SUPERIOR DE INGENIERÍAS AGRARIAS
INSTITUTO UNIVERSITARIO DE INVESTIGACIÓN EN
GESTIÓN FORESTAL SOSTENIBLE
DOCTORAL THESIS:
Soil chemical and microbiological properties affected by land use,
management, and time since deforestations and crop establishment.
The case of wheat (not irrigated) and cotton (irrigated) fields
in Filyria, Kilkis, Greece.
Alexandros Eleftheriadis
Submitted in fulfillment of the requirements for the degree of
Doctor at the University of Valladolid
Guided by:
Dra. María Belén Turriόn
ACKNOWLEDGEMENTS
This big journey finally came to an end, and there are quite a few people who have made it possible. I recall (with a big smile) during the sampling process when, either with my father or his older brother Yannis, we travelled across the land with a tractor in order to collect the soil samples.
First of all, I would like to thank my professor, María Belén Turriόn Nieves. You know you have made everything possible, with your endless help, support, and standing up exactly as an academic Professor should do; discussing, worrying, searching, proposing.
Moreover, many people from the Soil Science department of Palencia (Edafologia y Quimica Agricola) have helped me in many aspects; academic concerns, lab work, social life. Francisco Lafuente, Valentin Pando and Juan Carlos Arranz, thank you for everything.
To the friends who have made my stay in Spain more than pleasant: Antonio and Maria, Iniaki, Mireia, I’ll never forget you.
Back in Greece I had assistance and support from professors Thanasis Papaioannou and Martha Lazaridou. I deeply appreciate it.
INDEX
LIST OF ABBREVIATIONS………..……….. 1
ABSTRACT….……….………..………. 5
RESUMEN….……….………..…... 13
INTRODUCTION………..……….... 21
1. Deforestation and Impacts on Soil Organic C……….. 23
2. Soil Microbial Biomass………..……….. 26
3. Soil Respiration………..…….. 31
4. Microbiological ratios ………..……… 36
4.1 The microbial quotient (MBC/SOC)………..……… 36
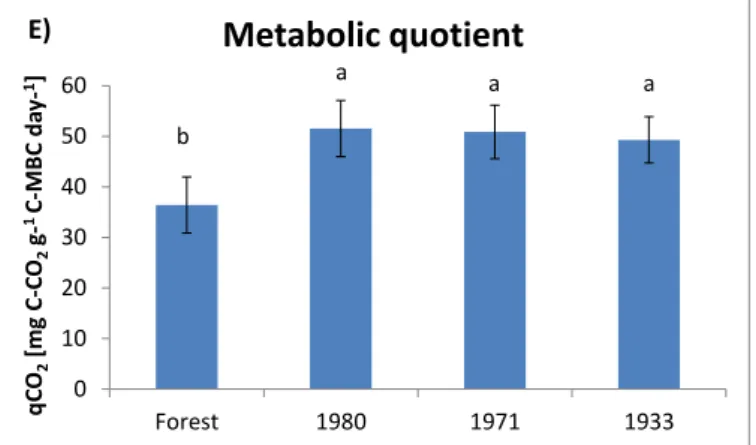
4.2 The metabolic quotient (qCO2)………..………… 37
5. Defining the problem……….……..………. 42
6. Fractionation, relations with SOC and N………. 42
OBJECTIVES………...………. 47
MATERIAL AND METHODS………..……….. 51
The study area: History and facts. The three deforestations………... 53
Climate of the area……….. 54
Geology and soils of the area……….. 55
Management practices………. 57
Historical, management and current state of the selected fields………. 58
Experimental design and site sampling……… 61
Soil analysis-analytical methods………..………... 62
Particle-size fractionation……….………... 63
Determination of the power output of the ultrasonic equipment………. 65
Statistical Analysis……….. 65
RESULTS AND DISCUSSION………..……….. 69
1. CHEMICAL AND MICROBIOLOGICAL PROPERTIES.………….... 71
1.1 Soil Organic Carbon……….………. 71
1.2 Microbial Biomass Carbon………...………. 78
1.3 The MBC to SOC ratio (The microbial quotient)……….…..….. 85
1.4 Soil Respiration……..……….……….. 93
2. EFFECTS OF LAND USE, TIME FROM DEFORESTATION AND
MANAGEMENT....……….……….…… 104
2.1 Land Use Change Effect: Forest versus Agriculture………. 104
2.2 Effect of time transcurred since deforestation and subsequent cultivation 108 2.3 Land Management Effect: Wheat versus Cotton Crops..……….. 111
3. SOIL PROPERTIES IN SOIL PARTICLE-SIZE FRACTIONS.…….... 117
3.1 SOC in the Fractions………..… 121
3.1.1 General remarks and comments………..……..….……... 121
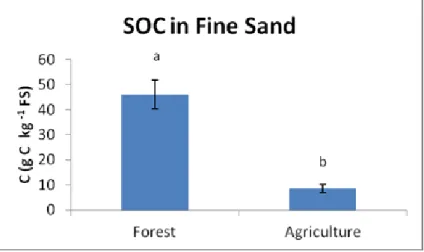
3.1.2 POM and SOC in Fine Sand……… 123
3.1.3 SOC in the Silt and Clay Fractions……..……… 130
3.1.4 Comparison of SOC contents between Fractions…... 139
3.2 Total Soil Nitrogen………..……….……. 142
3.2.1 Nitrogen in whole soil……….………... 142
3.2.2 Nitrogen in particle-size fractions………...………. 146
3.2.2.1 General remarks and comments……….…... 146
3.2.2.2 Nitrogen in the fine sand fraction……….………... 148
3.2.2.3 Nitrogen in the silt and clay fractions………....……. 151
3.3 The C/N Ratio in soil……… 160
3.3.1 C/N in whole soil………. 160
3.3.2 C/N in Fractions………... 164
CONCLUSIONS……….…… 175
BIBLIOGRAPHY……….. 181
APPENDIX………. 203
1. Maps of the deforestations of the area……….…. 205
2. Photos of the fields……… 208
1
LIST OF ABBREVIATIONS
CT : Conventional tillage
FS : Fine sand
IR : Irrigated (plots)
MB : Microbial biomass
MBC : Microbial biomass carbon
MBC/SOC : Microbial biomass carbon/ Soil organic carbon NIR : Not irrigated (plots)
ns : not significant (for statistical tables)
NT : No tillage
OM : Organic matter
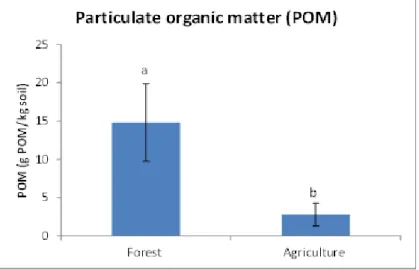
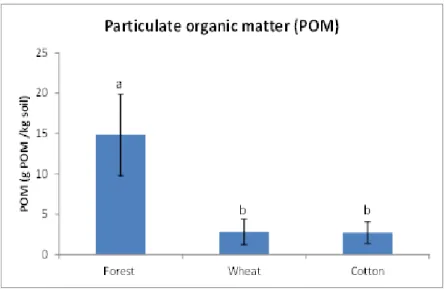
POM : Particulate organic matter
RT : Reduced tillage
SMB : Soil microbial biomass SOC : Soil organic carbon SOM : Soil organic matter
SQ : Soil quality
SR : Soil respiration
ABSTRACT
5 Deforestation is a common practice in many countries worldwide since many years, in order to gain land for agricultural purposes, and is one of the main reasons for the global net release of CO2 from soil to atmosphere. The conversion from
natural vegetation to cropland often leads to a depletion of the soil organic carbon (SOC) stock due to reduced input of biomass and enhanced decomposition after physical disturbance. The effect of forest clearing for other land uses is often a low level of soil microbial population.
In a part of Northern Greece, Filyria, which belongs to prefecture of Kilkis, three deforestations took place in 1933, 1971 and 1980, in order to give land for agriculture to refugees and residents with no property. The natural vegetation consists mainly of
Quercus pubescens stands. Each family was given 2-9 hectares of deforested land. The agricultural fields are cultivated with wheat, cotton and tobacco, and cherry trees are established in several plots. The soils of the study area have developed from limestone, and are classified as Xeralfs according to Soil Taxonomy. The plots of the study are cultivated with cotton and wheat. Wheat fields are not irrigated and their management is considered as reduced tillage, whereas cotton plots are irrigated by sprinklers, considered as conventional tillage and are altered with wheat every 2 years (two consecutive years of cotton crops, one year of wheat). The big amount of time transcurred since the first deforestation, the availability of three different deforestation dates and the remaining undisturbed forest, offer an interesting opportunity of studying these changes, along with assessing factors such as land use (forestry vs agriculture) and land management types (wheat fields vs cotton fields) correlating with the amount of time since deforestation (26, 35 and 73 years).
ABSTRACT
6
contents of the two elements. The aims of this thesis are to determine the changes in terms of soil microbiological properties that resulted from 3 stages of deforestation (1933, 1971, 1980), by measuring and assessing microbial biomass carbon (MBC), SOC, the MBC/SOC ratio, soil respiration (SR), the metabolic quotient (qCO2), and
the relationship between SOC, N and the soil fractions. Land use (forestry vs agriculture), type of crop management (wheat vs cotton) and the amount of time since deforestation (26, 35 and 73 years since deforestations) are the factors discussed.
Three sampling categories referring to deforestation year (1933, 1971, and 1980) in the cultivated fields and one category referring to the natural remaining forest were considered. For each deforestation year category, two crop subcategories were considered (wheat and cotton), and from each crop subcategory, 12 plots were sampled. In adjacent areas, twelve plots of remaining undisturbed forest (Quercus pubescens) were selected. A composite sample was taken in each plot (72 cultivated plots and 12 forest plots). The composite sample was obtained by mixing fifteen random subsamples from the 0-15 cm mineral layer. Soil samples were collected at the end of November 2005, after harvest.
Microbiological and chemical properties at whole soil samples, and chemical properties at soil particle-size fractions were studied. Soil organic carbon was calculated from the total carbon measurement subtracting C from carbonates. Soil Microbial Carbon was determined by the fumigation-incubation method and posterior C in extracts was determined by wet oxidation with dichromate. The microbial quotient (MBC/SOC) represented the fraction of MBC with respect to the SOC. Potential Soil Respiration was determined in closed jars and under laboratory-controlled conditions. The metabolic quotient (qCO2) represents the potential soil
respiration per unit microbial biomass, and was calculated as SR/MBC.
Particle-size fractionation was carried out through ultra sonification. Particulate organic matter (POM) was separated in the coarse sand fraction, and the fractions of fine sand (FS), silt and clay were analyzed for C (as previously SOC), N (as total nitrogen at a LECO C/N/H analyzer) and the ratio C/N.
The results showed significant differences for the values of SOC, MBC, MBC/SOC, SR, qCO2, between forest and agricultural plots. Higher values for forests
ABSTRACT
7 correlated to each other). This was expected according to the findings of many researchers, as tillage promotes soil organic matter (SOM) decomposition, decreasing the sources of energy and the available substrates for the microorganisms, leading to decreases in MBC, and SR which is highly dependent by the availability of SOM. Factors that were significant for these three properties were changes in land use and the amount of years since deforestation. For SOC and MBC, management as a factor was also significant. Forest values for the two microbiological ratios (MBC/SOC and qCO2) had significantly lower values, as reported by several researchers for
MBC/SOC and by many researchers for qCO2. These lower values for the forest soils
of the ratios are indicators of less stressed conditions of the microbial community, due to better preserve of SOC and higher accumulation of microbial biomass. For these ratios, land use was always a significant factor. For the MBC/SOC ratio the amount of years since deforestation was also significant, whereas for qCO2 the type of crop
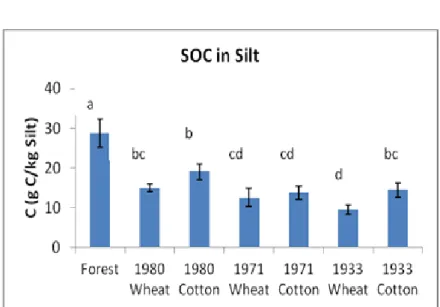
(management factor) was significant. The newest deforestation (1980) holded the biggest values for every property, except for the ratios. The amount of time since deforestation was adversely associated with SOC contents. Continuous soil tillage induces C loss and releases large amounts of CO2 to the atmosphere. After many
years systems reach or are near an equilibrium, leading to lesser values of qCO2.
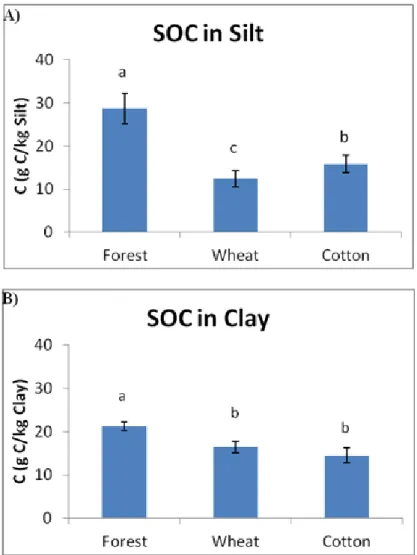
Wheat plots had always significantly higher values than cotton plots, when referring to SOC and MBC, whereas for qCO2 the reverse trend was observed. The reduced tillage practices (including N fertilization which accumulates higher N contents in wheat fields compared to cotton fields) of the wheat crops have improved conditions of the soil to protect SOC, compared to the conventional tillage practices of the cotton plots. For the other two properties management was not a significant factor. The quantity and the amount of years since land use change are more important in the SOM breakdown functions than the type and intensity of cultivation. The interaction between the amount of years and management was not significant for any property.
ABSTRACT
8
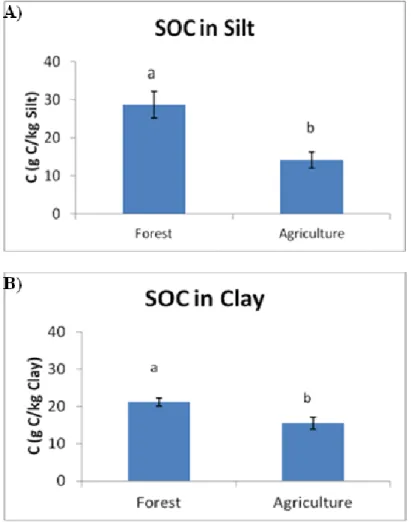
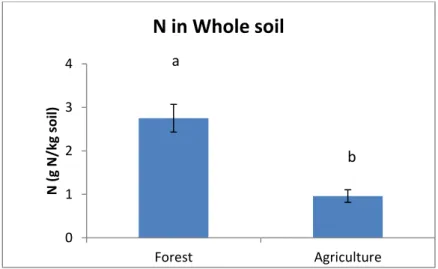
since deforestation) for the C/N ratio and POM. The amounts of N and POM were highly correlated with the contents of OM of a soil, and to each other. The ratio in forests refers to more fresh (less humified) material hence in a higher value. In the forest soils most of SOC and N were present in the fine sand fraction, which is expected (fresh organic material), with significantly higher values than silt and clay (except for the N contents in forest fine sand and clay where there are no significant differences). The reverse trend was observed for the agricultural soils, where clay holded the (significantly) greater values, due to protection of SOM. The C/N ratio holds its (significantly) greatest values for forest in the fine sand fraction, whereas for the agricultural plots in the silt fraction. Land use was a significant factor for all the properties in the studied fractions. Forest soils holded the greater values for all the properties in all the fractions compared to the agricultural plots, and except the N contents in clay, the differences were significant. Cultivation results in the breaking up of the aggregates, leading to protected C losses from silt and clay. Soil organic matter losses lead to N losses. The great losses of POM also lead to N losses, as these two properties were significantly correlated.
The amount of years since deforestation affected significantly C and the ratio, but not N. Nitrogen was mostly dependent on management practices (N fertilization). The most recent deforestation (1980) holded the greater values for all the properties in all the fractions (except for clay, where for C and N the 1st deforestation (1933) had similar values, and for the ratio there are no significant differences in values between the silt and clay fractions. Clay´s capacity to preserve carbon seems to diminish as years go by). For all the deforestation categories, clay had significantly higher values referring to C and N, whereas for the ratio the significantly higher values were found in the silt fraction. The stabilization of organic matter in the clay particles results in a steady content throughout the years, so we observed similar values for the C/N ratio in this fraction.
ABSTRACT
9 the other fractions. Enhanced nitrogen fertilization of the wheat fields resulted in accumulation of N on the clay particles of those fields (also resulting in lower C/N values). Referring to the fine sand fraction SOM withheld in FS was quickly lost, hence management did not affect the values significantly.
The interaction between time and management was not a significant factor. Deforestation and further establishment of agricultural use leaded to decreases in SOC and levels of microbiological properties, suggesting a deterioration of soil quality. Despite the fact that a relatively large amount of time had elapsed since deforestation and subsequent crop establishment in the three compared deforestation stages (1933, 1971 and 1980), the amounts of SOC, MBC and SR were significantly higher in soils deforested in the most recent stage (1980). The type of crop affected the studied soil properties. Cotton plots (considered as conventional management) had significantly lower SOC and MBC values and microbiological efficiency levels than the wheat plots (considered as reduced management).
Land use changes had significant effects in SOC and N contained in the soil fractions. The amount of POM, and C and N in the fine sand fraction presented the most distinctive differences (losses, due to loss of fresh organic material) among forest (significantly higher values) and agricultural plots. The amounts of SOC and N in the clay fraction should not be considered as a sensitive indicator in order to monitor changes in land use regimes, as the contents remained rather stable depending on the nature of land use.
The amount of time since deforestation played a higher role in the order: sand>silt>clay and was adversely associated with the values of SOC and N in the particles, except for clay where after 25 years of cultivation the capacity of this fraction to preserve SOM seems to have reached an equilibrium. Soil organic matter bound in the clay particles are well protected, hence values in clay were always higher in this particle-size fraction referring to agricultural fields.
RESUMEN
13 La deforestación es una práctica común en muchos países en todo el mundo que se viene aplicando desde hace muchos años, con el fin de obtener tierras para fines agrícolas, siendo una de las principales razones de la liberación neta global de CO2 del suelo a la atmósfera. La conversión de la vegetación natural a tierras de cultivo a menudo conlleva una reducción del stock de carbono orgánico edáfico (SOC) debido a la reducción de la entrada de biomasa vegetal y a una mayor descomposición después de la perturbación física del suelo. El cambio de uso de masa forestal natural a cultivo lleva a menudo a una disminución en la población microbiana del suelo.
La zona de estudio de la presente Tesis doctoral se encuentra en el norte de Grecia, Filyria, que pertenece a la prefectura de Kilkis, donde han tenido lugar tres grandes actuaciones sobre las masas forestales naturales de Quercus pubescens. Se corresponde con deforestaciones llevadas a cabo en 1933, 1971 y 1980, con el fin de dotar de tierras para la agricultura a los refugiados y residentes que carecía de propiedad. Cada familia recibió entre 2 y 9 hectáreas de tierra deforestada. Los campos agrícolas han sido cultivados con trigo, algodón y tabaco, además se realizaron plantaciones de cerezos en algunas parcelas. Para el presente estudio se han seleccionado parcelas en las que se cultivan algodón y el trigo. El cultivo de trigo no se riega, mientras que las parcelas de algodón son regadas por aspersión y se alternan con el trigo cada 2 años (dos años consecutivos de cosechas de algodón, de un año de trigo).El manejo del terreno en los cultivos de algodón es un manejo convencional, mientras que en los cultivos de trigo se puede considerar como un laboreo reducido.
RESUMEN
14
principalmente, y el limo en menor medida preservan los contenidos de estos elementos en los suelos.
El objetivo principal de esta tesis fue determinar el efecto en términos de propiedades microbiológicas del suelo y de estabilidad de la materia orgánica edáfica que resultaron tras el cambio de uso de masa forestal natural de Quercus pubescens. a tierras de cultivo de trigo y algodón en la región de Filiria, Kilkis, Grecia.
Cómo objetivos secundarios se plantearon:
A)determinar si el tiempo transcurrido desde la deforestación (25, 35 y 73 años) y el subsequente establecimiento del uso agrícola afecta a las características microbiológicas del suelo y a la distribución de su materia orgánica en fracciones según tamaño de partículas.
B)determinar si el tipo de cultivo/manejo (trigo vs algodón) tiene efecto en las propiedades previamente indicadas del suelo y si este efecto va a verse condicionado o no por el número de años transcurridos desde la implantación del cultivo, más que por las características de manejo del propio cultivo. Como ya ha sido indicado el área de estudio se localizó en Filyria, prefectura de Kilkis, al norte de Grecia (40º 54’ 12’’N 40º 53’ 42’’ N, y 22º 28’48’’E- 22º 29’ 37’’E). La altitud varía desde 145 hasta 195 m sobre el nivel del mar y la pendiente media de la zona es del 2%. El clima de la zona se puede clasificar clasifica como mediterráneo templado con una temperatura media anual de 15.0ºC y una precipitación media anual de 506 mm. Los suelos se desarrollan sobre roca caliza, y se clasifican como Xeralfs según la Soil Taxonomy. La vegetación natural de la zona son bosques de Quercus (especialmente Quercus pubescens) de los cuales sólo permanecen 80 hectáreas de bosques naturales intactos. Para alcanzar los objetivos planteados se dispone de un escenario excepcional en la zona de trabajo. Concretamente se cuenta, por un lado, con tres etapas de deforestación 1933, 1971, 1980 de masas maduras naturales de Quercus pubescens y la masa natural remanente no deforestada y por otro lado, se cuenta con el hecho de que se adoptaran, en esos tres momentos, los mismos usos y manejos del suelo y que se hayan mantenido hasta la actualidad.
RESUMEN
15 cultivos y en el tipo de cultivo existente. Se tomaron y analizaron un total de 84 muestras compuestas de suelo procedentes de las correspondientes parcelas. Las muestras compuestas se formaron a partir de 15 sub-muestras, que se mezclaron en campo, tomadas al azar dentro de cada parcela y correspondientes a la capa superior del suelo (0-15cm). Se diferenciaron según el uso del suelo en: forestal, correspondiente a parcelas de bosque natural de Quercus pubescens que se corresponde a la masa de bosque original (12 muestras) y agrícola (72 muestras). El uso agrícola a su vez se diferenció según el año de deforestación: deforestadas en 1933 (24 muestras), deforestadas en 1971 (24 muestras) y deforestadas en 1980 (24 muestras). Cada una de las categorías según año de deforestación se diferenció según tipo de cultivo: algodón (12 dentro de cada año de deforestación, en total 36) y trigo (12 dentro de cada año de deforestación, en total 36). Las muestras de suelo se recogieron al final de noviembre de 2005, después de la cosecha.
Para el estudio de las características microbiológicas del suelo se llevó a cabo la medición y evaluación de: a) el carbono de la biomasa microbiana edáfica (MBC) y su relación con el SOC, (MBC/SOC). El MBC se determinó por el método de fumigación-incubación y el posterior análisis del C en los extractos mediante oxidación en húmedo con dicromato. El cociente microbiana (MBC/SOC) representa la fracción de SOC correspondiente a la biomasa microbiana edáfica. b) la actividad microbiana del suelo determinada mediante la respiración edáfica en condiciones controladas se humedad y temperatura (SR), c) el cociente metabólico (qCO2) que
representa el potencial de la respiración del suelo por unidad de biomasa microbiana, y se calculó como el cociente entre el SR y el MBC.
RESUMEN
16
tamaño de partícula se calculó como la diferencia entre el C total medido con autoanalizador LECO CNH2000 menos el C de los carbonatos medido por valoración con HCl. El N total en el suelo global como en las distintas fracciones según tamaño de partícula se determinó con el autoanalizador LECO CNH2000.
Para el análisis estadístico de los datos obtenidos para el suelo global se utilizó un modelo mixto lineal con tres factores inter-sujetos: el uso, el tiempo (o fecha de deforestación) y el manejo (o tipo de vegetación). En el factor uso se diferenciaron dos niveles: uso forestal y agrícola. En el factor tiempo anidado en el uso [tiempo(uso)], se diferenciaron tres niveles dentro del uso agrícola según la fecha de deforestación (1933, 1971 y 1980) y el factor manejo anidado en el uso [manejo(uso)] se diferenciaron dos niveles según el tipo de cultivo (trigo y algodón), además se consideró la interacción [tiempo*manejo(uso)]. Para el análisis estadístico de los datos correspondientes los análisis de las fracciones según tamaño de partículas se utilizó un modelo lineal mixto con los mismos tres factores inter-sujetos indicados en el modelo aplicado en el análisis de suelo global señalado anteriormente (el uso, el tiempo y el manejo) y un factor intra-sujetos (tamaño de partícula).El factor tamaño de partícula diferenció tres niveles: arena fina, limo y arcilla. Las varianzas en los modelos fueron estimadas por el método de Máxima Verosimilitud Restringida (REML). Cuando se detectaron diferencias significativas en alguno de los factores considerados o sus interacciones (p <0,05), se realizó la prueba de Tukey. Todos los análisis estadísticos se realizaron utilizando PROC MIXED de SAS 9.1 (SAS Institute Inc., 2010).
RESUMEN
17 los contenidos de SOC, MBC y SR. Para SOC y MBC, el factor manejo (tipo de vegetación) también fue significativo. Los suelos forestales presentaron para las dos cocientes microbiológicos considerados (MBC/SOC y qCO2) valores significativamente más bajos que los suelos agrícolas. Estos valores más bajos indican que los suelos forestales presentaron condiciones de menor estrés para la comunidad microbiana, debido a que conservan niveles más elevados de SOC y una mayor acumulación de biomasa microbiana. Para la relación MBC/SOC la cantidad de años desde la deforestación también fue significativa y no lo fue el factor manejo, mientras que para qCO2 el tipo de cultivo (factor de manejo) fue significativo y no el factor tiempo transcurrido desde la deforestación. Los suelos sometidos a una deforestación más reciente (1980) presentaron los valores más altos para todos los parámetros medidos (no así para sus cocientes).
Nuestros resultados indicaron que el tiempo transcurrido desde la deforestación está asociado negativamente con el contenido de SOC, la labranza continua del suelo ha inducido la pérdida de C y ha liberado grandes cantidades de CO2 a la atmósfera. A pesar de que había transcurrido un número de años relativamente alto desde la deforestación y establecimiento del cultivo, las cantidades de SOC, MBC y SR fueron significativamente mayores en los suelos deforestados recientemente que en el resto. El tipo de cultivo afectó a algunas de las propiedades de los suelos estudiados. En los cultivos de algodón (considerados como manejo convencional) tuvieron valores significativamente menores de COS y MBC y también menor eficiencia (mayor cociente metabólico) que los suelos cultivados con trigo (considerados como de manejo reducido).
El N, la relación C/N en el suelo global y la POM siguen la misma tendencia que el SOC, es decir se obtuvieron valores significativamente más altos en los suelos bajo bosque que en los agrícolas y dentro de estos en los de más reciente deforestación (1980). Los tres factores considerados (uso, tiempo transcurrido desde la deforestación y manejo) fueron significativos para el N, pero sólo los dos primeros para la relación C/N y POM. Las cantidades de N y de POM estuvieron altamente correlacionadas con el contenido de la SOC y entre sí.
RESUMEN
18
dobles en las que se consideraba el factor fracción (tamaño de partícula) fueron siempre significativas, ello conlleva a la necesidad de estudiar que sucede con cada factor en cada tamaño de partícula, o bien considerar para cada tamaño de partícula el efecto de los factores considerados. En los suelos forestales las mayores cantidades de C y N estuvieron presentes en la fracción de arena fina, resultado esperable debido a que esta fracción se encuentra constituida principalmente por material orgánico fresco de pequeño tamaño, con valores por norma general significativamente más altos que en las fracciones de limo y arcilla. Se observó la tendencia inversa de los suelos agrícolas, donde la arcilla presentó concentraciones de C y N significativamente más altas, indicando que en esta fracción la estabilización de la SOM mediante el complejo arcillo-húmico hace que ésta se acumule. La relación C/N presentó valores significativamente más altos para el suelo de bosque en la fracción arena fina, mientras que para las parcelas agrícolas fue en la fracción limo. Los suelos forestales mostraron concentraciones significativamente más altos de C y N en todas las fracciones en comparación con las parcelas agrícolas, con excepción de los contenidos de N en la arcilla, donde las diferencias no fueron significativas. Estos resultados se explican debido a que el laboreo de los suelos en los cultivos causa la ruptura de los agregados, favoreciéndose la aireación y dando lugar a pérdidas de C y N tanto en las fracciones más lábiles como en las más estables. Las grandes pérdidas de POM también conducen a pérdidas de N, ya que estas dos propiedades se correlacionaron significativamente.
RESUMEN
19 arcilla de todos los suelos agrícolas considerados, pone de manifiesto la acumulación en esta fracción de una MO más estable que en el resto de las fracciones que no se ve afectada ni por el tiempo transcurrido desde la deforestación ni por el manejo o tipo de cultivo.
Los mayores valores de SOC y N (significativo para casi todas las comparaciones) se encuentran siempre en arcilla, y para la relación C / N en el limo. El contenido de SOC en la fracción de arcilla de los suelos no mostró diferencias significativas con el tipo de manejo, debido al comportamiento estable de esta fracción. La fracción de arcilla en los suelos de cultivo de trigo mostró siempre valores significativamente más altos para N que en las otras fracciones. La fertilización nitrogenada en el cultivo de trigo tuvo como consecuencia la acumulación e inmovilización del N en las partículas de arcilla dando también como resultado valores más bajos para la relación C/N. En relación a la fracción de arena fina, la MOS ligada a este tamaño de partícula es lábil y se ve afectada por el tiempo transcurrido desde la deforestación y posterior cultivo, pero no por el tipo de cultivo existente.
En el presente estudio se puede concluir que la deforestación y establecimiento de uso agrícola en la zona de estudio condujo a la disminución de los niveles POM, y de SOC y N y de las propiedades microbiológicas, lo que sugiere un deterioro de la calidad del suelo. Después de 25 años desde la deforestación y establecimiento de los cultivos estos sistemas han alcanzado un equilibrio, no mostrando diferencias significativas en los valores de qCO2 con los suelos de las parcelas deforestadas hace 35 y 73 años. Las prácticas de labranza reducida de los cultivos de trigo han permitido una mayor protección del SOC, en comparación con las prácticas convencionales de labranza de las parcelas de algodón. El número de años transcurridos desde el cambio de uso del suelo es más transcendente en los procesos de transformación de la materia orgánica edáfica en la zona estudiada que el tipo o intensidad del manejo que se ha llevado a cabo en el cultivo.
RESUMEN
20
INTRODUCTION
23 1. DEFORESTATION AND IMPACTS ON SOIL ORGANIC C
Deforestation is a common practice in many countries worldwide since many years, in order to gain land for agricultural purposes, and is one of the main reasons for the global net release of CO2 from soil to atmosphere (Veldkamp, 1994; Kucuker
et al., 2015; Gómez-Acata et al., 2016). Conversion of natural to agricultural land resulted in the loss of 50-100Pg of soil organic carbon (SOC) worldwide over the past 200 years (Fließbach et al., 2007). A sustainable ecosystem depends on nutrient fluxes through the trophic levels, which are mainly mediated by microorganisms, the driving force for soil organic matter (SOM) turnover. But when forests are cleared for agriculture, the system becomes open. This creates a dependence on external inputs of nutrients in order to balance the output by harvests, leaching and erosion (Nogueira et al., 2006). Another result of deforestation for agricultural use is the altering of the biogeochemical cycling with oxidation of SOC and the establishment of a new equilibrium in soil C content. The effect of forest clearing for other land uses is often a low level of soil microbial population and enzymatic activity due to changes in soil microclimate (Sahani and Behera, 2001). The latter authors also reported that deforestation caused adverse changes in soil texture, structure, hydrological regime, nutrients and microbiological quality which included soil microbial biomass (SMB) and activity. Carbon inputs in agricultural systems are generally lower than in native forests, whereas sites under native forests have higher microbiological activities, followed by reforested areas, than in agricultural sites (Nogueira et al., 2006). Fifty years of agricultural use after forest removal showed declines in some biological activities and processes mediated by microorganisms. Devegetation led to lower microbial and biochemical quality of soil, as revealed by the lower SOM and microbial activity of the disturbed with respect to the undisturbed soil (Bastida et al., 2006). The conversion from natural vegetation to cropland often leads to a depletion of the SOC stock due to reduced input of biomass and enhanced decomposition after physical disturbance (Poeplau and Don, 2013). According to Dinesh et al. (2003), deforestation and cultivation significantly reduced microbial activity due to decline in available SOM/substrate levels. They concluded that forest clearance for agriculture:
INTRODUCTION
24
b) limits natural vegetation
c) simplifies the ecosystem structure
d) has detrimental effects (especially on biological and biochemical) soil properties, since microclimatic conditions at the ground level are modified. Hajabassi et al. (1997) reported in their study that deforestation and subsequently tillage practices resulted to a 50 % decrease of SOM and total nitrogen (TN) and a decrease in aggregate size, overall resulting to a decrease of soil quality (SQ) and productivity of natural soils. Hence, deforestation and consequent practices of agricultural crops led to a severe damage of SQ, an increase in soil erosion and extensive nutrient losses (especially NO3-N and Ca).
The significance of the presence of organic matter (OM) in the soils has been proved by many researchers. Organic matter is an important binding agent of soil aggregates (Angers et al., 1992). Karlen et al. (1994) refer to resistance to degradation, nutrient cycling, and water retention as soil functions affected by SOC. Beneficial influences of SOM include soil aggregate formation and stability, increased water holding capacity and improved nutrient retention (Mao et al., 1992). Organic matter has a beneficial effect on SQ and crop productivity and has the potential to sequester C from atmospheric CO2 increases (Rasmussen and Parton,
1994). Reicosky et al. (1995) stated that productivity of soils is strongly related to SOM contents. Soil organic C and the humus fraction play significant roles in soil microaggregation leading to greater soil erosion resistance (Sahani and Behera, 2001). Organic matter could also be considered as a source for N, P, K, Fe, Mn and many beneficial elements (Panayiotopoulos, 1984; Eleftheriadis, 2005); its presence improves aeration and consequently drainage in soils with high clay contents (Eleftheriadis, 2005).
INTRODUCTION
25 (soil type, drainage, management practices, duration of current use), management and ecological factors.
Cultivation causes significant disturbance to soil organisms and reduction of SMB (Alvarez et al., 1998), and decreases the SOM content (Angers et al., 1992), due to:
a) dilution of SOM through mixing of the organic matter rich surface horizons with horizons low in organic matter
b) accelerated mineralization due to repeated tillage operations c) increased erosion
d) lower amounts of C inputs.
Glaser et al. (2000) and Francini et al. (2007) stated that changes in soil management practices is one of the main factors influencing the amount, quality and turnover of SOM. Cropping and tillage systems are determinants of the amount and distribution of SOM, especially in the upper layers of the soil profile (Alvarez et al., 1998). Cultivation of soils results in the disruption of aggregates and loss of SOM compared to native sod and pasture soils (Beare et al., 1994), and conventional tillage practices can cause in the long term significant losses of SOM leading to an increase in soil erosion and loss of soil structure. These negative effects can be diminished by use of reduced tillage systems (Alvarez and Alvarez, 2000). Soil OM levels are controlled, except by climatic and pedogenetic factors, and by tillage, crop rotation, fertilization and residue management (Angers et al., 1992). Soil and crop management practices such as cultivation, crop rotation, residue management and fertilization, influence considerably the level of SOM retained over time (Chander et al., 1997). Crop management induced changes in soil moisture, soil temperature, crop rooting and crop residue input can have a large impact on SMB (and mineralizable C and N) which in turn affect the ability of soil to supply nutrients to plants through SOM turnover (Franzluebbers et al., 1994). According to Dalal et al. (1991) and Lantz et al. (2001), introducing tillage to a virgin soil decreases the amount of SOM. Reasons for this:
INTRODUCTION
26
c) exposure of new soil surfaces through aggregate disruption - degradation of soil structure
d) reduced additions of organic materials e) increased soil erosion
f) removal of biomass
g) exposure of SOM to mineralization and decomposition processes All these reasons lead to different rates of microbial activity.
On the other hand, Wardle et al. (1999) found no evidence of tillage affecting soil C loss after seven years.
Fauci and Dick (1994) stated that crop rotations, residue management, fertilization and other management practices can significantly affect SQ by changing soil physical, chemical and biological parameters.
Conservation tillage techniques seem to increase SOM in the upper layer, thus increasing the micro-aggregation and aggregate stability. These practices therefore could promote an enhancement of C sink at a global scale (Lal, 1997).
Soil systems will reach an equilibrium if both the environment and the agricultural practices remain constant over long periods. If agricultural management changes, the equilibrium will be disturbed and a new one will be reached (Anderson and Domsch, 1989). The effects of crop rotation and tillage on SOM become significant only after several years (Reicosky et al., 1995). Accumulation of organic matter in the soil confers important improvements in SQ, soil fertility and C sequestration (Roldán et al., 2007).
Soil disturbance and SOM losses are believed to be associated with reduced soil biodiversity (Wander et al., 1995).
2. SOIL MICROBIAL BIOMASS
Soil Microbial Biomass can be defined as the part of SOM that constitutes living microorganisms smaller than 5-10μm3 (Alef and Nannipieri, 1995), or the cell mass of
INTRODUCTION
27 SOM plays an essential role in the short term of nutrient turnover in the soil. It constitutes a reservoir of nutrients, participates in nutrient cycling and is responsible for organic matter and residue decomposition (Alvarez et al., 1995, Alvarez et al., 1998, Alvarez and Alvarez, 2000). It is a pool (a labile source and a sink) for nutrient (N and others) delivery and can be considered as an ecological indicator for structure formation and stabilization of soil (Dalal et al., 1991; Alef and Nannipieri, 1995). Soil microbial biomass is considered the living part of SOM, it is responsible for the transformations of added and native SOM (Dalal et al., 1991), correlates with aggregate stabilization (Harris, 2003) and is the most active SOM pool, whereas SOC is the active and the passive pools (Franzluebbers et al., 1994).
Soil microorganisms constitute the basic consumer trophic level of the decomposer subsystem, controlling SOM breakdown and subsequent release of nutrients and their availability for other organisms. Further, microbial activity and biomass dynamics help to regulate long term soil properties such as net fluxes and amounts of SOC and nutrients (Wardle et al., 1999). Anderson (2003) argued that microorganisms play a leading role in soil development and preservation.
The size of SMB is governed by various management practices, such as crop rotation, cultivation, organic amendments, fertilization and crop residue management (Chander et al., 1997). Karlen et al. (1994) determined the soil quality functions affected by SMB as resistance to degradation, and plant growth through nutrient cycling. With the increase of SMB and biomass turnover, more SOC is sequestered (Lantz et al., 2001). Biomass is believed to play a major regulatory role in soils (Wander et al., 1995).
Soil microbial biomass is less than 5% of organic matter volume in the soil, but it performs three critical functions (Dalal, 1998):
it is a labile source of C, N, P, S
it is an immediate sink for C, N, P, S
it is an agent of nutrient transformation and pesticide degradation Furthermore, microorganisms:
INTRODUCTION
28
act as biological agents against plant pathogens
contribute towards soil aggregation
participate in soil formation
Soil microbial biomass comprises 2-3% of the SOC and 3-5% of the soil N. Besides serving as a source and sink for mineral nutrients and organic substrates in the short term, it acts as a catalyst for conversion of plant nutrients from stable organic forms to available mineral forms over longer periods. Crop productivity and nutrient cycling are therefore controlled by the amount and activity of SMB. Soil management, tillage methods and seasonal conditions, all affect the amount of biomass (McGill et al., 1986). Soil microbial biomass responds usually to seasonal moisture and temperature and to residue and tillage management.
Soil microbiological properties have been reported as a reliable tool in order to estimate early changes in the dynamics and distribution of soil microbial processes in different land use systems (Bending et al., 2004; Liang et al., 2012).
According to Carter (1991) microbial biomass carbon (MBC) is related to SOC. He also found that organic carbon in biomass of reduced tillage was higher than in plowed soils. Fauci and Dick (1994) agreed that SMB is closely related to SOM content. Microbial biomass carbon and microbial biomass nitrogen turnover rapidly and reflect changes in management practices long before changes in SOC and TN are detectable. This leads to the potential of SMB to serve as a SQ indicator. Usually a close relationship exists between the quantity and quality of the soil organic substance and the quantity and metabolic activity of the microorganisms (Emmerling et al., 2001). Mao et al. (1992) and Marinari et al. (2006) also stated that soil microorganisms, their growth and their activity are intimately linked and dependent to the C status (or inputs) of the soils, a statement which comes to agreement with Nogueira et al. (2006). Anderson (2003) argued that relations between functional microbial diversity and pools of SOC exist.
INTRODUCTION
29 1994). High temperatures and low moisture lead to a decrease in microbial activity (Bastida et al., 2006).
In order to evaluate the degree and the direction of changes that occur to forest land after deforestation and subsequent cultivation, indicators have been proposed by many researchers. Microbial indices proved to be sensitive to changes that occurred to soil processes (Moscatelli et al., 2005). Measurements of the soil microbial community may be used to determine biodiversity, ecological processes and structures, and also to have a utility as an indicator of the re-establishment of connections between the biota and restoration of function in degraded systems (Harris, 2003).
Microorganisms play a leading role in soil development and preservation, in fact there is a close linkage between the biotic compartment and biogeochemical cycling. Since microorganisms respond rapidly to changing environmental conditions they are considered as sensitive indicators of soil health and could be therefore used for soil status monitoring (Pompili et al., 2006). Soil biota populations are considered an important and labile fraction of SOM involved in energy and nutrient cycling. Soil microbial biomass, soil enzymatic activity and soil respiration (SR) respond more quickly to changes in crop management practices or environmental conditions than SOM (Chander et al., 1997). Soil microbial biomass is an important source and sink for the majority of nutrients available to plants. Thus, it can influence the growth and development of crops. Nutrient fluxes through SMB are much faster than in the remaining SOM, implying that SMB could be used as an important indicator of changes in soil health and SQ produced by agricultural practices, especially in temperate regions (Roldán et al., 2007).
INTRODUCTION
30
agricultural systems to low-input systems. When soil management changes, SMB responds more quickly that does SOM, which is relatively slow to change (Anderson and Domsch, 1989) and do not always provide adequate information of changes in soil quality that may occur (Cardelli et al., 2012). It is therefore important to identify SOM fractions more sensitive to a change of land use or management which can be applied as early indicators of the dynamics of the soil C. It can be concluded that MBC is an indicator of early changes in SOM brought by management practices, like type of tillage, straw incorporation, etc (Powlson et al.,, 1987, Angers et al., 1992). It can be used as a rapid indicator of the response of SMB to changes in soil management that affect the turnover of SOM (Perucci et al., 1997). Although SOC has been used for some time as an indirect biological indicator, its response to interferences was found less sensitive than some microbial parameters. MBC, MBN and ammonification rates responded readily and reliably to changes in soil use and strategies of reforestation, making them highly promising SQ indicators (Nogueira et al., 2006). The role of the microbial fraction in mediating soil processes and their relatively high rate of turnover, logically suggests that the microbial fraction could be an indicator and early predictor of changing SOM processes (Marinari et al., 2006).
Microbial biomass C responded rapidly to change in tillage and management prior than SOC and N (Carter, 1986), and can be used as a sensitive indicator of SQ and closely related to soil fertility (Roldán et al., 2007). But, MBC was unaffected by the direct effects of inorganic N. This may be an advantage for MBC as an indicator of soil biology, particularly for agricultural systems (Fauci and Dick, 1994). This indicator had a relatively rapid response to organic amendments, suggesting that it could be useful in identifying positive soil management effects on a temporal basis. The greater sensitivity of MBC than SOC to C input in the soil, suggests that the active SOM pool undergoes more fluctuation due to crop management practices than the passive SOM pool (Franzluebbers et al., 1994). Soil microbial biomass responded to mulching much earlier than SOC, consistent with the tendency of the soil microflora to serve as an early indicator of the effects of agricultural management (Wardle et al., 1999).
INTRODUCTION
31 Microbial biomass C was found higher in undisturbed than disturbed plots (Bastida et al., 2006); in both plots no correlation between SOC and MBC was found, although many other authors say the contrary, maybe due to markedly reduced efficiency of carbon use or rather reduced microbial efficiency. Deforestation reduces MBC contents (Gómez-Acata et al., 2016). The available C substrates for microbial growth decline when long-term tillage takes place (Follett and Schimel, 1989). Carter (1986) found similar biomass levels in the top 10cm under no tillage (NT) systems and moldboard ploughing. Alvarez and Alvarez (2000) found an increase of SMB under NT in the surface layer, whereas they report a reverse trend for deeper layers. At surface layers of NT and plowed soil, SMB was found 54% more under NT for the 0-7.5cm and decreased with depth up to 30cm. At the plowed soil SMB was greatest in the 7.5-15cm layer. The SMB levels are closely associated with distributions of SOC, TN, water content and water soluble C as influenced by tillage management (Doran, 1987).
Ploughing decreases SOC and MBC contents of the surface 6cm from 40-50%, but if we consider the overall 24cm, no effect is observed (Angers et al., 1992). A wheat fallow system reduced MBC and N in 0-15cm by 60% compared to a continuous wheat system, due to a decrease of returned residues (Carter, 1986). No tillage practices decreased MBC and N and microbial activity 10-23% in 0-5cm compared to shallow tillage. Arable crops and subsequent cultivation encourage biomass decline (Carter, 1986).
According to Follett and Schimel (1989), C availability for microbial growth and SMB declined with increased tillage intensity. Crop residues serve as a substrate (C, N, etc) that is converted to SMB and SOM. Calderón and Jackson (2002) mentioned the microbial community was altered within days of disturbance.
3. SOIL RESPIRATION
The CO2 efflux is a physical process defined as the flow of CO2 from the soil
towards the atmosphere, and is measured at the soil surface (Calderón and Jackson, 2002). Frank et al. (2006) gave a definition for SR as the process whereby CO2
INTRODUCTION
32
account. In the present study when we are referring to SR, we have measured the microbial soil activity. Insam et al. (1991) stated that SR reflects the availability of slow-flowing C for microbial maintenance and is a measure of basic turnover rates in soil. The evolution of CO2 indicates microbial activity (Constantini et al., 1996); CO2
is produced in the soil when microorganisms decompose organic substances to obtain energy for their growth and functioning (Wang et al., 2003; Liu et al., 2006). Soil CO2
fluxes originate from autotrophic root respiration and heterotrophic microbial respiration (by decomposition of OM) in the rhizosphere and the bulk soil (Buchmann, 2000; Borken et al., 2002; Frank et al., 2002; Lohila et al., 2003). Soil respiration represents a major component of the soil C cycle and is an indicator of soil C storage, soil biological activity and overall soil quality (Lee and Jose, 2003a) and reflects the overall activity or energy spent by the indigenous microbial pool (Alvarez et al., 1995; Constantini et al., 1996). According to Raich (1992) SR is the total CO2
production in intact soils resulting from the respiration of soil organisms, roots and mycorrhizae. This activity is sustained by OM inputs in the soil from aboveground and from roots. Soils play an important role in the production and consumption of CO2. Soil-vegetation systems can act as a CO2 sink or source, depending on
decomposition rate and rate of SOC formation (Veldkamp, 1994).
Three principal components of SR may be defined: root respiration (30-70%), surface-litter respiration and the respiration of SOM (including root detritus). While CO2 is produced in the soil, microorganisms decompose organic substances to obtain
energy for their growth and functioning (Wang et al., 2003). The net CO2 balance
depends on CO2 uptake by gross photosynthesis and CO2 release by shoot, root and
soil respiration (Lohila et al., 2003). On a global scale SR in terrestrial ecosystems is estimated to total 50-75Pg C/year (Raich, 1992).
INTRODUCTION
33 (2001) considered SR as an excellent indicator of total soil biological activity, and therefore of overall soil quality.
According to Al-Kaisi and Yin (2005) and Raich (1992), the rate of CO2 emission
depends on:
The CO2 concentration gradient between soil and atmosphere
Soil temperature
Soil moisture (not linearly)
Pore size
Wind speed
Agricultural practices (tillage, residue management)
Climatic conditions
Borken et al. (2002) also mentioned as factors affecting SR forest type, soil fertility and soil texture. Tree species and nutrient availability strongly affect the decomposition of litter thus influencing SR. They indicated though that soil temperature and moisture explain most of the variation, agreeing with Howard and Howard and Howard (1993) and Klopatek (2002). They also proposed other factors (not significant though) affecting SR, such as above litter production, soil pH, SOC and TN. According to Buchmann (2000) and Lohila et al. (2003) SR depends on:
Climate
Land use changes
Temperature
Precipitation
Shifts from forest to agricultural use (litter and organic horizons removed, roots disturbed) or changing management practices
Root N concentration
Soil texture
INTRODUCTION
34
Tufekcioglu et al. (2001) considered as factors controlling the overall magnitudes of SR the availability of SOM (correlates positively), soil moisture (correlates positively) and the density of plant roots, which provide the substrates for soil biological activity. Lee and Jose (2003b) mentioned along with the above, MB, texture and root density whereas Lee and Jose (2003a) mentioned pH, CEC and nutrient availability to have strong influence on forest soils. Lohila et al. (2003) mentioned soil temperature, soil moisture, SOC quantity and quality and soil texture. Soil respiration is correlated significantly with the availability of C in the light fraction (Alvarez et al., 1998) and reflects the overall activity or energy spent by the indigenous microbial pool (Alvarez et al., 1995; Constantini et al., 1996). According to Frank et al. (2006), SR is influenced by land use, management practices and environmental conditions.
Soil respiration rates increase with soil C concentration (Witter and Kanal, 1998). Soil organic C and SR are positively related (Lohila et al., 2003; Tufekcioglu et al., 2001), as Jinbo et al. (2007) concluded in their study. Wang et al. (2003) stated that SR rate is closely and positively related to MBC, agreeing with Constantini et al. (1996). Sato and Seto (1999) on the other hand found no relationship. Earlier, Santruckova and Straskraba (1991) found no relation to MB, since SR remained on average nearly constant. The microbial populations increased their respiration rates along with temperature increase (Bastida et al., 2006). Howard and Howard (1993) claimed that the release of CO2 is a function of temperature and moisture content. Klopatek (2002) agreed with this statement. Mao et al. (1992) suggested a close relationship among SR and soil fertility. The microbial activity is an index to assess soil fertility (Sigstad et al., 2002) and reflects the nutrient status reliably (Mohr, 2004).
Conversion of forests to agriculture is responsible for a substantial increase in atmospheric CO2 concentration (Wagai et al., 1998). The global CO2 release due to
deforestation is estimated 1-3.2 Pg/year (Veldkamp, 1994). Devegetation has a negative effect on the development of microbial activity, as revealed by the significant lower values of BR (Sahani and Behera, 2001; Bastida et al., 2006). The respiration rate was found significantly higher at forest than plantation sites (qCO2 is
INTRODUCTION
35 Ethiopia (Lemenih and Itanna, 2004). Raich (1992) mentioned that in some studies the conversion of native vegetation increased SR. As Raich and Tufekcioglu (2000) and Tufekcioglu et al. (2001) stated in their studies, SR rates were found either the same or both higher and lower in forests compared, whereas Dinesh et al. (2004) mentioned much bigger SR rates at undisturbed compared to disturbed sites. Reclaimed soil systems showed a decrease with time of successional stages (Anderson, 2003). Vegetation influences SR by influencing soil microclimate and structure, the quality and quantity of detritus supplied to the soil and the overall rate of root respiration (Raich and Tufekcioglu, 2000). Lohila et al. (2003) attributed the lower SR rates of bare soil to limited substrate supply into the soil. Cultivation accelerates microbial respiration and increases loss of SOM (Ghani et al., 2003), by improving soil aeration, increasing soil and crop residue contact and enhancing plant nutrient availability (Al-Kaisi and Yin, 2005; Angers et al., 1992), but also due to the rapid increase in microbial activities in decomposing the labile SOM pool (Al-Kaisi and Yin, 2005). Management practices influence SR through their influence on SOM (Tufekcioglu et al., 2001). Follett and Schimel (1989) found higher microbial respiration in NT than plowed sites. Cultivation strongly affected (negatively) SR at the initial stage of cultivation (Jinbo et al., 2007). The magnitude of the CO2 losses
depends on the frequency and intensity of soil disturbance caused by tillage (Al-Kaisi and Yin, 2005). Different tillage implements affect CO2 efflux and microbial activity
(Calderón and Jackson, 2002). In tillage systems, management of residues affects soil CO2 efflux by altering soil temperature and water content, both of which affect
microbial populations and activity (Frank et al., 2006). Soil disturbance leads to faster breakdown of OM. As a consequence SR raises along with soil C losses (Lee and Jose, 2003a). The differences were attributed to SOC content, greater fine root biomass and higher soil moisture content.
INTRODUCTION
36
among treatments could be attributed to differences in SOC and MBC, suggesting that land use plays a significant role in soil CO2 efflux from respiration (Frank et al.,
2006). Soil respiration between tillage regimes had greater differences than MBC or SOC, indicating greater sensitivity to C substrate availability (Franzluebbers and Arshad, 1996).
4. MICROBIOLOGICAL RATIOS
Microbial biomass carbon (MBC), potential soil respiration rate (SR), metabolic quotient (qCO2, ratio of respired C to biomass C), ratio of microbial biomass C to
total organic C (MBC/SOC), are variables that have been suggested as indicators for assessing soil management effects on soil quality (Anderson, 2003). Ratios between microbiological parameters have often been used for evaluating the microbial ecophysiology implying an inter linkage between cell-physiological functioning under the influence of environmental factors (Anderson, 2003), and are suggested to be more useful than microbial variables related to soil weight when evaluating microbial populations and microbially mediated processes in soils. They also are useful tools to evaluate structure and physiology of microbial populations, microbial processes and certain properties in soil (Dilly and Munch, 1998).
4.1 The microbial quotient (MBC/SOC)
The MBC to SOC ratio (MBC/SOC) proved to be a reliable soil microbial parameter for describing changes in man-made ecosystems. For evaluating reclamation effects, the ratio can be considered superior to its single components (MBC, SOC) and to other parameters (Anderson and Domsch, 1989; Insam and Domsch, 1988) as a good index of the changes in SOM quality (Roldán et al. 2007).
INTRODUCTION
37 utilization of SOC by the microbes in terms of SOM turnover rate (Agele et al., 2005). Entry et al. (1996) mentioned that the ratio along with MBC are poor predictors of annual crop yield, but the ratio may be an accurate indicator of soil health and a good predictor of long term crop yield.
Franzluebbers et al. (1994) agreed that MBC/SOC may be a more sensitive property to changes in SOM quantity and quality due to differences in organic input, than SOC alone. Soil Microbial Biomass and activity and MBC/SOC have been found more sensitive indicators of soil agricultural practices with short term reactions, compared to total SOM (Emmerling et al., 2001). The MBC/SOC ratio reflects the efficiency of conversion to MBC (Sparling, 1992) and can be considered as a useful index for changes in SOM resulting from land management changes. According to Fließbach et al. (2007) it reflects the quality of SOM for SMB establishment and it could be used as an indicator of SOM quality, or as an early indicator of soil quality (Marinari et al., 2006). These indicators (along with qCO2 –the metabolic quotient, i.e.
the ratio of basal respiration to SMB) are supposed to constitute an early warning system for soil deterioration. The microbial activity was closely related to the soil nutrient status but SMB did not consistently reflect nutrient availability (Mohr, 2004).
4.2 The metabolic quotient (qCO2)
The metabolic quotient has been defined as the ratio of SR to MBC, the specific respiration of the biomass, specific maintenance respiration, metabolic quotient, community respiration per biomass unit, CO2-C produced per unit biomass and time.
It indicates the stress or the ecophysiological status of MB (Von Lutzow et al., 2002). According to Insam (1990), Wardle and Ghani (1995), Dilly and Munch (1998), Bauhus et al. (1998), Constanini et al. (1996), Islam and Weil (2000), Moscatelli et al. (2005), Saggar et al. (2001), Von Lutzow et al. (2002), Xu et al. (2006) and Jinbo et al. (2007), it indicates the efficiency of soil microbial populations (negatively correlated) in acquiring/utilizing OC (the efficiency of substrate utilization) and the intensity of C mineralization, and to Anderson and Domsch (1993) and Islam and Weil (2000) it reflects the stress in soils (positively correlated). Stress has as a result microbial inefficiency leading qCO2 to rise (Wardle and Ghani, 1995). Anderson and
INTRODUCTION
38
in developing ecosystems. Mao et al. (1992) considered it as a valuable measure for explaining ecosystem functioning. It is an indicator of ecosystem disturbance and development, declining during the adaptation of a system to different agricultural practices (Alvarez et al., 1998). The metabolic quotient may be used to compare microbial communities and to quantify the effects caused by environmental differences (Constanini et al., 1996). It is suggested to be an adequate indicator of bioenergetic changes in developing ecosystems, and for progressive maturation of the soil system (Marinari et al., 2006). Xu et al. (2006) considered it as an alternative measure of changes in MB in response to disturbance and environmental limitations. As adaptation goes along qCO2 decreases continuously (Anderson, 2003). According
to Dinesh et al. (2003) it reflects the maturity of a soil system, with larger values at young soils, and the potential turnover of MBC (Franzluebbers et al., 2001). The ratio indicates the cell-physiological entity in a constant only under unchanging environmental conditions. Any impact on the cells (change in temperature, moisture, nutrient status, storage time etc) will be reflected in a change of the qCO2. Along with
SR, they may be important properties for explaining the differences in MBC of different soils or caused by different treatments (Insam et al., 1991). Physiological performance could be (along with MBC/SOC) employed for the characterization of the ‘baseline performance’ of a microbial community (Anderson, 2003). Along with MBC/SOC it reflects OM input and availability in the soils, efficiency of conversion to microbial C, losses of C from soil, the stabilization of OC by the mineral fractions and maintenance requirements of the soil microbial community (von Lutzow et al., 2002; Blagodatskaya et al., 2006). Therefore a rise in qCO2 indicates soil quality
degradation. Deforestation is a form of degradation, hence leading to a great rise of qCO2 (Gómez-Ataca et al., 2016). Fließbach et al. (2007) related qCO2 with the
economy of MBC utilization, which is also connected to the complexity of the microbial food-web in soils. The metabolic quotient as a combination of microbial activity and population measurements appeared to provide more sensitive indications of soil pollution than the 2 parameters alone (Moscatelli et al., 2005). The higher the metabolic quotient, the lower the C assimilation efficiency (Bauhus et al., 1998). Overall, qCO2 is most appropriately used as an index of adversity of environmental
INTRODUCTION
39 is utilizing C resources, and the degree of substrate limitations for the SMB (Wardle and Ghani, 1995). The more efficiently the microorganisms function, the greater the fraction of substrate C is incorporated into biomass and less C per unit biomass is lost through respiration (qCO2 decreases) (Xu et al., 2006).
Plant dry matter production, different tillage practices, and straw incorporations or manure additions affect directly qCO2 (Alvarez et al., 1995). Moscatelli et al.
(2005) mentioned the strong relationship between qCO2 (and MBC/SOC) with the
nutritional status of the soil. Joergensen and Castillo (2001) and Noguiera et al. (2006) stated that the availability of substrate for microbial activity plays an important role for qCO2. Anderson and Domsch (1989) mentioned the high influence on qCO2
by the cropping practice, whereas they did not find any influence of fertilizer, previous crop cover, soil type and percentage of clay, SOC or pH. Bauhus et al. (1998) found it negatively correlated with pH, and highly affected by soil type.
The metabolic quotient was reported to be negatively correlated with SOC (Jinbo et al., 2007), MBC/SOC and MBC (Santruckova and Straskraba, 1991; Alvarez et al., 1995; Wardle and Ghani, 1995; Witter and Kanal, 1998; Joergensen and Castillo, 2001; Saggar et al., 2001; Moscatelli et al., 2005; Xu et al., 2006; Llorente and Turrión, 2009). Santruckova and Straskraba (1991) though mentioned no relation to SOC, and proposed 4 possible hypotheses for the reasons of the negative correlation between MBC and qCO2. They argued that a) the decreased qCO2 is caused by
changes in the microbial community in the soil, b) the increase of qCO2 is due to the
effect of a stress (due to e.g. agricultural management), c) the proportion of active cells decreases with increasing MB, possibly limiting the activity by nutrient shortage, d) the inhibition of high concentrations of CO2 produced by the microorganisms and
dissolved in the surrounding medium. Low MB usually occurs in stressed or disturbed conditions, causing qCO2 to rise (Wardle and Ghani, 1995). In some cases, higher
levels of C inputs to the soil increase MB but not metabolic activity which in turn lowers qCO2 (Insam et al., 1991; Alvarez et al., 1995). It was found to be negatively

![Figure 23. Type of vegetation effects on whole soil Nitrogen [g kg -1 soil]](https://thumb-us.123doks.com/thumbv2/123dok_es/5790903.746641/151.892.226.670.103.372/figure-type-vegetation-effects-soil-nitrogen-kg-soil.webp)