Thermal-fluid characterization of alternative liquids of
power transformers: a numerical approach
Ramón Lecuna, Fernando Delgado, Alfredo Ortiz, Pablo B. Castro, Inmaculada Fernandez
and Carlos J. Renedo
Mining and Energy Engineering School, Cantabria University Bulevar Ronda Rufino Peón, s/n, 39316, Torrelavega, (Spain) Phone/Fax number:+34 9422013 76/85; e-mail: [email protected]
ABSTRACT
The transformers lifespan depends importantly on its refrigeration. Mineral oils perform this work in the majority of the power transformers. However, this type of coolant has two main drawbacks: low biodegradability and low ignition point. Several alternative liquids are being developed in order to overcome these drawbacks. This paper compares their thermal-fluid behavior with a mineral oil by means of several parameters, such as temperature, flow rate, fluids velocity, convective heat transfer coefficient (h) and the cooling criterion (P). These are calculated using the numerical results of the simulation of a 3D-model of a Low Voltage Winding that belongs to a power transformer with ONAN cooling. The software COMSOL Multiphysics has allowed the simulation of the geometry using a physical model in which buoyancies and viscous forces are the only considered establishing the natural convection. As a result of the comparison, it is clear that the mineral oil is the best coolant liquid. Among the alternative liquids, silicone oil would be the second best coolant fluid, followed by the synthetic and natural esters, respectively. On the other hand, it seems to be clear that the 3D simulations can be used to compare properly the cooling capacities of the liquids.
Index Terms —Dielectric liquids, fluid-dynamics, thermal analysis, power transformers, numerical analysis
1. INTRODUCTION
1MINERAL oil is the most common option as a cooling 2
and dielectric liquid in the majority of the power transformers 3
worldwide. However, in cases where fire risk is an important 4
concern, this type of liquid is not so recommendable. Fire 5
resistant oils (with higher flash and fire points than those of the 6
mineral oils) should be used. Environmental reasons are also 7
supporting the development of new transformer oils with 8
improved biodegradability, so that in the event of a failure or 9
leakage the impact would be lower. Thus, the growing 10
demands for improved fire safety and environmental 11
sustainability have encouraged the research and development 12
of alternative fluids. 13
The main research lines of these liquids are focused in 14
silicone oils, natural and synthetic esters. The characterization 15
of silicone oils and synthetic esters has been studied by a few 16
authors [1-5]. However, the majority of the studies has been 17
focused in the physicochemical characterization of some 18
commercial natural esters, [6-8], or based on some specific 19
crop (coconut, palm, rapeseed…) [9-10]. Finally, some authors 20
have compared the main properties of these new fluids with 21
mineral oil in order to evaluate their suitability [11]. 22
On the other hand, there has been a lot of research about 23
cooling improvement in power transformers. The reason is 24
simple, high temperatures degrade the dielectric materials, oil 25
and paper, shortening their lifespan. In order to ensure a long 26
life for these machines, there are two types of approximations 27
for the calculation of their temperature and velocity 28
distributions: lumped parameter models and Computational 29
Finite Element-based Tools (CFET). The first method provides 30
fast and approximate results based on several simplifications 31
and empirical data. By contrast, the second one is more 32
accurate since it is based on the solution of the differential 33
equations governing processes. 34
Several papers have been published in last decade using CFET. 35
Nonetheless, we have to mention that the main goal of 36
practically all these papers is the determination of the velocity 37
and temperature profiles of a mineral oil inside a 2D section of 38
one winding. For instance, Mufuta and Van den Buck 39
described the flow pattern and its influence in the cooling of 40
the windings of a disc-type transformer by means of 41
dimensionless parameters (Nu, Re, Gr) applied on a 2D model 42
[12]. Six years later, El Wakil et al. studied the heat transfer 43
and fluid flow in two windings wound around a core of a step-44
down 3-phase layer-type power transformer by means of the 45
analysis of six different 2D-models [13]. In 2007, Rahimpur et 46
al. calculated the influence of some parameters (heat loss, 47
number of washers, height of the radiators and channel 48
geometry) over temperatures distribution of a 2D-model of a 49
natural convective cooled disc-type winding including block 50
washers [14]. . Two years later, Smolka et al., in addition to 51
perform a review about numerical simulations of the fluid 52
flow, heat transfer and electromagnetic phenomena, presented 53
an innovative 3D-coupled Computational Fluid Dynamics 54
(CFD) and ElectroMAGnetic (EMAG) simulation of a 3-phase 55
medium-power dry-type transformer [15]. In 2010, a 2D-56
model of a pass of a Low Voltage Winding (LVW) that 57
belongs to a 3-phase disc-type transformer was simulated 58
by Torriano et al. The main goal of this paper was to find 59
the influence of different inlet conditions on the flow and 60
temperature distributions. They also determined the location 61
of the hot-spots in the winding [16]. More recently, in 2012, 62
the same authors carried out a comparison between 2D and 3D 63
models of the same geometry, thus determining the existence 64
of three-dimensional fluid flow phenomena that cannot be 65
obviated such as it occurs in the 2D-model [17]. The same 66
year, Skillen et al. developed a 2D-model based on the 67
geometry of Torriano’s transformer with five passes in a 68
column. The presence of hot-plumes in some horizontal ducts 69
and the transmission of hot streaks from one pass to the next 70
(flow coupling) were the main conclusions of this paper [18]. 71
Again, in the same year, a 3-D model of a 15-kVA ONAN 72
transformer was carried out by Rosillo et al. in which oil 73
velocity profile and oil and winding temperature distribution 74
were calculated and experimentally validated in accordance 75
with the IEEE-1995 Loading Guide [19]. Finally, one year 76
before, Gastelurrutia et al. presented slices of several ONAN 77
distribution transformers (2D-models) in which the oil flow 78
and the thermal distributions were numerically calculated, thus 79
allowing the comparison of the results with the experimental 80
ones [20]. 81
All the papers mentioned in former paragraph use mineral 82
oil as dielectric liquid. Moreover, the majority of the models 83
used were performed in two dimensions in order to overcome 84
computational limitations. This type of 2D analysis is 85
discarded in this paper due to there is heat transfer in all 86
directions of the volume of our model; also, this 2D analysis 87
does not allow determinate the exact location of the hot spots. 88
For that reason, a 3D-section of the cooling ducts of the LVW 89
of a real power transformer is used in this paper. Even more, 90
this geometry is simulated using a physical model in which 91
buoyancies and viscous forces are the only considered 92
establishing the natural convection. As a result of this 93
simulation, a comparison of the main characteristics of a 94
mineral oil and three alternative liquids (a silicone oil, a natural 95
ester and a synthetic ester) is obtained. In order to carry out this 96
work, a thermal-fluid analysis has been performed using flow 97
rates, temperature and velocity distributions and parameters 98
such as the traditional convective heat transfer coefficient (h) 99
and the new one cooling criterion (P). 100
Section two presents a brief geometrical description of the 101
3D model that is used. The third section introduces the 102
numerical model considered. The studied parameters and the 103
analysis methodology are presented in the fourth section. 104
Simulation results and their comparison are shown in the fifth 105
section. Finally, findings are presented in the last section. 106
2. MODEL
GEOMETRY
DESCRIPTION
107The aforementioned comparison has been carried out by 108
using a section of the LVW of a three-phase power 109
transformer. In nominal regime, the electrical 110
characteristics of this transformer are 14 MVA, 66/6.3 kV, 111
Dyn11 and ONAN cooling. 112
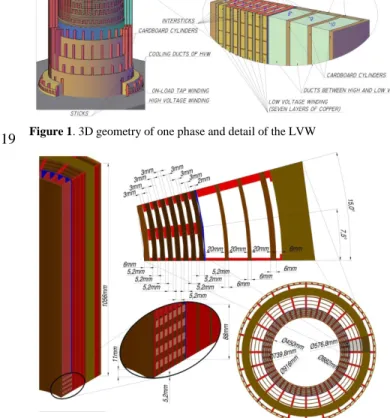
The self-explanatory Figure 1 (left side) and Figure 2 113
(bottom right corner) shows the three windings of a phase 114
of a three-phase transformer: LVW in the inner part; on-115
load tap winding in the outer part; finally, the High Voltage 116
Winding in the middle of both of them. 117
118
Figure 1. 3D geometry of one phase and detail of the LVW
119
Figure 2. Plant dimensioning of a phase and detail of the LVW
120
The LVW, shown in 3D dimensions in the right side of 121
Figure 1 and in 2D dimensions plan in the upper side of 122
Figure 2, is composed of an internal cardboard cylinder (6 123
mm thick and 450 mm of inner diameter) surrounded by 7 124
concentric layers with 11 copper turns by layer. Each turn 125
has 8 parallel plates (plate dimensions: 10.4mmx4.6mm) 126
that are wrapped with a dielectric paper of 0.3 mm width. 127
The layers are separated by means of 48 wooden sticks and 128
inter-sticks of 3 mm thick. This way, 48 cooling ducts of 129
7.5 degrees of amplitude are created between internal 130
cylinder and first layer, other 48 cooling channels between 131
first layer and second layer, and so on. Finally, the total 132
height of the LVW is 1,056 mm. 133
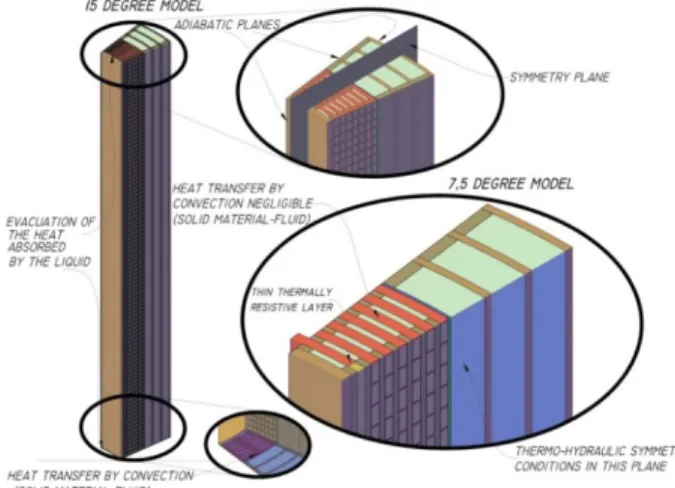
Self-explanatory Figure 3 allows understanding how the 134
geometrical design has evolved to achieve the optimal 135
model for solving numerically. In fact, the results 136
comparison of both models (15-degree model and 7.5-137
degree model) allows to demonstrate that there are no 138
significant differences between their temperatures and 139
velocities distributions. This way, 7.5-degree model has 140
been chosen. 141
142
Figure 3. Geometrical evolution of the model
3. NUMERICAL
MODEL
143This section presents the governing equations, the 144
physical model and its boundary conditions, computational 145
domain and mesh. 146
3.1. GOVERNINGEQUATIONS
147
This study is based on the numerical solution of the 148
momentum and continuity equations, (1) and (2) 149
respectively. It also solves the heat transfer equation, which 150 for a fluid is (3). 151 152 𝜌𝜌(𝒖𝒖 ∙ 𝛻𝛻)𝒖𝒖 = 𝛻𝛻 ∙ �−𝑝𝑝𝑰𝑰 + 𝜇𝜇(𝛻𝛻𝒖𝒖 + (𝛻𝛻𝒖𝒖)𝑇𝑇) −2 3 𝜇𝜇(𝛻𝛻 ∙ 𝒖𝒖)𝑰𝑰� + 𝑭𝑭 (1) ∇ ∙ (𝜌𝜌𝐮𝐮) = 0 (2) 𝜌𝜌𝐶𝐶𝑝𝑝𝐮𝐮 · ∇T = ∇ ∙ (k ∇𝑇𝑇) + 𝑞𝑞 (3) 153
The symbols ρ, u, p, I, µ, F, Cp T and q of (1), (2) and
154
(3) are density, velocity vector, pressure, identity matrix, 155
dynamic viscosity, body force vector, specific heat 156
capacity, temperature and unitary heat transfer, 157
respectively. 158
3.2. PHYSICALMODELANDBOUNDARY
159
CONDITIONS 160
All exterior solid walls of the geometric model are 161
considered adiabatic surfaces (see (4) in which k is the 162
thermal conductivity) apart from the bottom solid surfaces. 163
Also, the internal energy increase of the coolant between 164
the oil inlets and outlets is considered (see details in left 165 side of Figure 3). 166 167 −𝒏𝒏 ∙ (−𝑘𝑘∇𝑇𝑇) = 0 (4) 168
Convective cooling between the bottom solid surfaces 169
and the oil is supposed, considering the inlet temperature of 170
the liquid in the ducts as oil temperature (Toil,inlet=35ºC) (see
171
detail in bottom left side of Figure 3) (see (5) in which n is 172
the normal vector to boundary surface). 173
174
−𝒏𝒏 ∙ (−𝑘𝑘∇𝑇𝑇) = ℎ ∙ (𝑇𝑇 − 𝑇𝑇𝑜𝑜𝑜𝑜𝑜𝑜,𝑜𝑜𝑖𝑖𝑜𝑜𝑖𝑖𝑖𝑖) (5)
175
No-slip condition is considered in the contact surfaces 176
between oil and the solid surfaces in the ducts (see (6)). 177
178
𝒖𝒖 = 0 (6)
179
Natural convection due to oil decreasing density with the 180
increase of the temperature is the main phenomenon that 181
determines the thermodynamic behavior inside the ducts 182
(see (7) in which g is the gravity acceleration). Also, 183
boundary conditions in inlets and outlets of the cooling 184
channels are pressure-based (see (8) for inlet pressure and 185
(9) for outlet pressure in which Toil,∞, and H are the
186
reference temperature of the model (35ºC) and the total 187
height of the ducts, respectively). 188 189 𝐹𝐹𝑧𝑧= −𝑔𝑔 ∙ 𝜌𝜌(𝑇𝑇); 𝜌𝜌(𝒖𝒖 ∙ ∇)𝒖𝒖 = ∇ ∙ �−𝑝𝑝𝑰𝑰 + 𝜇𝜇(∇𝒖𝒖 + (∇𝒖𝒖)𝑇𝑇) −2 3 𝜇𝜇(∇ ∙ 𝒖𝒖)𝑰𝑰� + 𝑭𝑭 (7) 𝑝𝑝 = 𝜌𝜌�𝑇𝑇𝑜𝑜𝑜𝑜𝑜𝑜,∞� ∙ 𝑔𝑔 ∙ 𝐻𝐻; �𝜇𝜇(∇𝒖𝒖 + (∇𝒖𝒖)𝑇𝑇) −23 𝜇𝜇(∇ ∙ 𝒖𝒖)𝑰𝑰� ∙ 𝒏𝒏 = 0 (8) 𝑝𝑝 = 0 (9) 190
Thermal-fluid symmetry has been modeled using (10) 191
and (11) (see detail in right-side of Figure 3). 192 193 −𝒏𝒏 ∙ (−𝑘𝑘∇𝑇𝑇) = 0 (10) 𝒖𝒖 ∙ 𝒏𝒏 = 0;𝑲𝑲 − (𝑲𝑲 ∙ 𝒏𝒏)𝒏𝒏 = 𝟎𝟎 where 𝑲𝑲 = [𝜇𝜇(∇𝒖𝒖 + (∇𝒖𝒖)𝑇𝑇)]𝒏𝒏 (11) 194
The wrapping paper is considered mathematically as a 195
thin thermally resistive layer whose thermal behavior is 196
modeled according (12) in which kp, Ti, To and dp are the
197
conductivity, the temperatures in the inside and outside 198
surfaces and the thickness of the paper, respectively (see 199
detail in right-side of Figure 3). 200
201
𝑞𝑞 = −𝑘𝑘𝑝𝑝(𝑇𝑇𝑜𝑜𝑑𝑑− 𝑇𝑇𝑜𝑜)
𝑝𝑝 (12)
202
Finally, a uniform volumetric heat source is considered 203
in the copper domain using the Joule losses that are 204
measured in a short-circuit test at 75ºC of the power 205
transformer (see (13) in which PJoule and V are the copper
206
loses in the 3-phase LVW and the volume of this winding, 207 respectively). 208 209 Q =PJouleV (13) 210
The above physical model has been solved via the 211
“Conjugate Heat Transfer” module of the commercial finite 212
elements-based software Comsol Multiphysics v4.3a. This 213
module allows combining the heat equation with either 214
laminar or turbulent flow. The similarity between the 215
geometric and physical models of our article and El-216
Morshedy’s paper [21], in addition to the higher viscosities 217
of our coolants (water is the coolant of the reference 218
article), allows us to establish that the heat transfer is going 219
to be carried out by natural convection under laminar flow 220
regime. 221
3.3. COMPUTATIONALDOMAINANDMESH
222
The computational domain considers both the liquid and 223
solid parts of the geometry in order to calculate the 224
temperature distribution in the entire model and the fluid 225
behavior inside the channels. The simulations took between 226
90 and 120 minutes using a workstation with two 227
processors at 2.66 GHz and 48 Gbytes of RAM with a 228
convergence criterion of 10-4 for the residuals values. 229
Initially, in the meshing convergence study, several mesh 230
types with different meshing densities are studied, thus 231
obtaining several configurations with similar solutions. In 232
this paper, among these last configurations, the simplest one 233
from the computational standpoint is selected. 234
Three types of mesh and different element sizes were 235
used depending on the level of accuracy required. 236
Regarding the solid domain, it was meshed with a free 237
tetrahedral grid of 240,642 elements and a very thin 238
tetrahedral transitional mesh of 332,373 elements between 239
this domain and the first wide channel (See blue and red 240
volumes in upper left-side of Figure 4). 92,162 extra-thin 241
hexahedral elements were generated by means of a sweep 242
method applied between the bottom and upper faces of the 243
first channel (upper right-side of Figure 4). The other two 244
wide channels were meshed with the same method but with 245
a coarser element size, thus generating 127,574 elements 246
(bottom right-side of Figure 4). Finally, each of the seven 247
narrow channels was meshed by means of eight boundary 248
layers of 0.19 mm width, thus generating 264,570 249
tetrahedral elements (Bottom left-side of Figure 4). 250
251
Figure 4. Computational mesh of the solid and fluid domains
3.4. MATERIALPROPERTIES
252
Figure 5 presents the four physical characteristics of the 253
five transformer liquids studied in this paper by means of 254
both their mathematical expressions and graphical plots in 255
the range of operating temperatures. These five dielectric 256
liquids are: one mineral oil, two silicone oils (one with 257
High Kinematic Viscosity (50 cSt, HKV) and other with 258
Low Kinematic Viscosity (25 cSt, LKV)), one natural ester 259
and one synthetic ester. The graphs are calculated using 260
data that are available in public datasheets since all of the 261
liquids are commercial oils. 262
The densities of these liquids decrease linearly with the 263
temperature. In the case of the viscosities, those of the 264
alternative liquids have higher values than mineral oil at 265
low temperatures, except the silicone oil with low viscosity. 266
However, this property diminishes exponentially with the 267
temperature, thus being practically equal at high 268
temperatures for all the liquids, except the silicon oil with 269
high viscosity. 270
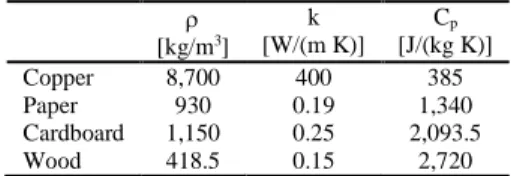
The winding layers are made of copper conductors that 271
are individually wrapped with insulation paper. Also, these 272
layers and four cardboard cylinders are separated by 273
wooden sticks and inter-sticks. The physical properties (ρ, 274
k, Cp) that are needed for all these materials in order to use
275
them in the simulations are shown in Table 1. These 276
properties are assumed to be constant with temperature. 277
Convective heat transfer coefficient at the bottom is 278
calculated considering a horizontal plate with down 279
external natural convection with oil at Toil,inlet=35°C.
280 281
Table1. Physical properties of solid materials
282 ρ [kg/m3] k [W/(m K)] Cp [J/(kg K)] Copper 8,700 400 385 Paper 930 0.19 1,340 Cardboard 1,150 0.25 2,093.5 Wood 418.5 0.15 2,720 283
4. STUDY
METHODOLOGY
284The coefficient h can be used to determine the cooling 285
capacity of the fluids in order to carry out a thermal 286
comparison. This comparison can be performed using the 287
alternative parameter P. Equations (14) and (15) present the 288
way to calculate them by using the simulation results. 289 290 𝒉𝒉 = 𝑸𝑸𝒄𝒄𝒉𝒉 𝑨𝑨 × �𝑻𝑻𝒂𝒂𝒂𝒂𝒂𝒂,𝒔𝒔𝒖𝒖𝒔𝒔𝒔𝒔𝒂𝒂𝒄𝒄𝒔𝒔− 𝑻𝑻𝒐𝒐𝒐𝒐𝒐𝒐,∞� (14) 𝑷𝑷 =𝑪𝑪𝒑𝒑× 𝒌𝒌 × 𝜷𝜷𝝂𝝂 (15) 𝑸𝑸𝒄𝒄𝒉𝒉= 𝐂𝐂𝐩𝐩,𝐚𝐚𝐚𝐚𝐚𝐚× 𝐦𝐦̇𝒄𝒄𝒉𝒉× (𝐓𝐓𝐚𝐚𝐚𝐚𝐚𝐚,𝐨𝐨𝐮𝐮𝐨𝐨𝐨𝐨𝐨𝐨𝐨𝐨− 𝐓𝐓𝐨𝐨𝐨𝐨𝐨𝐨,𝐨𝐨𝐢𝐢𝐨𝐨𝐨𝐨𝐨𝐨) (16) 291
The coefficient h is an experimentally determined 292
parameter which depends on many variables such as the 293
surface geometry, the nature of fluid motion and the 294
physical properties of the fluid. This coefficient allows 295
determining the efficiency of the heat transfer between a 296
solid surface and a fluid. The higher this number is, the 297
better the heat transfer by convection is. In this paper, it is 298
calculated according (14) in which Qch, A, Tavg,surface, are the
299
heat transfer between the copper and oil in each channel, 300
the heat transfer area of this channel and the average 301
temperature of this area, respectively. Qch is previously
302
estimated by means of the calculation of the internal energy 303
increase of the fluid between inlet and outlet surfaces (see 304
(16) in which the fluid properties Cp,avg, ṁ𝑐𝑐ℎ, and Tavg,outlet
305
and Toil, inlet are considered). The average heat capacity, the
306
flow rate and the average temperature at the outlets of the 307
ducts are the meanings of the first three properties. Also, 308
the oil temperature in the ducts inlets (Toil,inlet) is assumed as
309
reference temperature (Toil,∞).
310 311
312
The coefficient P depends on four physical properties of 313
the fluids that vary with temperature (See (16) in which 314
βandνarethe thermal expansion coefficient and the 315
kinematic viscosity, respectively) and it is used in 316
experimental studies to determine the heat transfer capacity 317
of different oils [22]. Thus, the higher P is, the lower the 318
average temperature of the fluid in each channel is. In each 319
channel, it is calculated by means of (15) using the average 320
values of the four properties. 321
5. RESULTS
322The model validation is shown in the first subsection. In 323
next subsection, temperatures and flow rates of the ducts 324
are presented. Finally, in third subsection, h a P results are 325
compared. 326
5.1. MODELVALIDATION
327
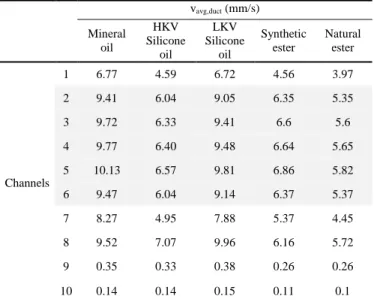
The comparison of the average velocities of the ducts 2-328
6, shown in Table 2, with those of the El-Morshedy’s article 329
[21] confirms the hypothesis that is initially supposed: the 330
flow regime of all the studied liquids is laminar in those 331
channels of our model that are similar, from the physical 332
and geometric standpoint, to that of the aforementioned 333
paper. 334
335
Table 2. Average velocities in the ducts (vavg,duct)
336 vavg,duct (mm/s) Mineral oil HKV Silicone oil LKV Silicone oil Synthetic ester Natural ester Channels 1 6.77 4.59 6.72 4.56 3.97 2 9.41 6.04 9.05 6.35 5.35 3 9.72 6.33 9.41 6.6 5.6 4 9.77 6.40 9.48 6.64 5.65 5 10.13 6.57 9.81 6.86 5.82 6 9.47 6.04 9.14 6.37 5.37 7 8.27 4.95 7.88 5.37 4.45 8 9.52 7.07 9.96 6.16 5.72 9 0.35 0.33 0.38 0.26 0.26 10 0.14 0.14 0.15 0.11 0.1
5.2. TEMPERATURESANDFLOWRATES
337
As initial point, it is necessary to point out that there are 338
two types of channels from the geometrical standpoint: 339
those ducts with narrow cross-section (channels 1-7), and 340
those with wide cross-section (channels 8-10). It is clear 341
that this geometrical feature has a major influence in the 342
flow rates and velocities of the channels, therefore, in their 343
temperatures (See Tables 2 and 3). Also, we can see that the 344
velocities of those fluids with higher viscosities in the 345
operating temperature range (ester-based liquid sand HKV 346
silicone oil) are lower than those of the other two liquids, 347
both in narrow and wide channels. 348
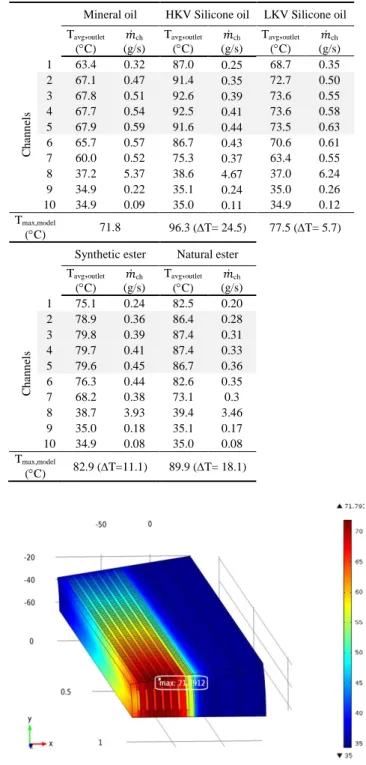
Table 3 shows the maximum temperature of the 349
geometry (Tmax,model), the Tavg,outlet and the ṁ𝑐𝑐ℎ in all the
350
ducts for all the liquids. In relation to the former, it can be 351
seen that if the alternatives liquids are used instead of the 352
mineral oil there is an increase in the maximum 353
temperatures. The location of these maximum temperatures 354
(hot-spots) for all the oils can be seen in Figure 6. All of 355
them are situated on the top of the geometry, in the middle 356
of contact area of fourth stick with the third winding layer. 357
This coincidence is justified in the fact that the location of 358
the hot-spots depend only on the physical model developed, 359
on the boundary conditions established and on the type of 360
geometry considered. In other words, the location of the 361
hot-spots doesn’t depend on the type of liquid used in the 362
coolant. 363
364
Table 3. Temperatures in the geometry and flow rates in cooling ducts
365
Mineral oil HKV Silicone oil LKV Silicone oil
Tavg,outlet (°C) (g/s) 𝑚𝑚̇ch Tavg,outlet (°C) (g/s) 𝑚𝑚̇ch Tavg,outlet (°C) (g/s) 𝑚𝑚̇ch C ha n n el s 1 63.4 0.32 87.0 0.25 68.7 0.35 2 67.1 0.47 91.4 0.35 72.7 0.50 3 67.8 0.51 92.6 0.39 73.6 0.55 4 67.7 0.54 92.5 0.41 73.6 0.58 5 67.9 0.59 91.6 0.44 73.5 0.63 6 65.7 0.57 86.7 0.43 70.6 0.61 7 60.0 0.52 75.3 0.37 63.4 0.55 8 37.2 5.37 38.6 4.67 37.0 6.24 9 34.9 0.22 35.1 0.24 35.0 0.26 10 34.9 0.09 35.0 0.11 34.9 0.12 Tmax,model (°C) 71.8 96.3 (∆T= 24.5) 77.5 (∆T= 5.7)
Synthetic ester Natural ester
Tavg,outlet (°C) (g/s) 𝑚𝑚̇ch Tavg,outlet (°C) (g/s) 𝑚𝑚̇ch C ha n n el s 1 75.1 0.24 82.5 0.20 2 78.9 0.36 86.4 0.28 3 79.8 0.39 87.4 0.31 4 79.7 0.41 87.4 0.33 5 79.6 0.45 86.7 0.36 6 76.3 0.44 82.6 0.35 7 68.2 0.38 73.1 0.3 8 38.7 3.93 39.4 3.46 9 35.0 0.18 35.1 0.17 10 34.9 0.08 35.0 0.08 Tmax,model (°C) 82.9 (∆T=11.1) 89.9 (∆T= 18.1) 366
Figure 6. Location of hot-spots
From here, those channels with similar thermal behavior 367
are going to be studied: the channels 2-5 have similar 368
average temperatures inside them (Tavg,ch) and similar
369
Tavg,outlet for the same fluid (See Table 3 and Figure 7). Also,
370
these channels have the highest temperatures if the same 371
liquid is considered. 372
Then, it is perceived that the use of alternative fluids 373
gives rise to an increase both in Tavg,outlet and Tavg,ch. In both
374
temperatures, the HKV silicone oil has the higher increment 375
(36.1% and 25.4% respectively). On the other hand, the 376
lower increment is in the case of LKV silicone oil (8.5% 377
and 6.6% respectively). The ester-based oils have 378
intermediate increments to those of the above. It is also 379
remarkable that the higher is the Tavg,outlet, the smaller is
380
Tavg,outlet-Tavg,ch. That is, higher temperature distributions in
381
the ducts are obtained with the new liquids. 382
383
Figure 7. Average temperatures in narrow channels
384
Regarding the flow rates, shown in Table 3, it can be 385
observed that mineral and LKV silicone oils have similar 386
flow rates. In the range of operating temperatures, they both 387
have similar viscosities. However, the mineral oil has 388
higher specific heat capacity (and its value increases with 389
the temperature) than that of the LKV silicone oil (its value 390
is constant with the temperature). This fact explains why 391
mineral oil is heated less than the LKV silicone-based fluid. 392
As a result, the density variation of the mineral oil is 393
smaller than that of the alternative liquid, thus obtaining a 394
slightly lower flow rate. On the other hand, the ester-based 395
liquids and HKV silicone oil have lower flow rates due to, 396
mainly, their high viscosities in the aforementioned 397
temperature range. In the case of ester-based fluids, the 398
density decrease and specific heat capacity increase with 399
the temperature does not completely offset the high viscous 400
stresses. This effect is even more important in the case of 401
the LKV silicone oil since the heat capacity is constant in 402
the range of the operating temperatures. So, the cooling 403
capacities of these last three alternative liquids are worse 404
than those of the mineral and LKV silicone oils: there are 405
higher temperatures in the winding, as can be seen in Table 406
3 and Figure 7. 407
5.3. COOLINGCAPACITYOFTHEFLUIDS
408
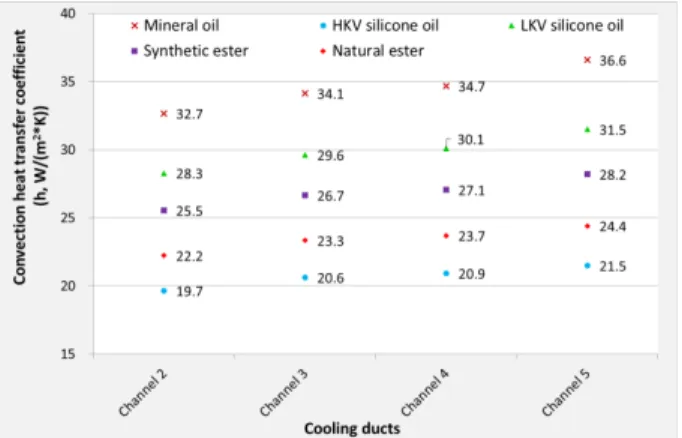
Figure 8 shows the average values of the coefficients h of 409
the five studied liquids in the channels two to five. As can 410
be seen in this Figure, the higher coefficient h belongs to 411
mineral oil, with values in the range of 30 to 40 W/ (m2 K).
412
The other coefficients are lower in a 13% (LKVsilicone 413
oil), 22% (synthetic ester), 32% (natural ester)and 40% 414
(HKV silicone oil),approximately. 415
416
Figure 8. Average convection heat transfer coefficient of the liquids
417
In the same way that in the Figure 8, the average values 418
of the P of the five studied liquids in the channels two to 419
five are shown in Figure 9. Again, according this parameter, 420
mineral oil is the best coolant, followed by the LKV 421
silicone oil, synthetic and natural esters, and HKV silicone 422
oil (27%, 43%, 48% and 68% smaller values than mineral 423
oil, respectively). 424
425
Figure 9. Average cooling criterion (P) of the liquids
426
There is an important difference between both 427
parameters: P only considers the physical properties of the 428
fluids and h also considers the flow characteristics in each 429
channel. This fact explains why the values of h vary with 430
the channel. However, the P values do not practically 431
change with the channel. This also explains the higher 432
differences in the cooling capacities between alternative 433
liquids and the mineral oil using P instead of h. 434
Nonetheless, it seems to be clear that the new parameter can 435
also be used to classify the fluids according their 436 refrigeration capacities. 437 438
6. CONCLUSIONS
439In the present study, the thermal-fluid behavior of five 440
dielectric liquids (four alternative fluids and a traditional 441
one) have been studied. In addition to the flow rates, 442
velocities and temperatures patterns are analyzed in order to 443
establish thermal-fluid differences. Also, h and P are used 444
to compare their cooling capacities. All the above is 445
calculated using the numerical results of a 3D-model of a 446
LVW of a transformer with ONAN cooling. This type of 447
cooling has been performed by means of a physical model 448
in which buoyancies and viscous forces are only 449
considered. 450
As a result of the analysis of the aforementioned 451
parameters, among the studied liquids, it is clear that the 452
mineral oil is the better coolant, followed by the LKV 453
silicone oil, synthetic ester, natural ester, and HKV silicone 454
oil. It is remarkable that the viscosities of the biodegradable 455
liquids and the HKV silicone oilare so high (especially with 456
low temperatures) that their cooling capacities are 457
negatively affected in an important manner, especially in 458
the case of the HKV silicone oil. Regarding the LKV 459
silicone oil, in comparison with the mineral oil, its main 460
drawback is its worse specific heat capacity. 461
It seems to be clear that the 3D simulations can be used 462
to compare properly the cooling capacities of the liquids 463
using traditional parameters such as the convection heat 464
transfer coefficient or new ones, such as the cooling 465
criterion. 466
ACKNOWLEDGMENT 467
The research leading to these results has received 468
funding from multiple sources during years but we would 469
specifically like to acknowledge the support received in the 470
later stages from the Spanish Plan Estatal de I+D under the 471
grant agreement DPI2013-43897-P. 472
REFERENCES 473
[1] E. Gockenbach, H. Borsi, Natural and synthetic ester liquids as
474
alternative to mineral oil for power transformers. Presented at Annual
475
Report Conference on Electrical Insulation and Dielectric Phenomena,
476
CEIDP 2008, Quebec City, QC, 2008, pp. 521-524.
477
[2] H. Borsi, E. Gockenbach, Properties of ester liquid midel 7131 as an
478
alternative liquid to mineral oil for transformers. Presented at IEEE
479
International Conference on Dielectric Liquids, ICDL 2005, Coimbra,
480
2005, pp. 377-380.
481
[3] R. Eberhardt, H. M. Muhr, W. Lick, B. Wieser, R. Schwarz, G. Pukel,
482
Partial discharge behaviour of an alternative insulating liquid compared to
483
mineral oil. Presented at IEEE International Symposium on Electrical
484
Insulation,ISEI 2010, San Diego, CA, 2010.
485
[4] H. Borsi, “Dielectric behavior of silicone and ester fluids for use in
486
distribution transformers,” IEEE Trans Electr Insul, vol. 26, pp. 755-762,
487
10 September 1990 through 14 September 1990, 1991.
488
[5] H. Kuwahara, K. Tsuruta, H. Munemura, T. Ishi, H. Shiomi, “Partial
489
discharge characteristics of silicone liquids,” IEEE Trans Electr Insul,vol.
490
EI-11, pp. 86-91, 1976.
491
[6] T. V. Oommen, C. C. Claiborne, E. J. Walsh, J. P. Baker, New
492
vegetable oil based transformer fluid: Development and verification.
493
Presented at IEEE Conference on Electrical Insulation and Dielectric
494
Phenomena, BC, Can, 2000, pp. 308-312.
495
[7] C. C. Claiborne, T. V. Oommen, E. J. Walsh, “Specification issues
496
associated with the development of an agriculturally based biodegradable
497
dielectric fluid,” ASTM Spec. Tech. Publ., pp. 37-46, 15 March 1999
498
through 15 March 1999, 2000.
499
[8] P. Boss, T. V. Oommen, New insulating fluids for transformers based
500
on biodegradable high oleic vegetable oil and ester fluid. Presented at IEE
501
Colloq. Dig., pp. 39-48, 1999.
502
[9] U. U. Abdullahi, S. M. Bashi, R. Yunus, Mohibullah, H. A. Nurdin,
503
The potentials of palm oil as a dielectric fluid. Presented at National Power
504
and Energy Conference, PECon 2004, Kuala Lumpur, 2004, pp. 224-228.
[10] J. Li, S. Grzybowski, Y. Sun, X. Chen, Dielectric properties of
506
rapeseed oil paper insulation, 2007 Annual Report - Conference on
507
Electrical Insulation and Dielectric Phenomena, CEIDP, Vancouver, BC,
508
2007, pp. 500-503.
509
[11] I. Fernández, A. Ortiz, F. Delgado, C. Renedo, S. Pérez,
510
“Comparative evaluation of alternative fluids for power transformers,”
511
Electr. Power Syst. Res., vol. 98, pp. 58-69, 2013.
512
[12] J. -. Mufuta, E. Van Den Bulck, “Modelling of the mixed convection
513
in the windings of a disc-type power transformer,” Appl. Therm. Eng., vol.
514
20, pp. 417-437, 2000.
515
[13] N. El Wakil, N. -. Chereches, J. Padet, “Numerical study of heat
516
transfer and fluid flow in a power transformer,” Int. J. Therm. Sci., vol. 45,
517
pp. 615-626, 2006.
518
[14] E. Rahimpour, M. Barati and M. Schäfer, “An investigation of
519
parameters affecting the temperature rise in windings with zigzag cooling
520
flow path,” Appl. Therm. Eng., vol. 27, pp. 1923-1930, 2007.
521
[15] J. Smolka, O. Bíró, A. J. Nowak, “Numerical simulation and
522
experimental validation of coupled flow, heat transfer and electromagnetic
523
problems in electrical transformers,” Arch. Comput. Methods Eng., vol. 16,
524
pp. 319-355, 2009.
525
[16] F. Torriano, M. Chaaban, P. Picher, “Numerical study of parameters
526
affecting the temperature distribution in a disc-type transformer winding,”
527
Appl. Therm. Eng., vol. 30, pp. 2034-2044, 2010.
528
[17] F. Torriano, P. Picher, M. Chaaban, “Numerical investigation of 3D
529
flow and thermal effects in a disc-type transformer winding,” Appl. Therm.
530
Eng., vol. 40, pp. 121-131, 2012.
531
[18] A. Skillen, A. Revell, H. Iacovides, W. Wu, “Numerical prediction of
532
local hot-spot phenomena in transformer windings,” Appl. Therm.
533
Eng.,vol. 36, pp. 96-105, 2012.
534
[19] M. E. Rosillo, C. A. Herrera and G. Jaramillo, "Advanced thermal
535
modeling and experimental performance of oil distribution transformers,"
536
IEEE Trans Power Delivery, vol. 27, pp. 1710-1717, 2012.
537
[20] J. Gastelurrutia, J. C. Ramos, G. S. Larraona, A. Rivas, J. Izagirre, L.
538
Del Río, “Numerical modelling of natural convection of oil inside
539
distribution transformers,” Appl. Therm. Eng., vol. 31, pp. 493-505, 2011.
540
[21] S. E. D. El-Morshedy, A. Alyan, L. Shouman, “Experimental
541
investigation of natural convection heat transfer in narrow vertical
542
rectangular channel heated from both sides,” Exp. Therm. Fluid Sci., vol.
543
36, pp. 72-77, 2012.
544
[22] C. Perrier, A. Beroual, J. -. Bessede, “Improvement of power
545
transformers by using mixtures of mineral oil with synthetic esters,” IEEE
546
Trans. Dielectr. Electr. Insul., vol. 13, pp. 556-564, 2006.
547 548
Ramón Lecunawas born in Torrelavega, on July 14, 1967. He received the M.Sc. degree in industrial engineering in 2000 and he is currently pursuing the Ph.D. degree from the University of Cantabria (UC), Spain. Currently, he is Assistant Professor in the Electrical and Energy Engineering Department of the UC. He has published 1 work in international conferences. Finally, his main research topic is currently the study of the alternative dielectric liquids in power transformers.
549
Fernando Delgado was born in Santander, on March 26, 1968. He received the M.Sc. degree in industrial engineering in 1998 and the Ph.D. degree in 2011 from the University of Cantabria (UC), Spain. Currently, he is Associate Professor in the Electrical and Energy Engineering Department of the UC. He has published over 25 works in international conferences and 13 papers in journals included in the Journal of Citation Report. Finally, his main research topic is currently the
study of the alternative dielectric liquids in power transformers.
550
Alfredo Ortiz was born in Santander, on September 9, 1971. He received the M.Sc. degree in industrial engineering in 1997 and the Ph.D. degree in 2005 from the University of Cantabria (UC), Spain. Currently, he is Associate Professor and the Head of Electrical and Energy Engineering Department at the UC. He has published six chapters in international books, over 50 works in international conferences and XX papers in journals included in the Journal of Citation Report. Finally, his main research topic is currently the study of the alternative dielectric liquids in power transformers.
551
Pablo B. Castrowas born in Gijón, on July 12, 1979. He received the M.Sc. degree in industrial engineering in 2004 and the Ph.D. degree in 2011 from the University of Valladolid (UVA), Spain. Currently, he is Assistant Professor of Electrical and Energy Engineering Department at the UC. He has published 10 works in international conferences and 7 papers in journals included in the Journal of Citation Report. Finally, his main research topic is currently computational fluid dynamics and numerical heat transfer, renewable energies and energy efficiency.
552
Inmaculada Fernández was born in Zaragoza, on July 31, 1981. He received the M.Sc. degree in chemical engineering in 2004 and the Ph.D. degree in 2009 from the University of Cantabria (UC), Spain. Currently, he is Assistant Professor in the Electrical and Energy Engineering Department of the UC. He has published two chapters in international books, over 20 works in national and international conferences and 9 papers in journals included in the Journal of Citation Report. Finally, his main research topic is the energy saving.
553
Carlos J. Renedowas born in Santander, on November 03, 1969. He received the M.Sc. degree in industrial engineering in 1997 and the Ph.D. degree in 2002 from the University of Cantabria (UC), Spain. Currently, he is Associate Professor in the Electrical and Energy Engineering Department of the UC and Vicedean of the School of Industrial Engineering and Telecommunications. He has published over 50 works in international conferences and 24 papers in journals included in the Journal of Citation Report. Finally, his main research topic is the energy saving.