Sustainable Mobility in Metropolitan Areas
María Eugenia López- Lambas
PhD. Associate professor. Universidad Politécnica Madrid (UPM) Research Transport Centre TRANSyT-UPM
Abstract
Transport is one of the four priorities of the EU Thematic Strategy on Urban Environment. Cities concentrate 80% of European population and transport is a key element for their economic vitality. However it also pro-duces pollution, noise, global warming, congestion, etc.
Some cities have faced the problem- particularly aggravated by this rela-tively new phenomenon known as urban sprawl, perfectly distinguishable in new housing developments perfectly unsustainable-, through integrated strategies which takes account of the interrelations among land use pat-terns, transport supply and, last but not least, the role of the different modes of transport, in a sort of co-modality that includes walking and cy-cling. Sustainable Urban Transport Plan for cities or Company Manage-ment Plans for big industries look for those objectives.
This paper presents some experiences around Europe: Holland, Spain, France, UK, etc., and their legislative and policy framework. These good practices show how to combine the right level of provision of infrastruc-tures to attend mobility demand, taking care for quality of life and envi-ronmental standards in new urban and business developments. The paper points out the key elements of a mobility plan, its phases, measures and the importance of a well designed public participation procedure.
1.
Introduction
- Europe is one of the most urbanised continents. Approxi-mately 75 % of its population lives in urban areas; by 2020, this will be 80 % (EEA).
- EU-27 greenhouse emissions would have fallen (1990-2005) by 14% instead of 7,9% (TERM). Short term projections indi-cate that 2010 greenhouse gas emissions will be the same as in 2005.
- Urban transport contributes to 40% of transport related CO2 emissions and is responsible for 70% of emissions of other pollutants arising from road transport.
- The number of road traffic accidents in cities is continuously growing: one in three fatal accidents happens in urban areas. - According to the World Health Organisation, about 100 000
deaths a year could be linked to ambient air pollution in cities in Europe.
- NO2 and PM10 concentrations at selected traffic monitoring
stations indicate that cities are at or above European quality air limits.
With this panorama, it is not surprising consider transport as the villain of the movie, guilty of almost every wrong thing regarding environment and, all in all, quality of life. But transport sector may –must- be seen from different perspectives, depending obviously on which side are we. So, from an economic point of view, transport contributes for more than 10% of the GDP of the European Union, and gives employment to more than 10 million people in the same context. On the other side, as a social cohesion and land integration factor transport means other interesting and by no means insignificant key aspect for economic competitiveness of the differ-ent countries, fostering a number of associated activities, such as auto-propulsion industry, assets, etc.
This said, transport has a dark but not hidden side, linked to the sustain-able development of our societies, focused on one of the three pillars of what we have called “sustainability”: the environment, in such a way that being the results positive in social and economic, not the same can be said regarding this third one. In other words: transport, and most of all, urban transport, is one of the main responsible of pollution and climate change, not to mention the high energy consumption, noise, dead and injuries, ill-ness, congestion1[2], etc. In fact, in Spain road traffic congestion counts for
around 0,2% of the GDP [3].
Since the aim of this paper is not to provide detailed information on well known issues -emissions, climate change, etc.,- we will focus on how some cities have faced this problem through integrated strategies which take into account the interrelations among land use patterns, transport supply and the role of the different modes of transport, individual and collective, bene-fiting from the co-modality promoted by the European Union in one of its most recent documents, the Green Paper: Towards a new culture for ur-ban mobility that, obviously, includes walking and cycling as well [4]
That integrated approach, searching the balanced coordination of land use and mobility, is well expressed through the Local Transport Plans (LTP, United Kingdom), Plans de Déplacements Urbains (PDU, France), Piano de Mobilitá Urbana (PUM, Italy), Planes de Movilidad Urbana Sostenible (PMUS, España), and the generic umbrella for all of them: Sus-tainable Urban Transport Plans (SUTP) [5]. This apparently tongue twister (PDU, LTP, PUM, PMUS, etc.), has a common set of features through which many cities have proven that, many times, simple solutions are the most effective:
- Covers the whole urban area
- Aims to reduce the negative impacts of transport and tackle the rising volumes of traffic and congestion
- Uses to be linked to national/regional strategies - Covers all modes of transport
- Includes people and goods
- Modal shift in favour of “soft” and alternatives modes
Furthermore, all those strategies involve the coordination and competent use of the different modes of transport to enhance the shift to more energy efficient transport modes, to reduce transport demand and to foster the im-plementation of technological measures.
2.
From PDU to PUM and PMUS, going through LTP:
the tongue twister of urban mobility
Trans-port Ministry as the first one, and in the framework of the territorial coher-ence scheme, obliges to set road safety objectives and to be compatible with the land use planning [6].
PDUS – time horizon, 10 years- are elaborated, passed and implemented by the Public Transport Authority, after a public survey process. Local Au-thorities inside the performance perimeter of the Transport Authority are responsible for the funding (except for Île de France (Paris). Nowadays, the Regions and Departments fund the plan.
As main results, PDU’s have put the urban transport plans on the politi-cal agenda and that has been translated into the implementation of a lot of tramways, the construction of exclusive bus lanes, a decisive parking pol-icy), the deep involvement of the stakeholders and the increasing in the number of travel plans, among others important outcomes [7]. Neverthe-less, is always difficult to assert to what extent the good effects on urban mobility are only due to PDU’s, since population ageing or price of fuel, for instance, can also influence [8,9].
More recently, in France have been also launched the so-called “micro PDU”, made of specific proposals around the local PDU, such as areas 30, pedestrianisation, parking schemes, bike lanes, etc. Sometimes, those mi-cro plans realized in green commuter plans or company transport plans, usually through soft measures such as public transport, on foot and bicycle.
United Kingdom. LTPs are landmark documents that require authori-ties to plan a five year programme for managing transport services within a comprehensive and multi modal strategy to achieve local and national ob-jectives [8], i.e., must be consistent with the national plans and goals, both in transport and other issues. After the five years period, the plan is evalu-ated by the Local Transport Authorities [10].
The first round of LTPs were launched for the period 2000/05, follow-ing the Transport Act issued in year 2000, that gave to the local authorities the competencies to implement those plans and, in order to help the au-thorities to do so, the Government launched a guide that sets the following objectives: to protect the environment, to improve passengers safety, to promote the sustainable growth of the economy, to provide global accessi-bility, especially for those without a car and to integrate land use and transport policies [11]
The objectives must be coherent with the national goals
Funding: National Government, if the annual report is positive. Then, the Local Authority can be eligible for 75% of the investment, plus 25% depending on the quality evaluation and level of achievement.
A new guide for the second round of plans (2006/2011) has been now launched.
Italy. Italian PUM,s [12] starts in 1996, with a Law from the Public Works Ministry on Urban Traffic Plans for cities with more than 30,000 inhabitants. Then, the law 340/2000 and the National Transport Plan de-fined the methodology for its implementation. Stricto sensu only the traffic plans are compulsory (i.e, appropriate disciplinary measures are taken), since the mobility plans are responsibility of those cities and regions with more than 100,000 inhabitants which can obtain funds from the National Government (up to 50% of the investment costs of the measures planed in the PUM).
There are a set of national guidelines for the implementation, even if the region produce its own. These guidelines define a set of indicators to measure the effectiveness of the programme. Anyway, the goal is to inte-grate the PUM at sectoral level, i.e., with the PUT and with the urban and environmental planning.
Time horizon: 10 years, with a bi-annual review.
Funding: National Government 60% of the investment (as a maximum), and the rest between municipalities and regions.
Objectives: to satisfy the citizen’s mobility needs, reduce pollution, noise, energy consumption and private car use, to increase the road safety, to foster car-pooling and car-sharing as mechanisms to reduce congestion in urban areas.
Spain. The Sustainable Urban Mobility Plans (SUMP) [13] were launched in the framework of a strategic and well defined plan, made up of the Master Plan for Infrastructures and Transport and the Energy Saving and Efficiency Strategy. Apart from that, and with the remarkable excep-tion of the Mobility Law issued by the Catalan Government in 2003, there is not any compulsory rule to implement them.
The guide recommends to those municipalities with more than 50,000 inhabitants the adoption of a SUMP, within a time horizon depending on the kind of measures to be implemented, 2 to 8 years.
Regarding the objectives, the guide does not provide a list beyond those that the word “sustainable” suggests: it will depend on each case, since the needs of each city differs from one to another, but recommends to keep the plan within a regional strategy, coordinating both levels: municipal and re-gional.
3.
Some strategies and measures
There are four basic policy categories in SUTP: 1) Reducing the need for motorised transport, 2) enhancing modal shift, 3) developing clean and silent transport systems, 4) improving transport efficiency (Sustainable Urban [14].
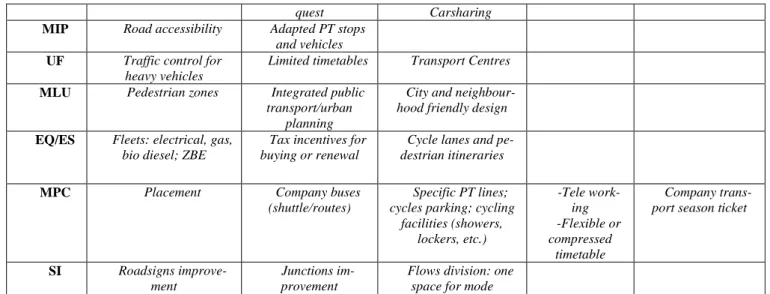
Very schematically, those are some measures to be implemented by means of a SUTP, grouped by intervention areas [13]:
Traffic management and control (TMC) Parking management (PM)
Fostering public transport (PT) Recovery urban quality (UQ)
Mobility management through specific measures (MM) Improvement mobility for impaired people (MIP) Urban freight transport (UF)
Integrated mobility and land use policies (MLU)
Environmental quality improvement and energy saving (EQ/ES) Mobility plans for large companies (MPC)
Safety improvement (SI)
TMC Traffic calming, speed limits 30km/h, etc.
Junctions regula-tion: bus priority and
trams
Ring roads: only when connecting routes
PM Blue areas, more parking spaces
Park & ride
PT Interchanges (design, location inte-gration in the city)
Exclusive lanes, HOV lanes
Network enlarge-ment, frequency, fleet renewal, interlinks, etc.
Integrated tariff system
New technolo-gies: information,
ITS, etc.
UQ Pedestrian zones Cycle lanes Bicycle loans Bicycle park-ing
quest Carsharing
MIP Road accessibility Adapted PT stops and vehicles
UF Traffic control for heavy vehicles
Limited timetables Transport Centres
MLU Pedestrian zones Integrated public transport/urban
planning
City and neighbour-hood friendly design
EQ/ES Fleets: electrical, gas, bio diesel; ZBE
Tax incentives for buying or renewal
Cycle lanes and pe-destrian itineraries
MPC Placement Company buses (shuttle/routes)
Specific PT lines; cycles parking; cycling
facilities (showers, lockers, etc.) -Tele work-ing -Flexible or compressed timetable Company trans-port season ticket
SI Roadsigns improve-ment
Junctions im-provement
Flows division: one space for mode
Table 1. Possible measures of a Sustainable Urban Mobility Plans. Source: Own, from Guía práctica para la elaboración e implementación de PMUS.
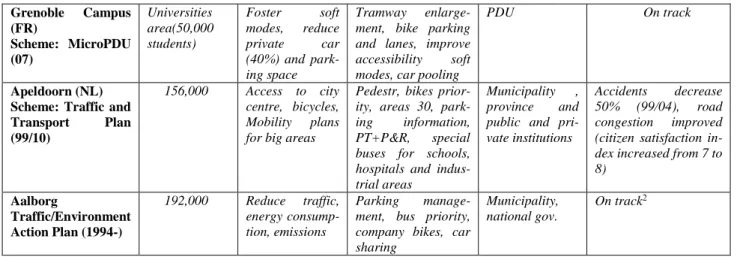
The lack of space prevents this paper from showing the analysis of cases which would result on a more detailed benchmarking exercise. So, let’s say that each country has developed its legislation, rules or guidelines hav-ing in mind the different needs of their municipalities. The monitorhav-ing process carried out by and in each one of them, shows different results against the specified objectives of the plan.
City Population Main objectives Measures Funding Monitoring
Lille
Metropole ( FR) Scheme: PDU
1,2million 87 communes
Double PT use2000/2015
Increase PT offer and network, inter-changes
Communauté urbain, region, department, UE
-PT increased 30% 98/06)
-Private car reduce
Darlington (UK) Scheme: LTP
100,000 Accesibility, congestion, air quality(00/06)
Integrated transport (PT, cycles, pedes-trian), road safety; maintenance
£ 3,062(05/06) (National, re-gional, local)
On track
Burgos (SP) 160,000 Reduce emis-sions, PT, re-cover public space
(05/09)
Restricted access, parking strategy, PT improvement, bio-diesel, public bike scheme
UE (Civitas), municipality, re-gion
90%pedest.,
100%public fleet bio-diesel, increase num-ber of cyclists, 3 off-street parking, PT=
Genoa (IT) Scheme: PUM
622,000 (MA) PT, reduce pol-lution, renew-able, reduce traffic in city centre, road safety
Access control, ur-ban toll, collective taxis, parking infor-mation, PT clean ve-hicles
UE (Civitas), national, Re-gion, Munici-pality,
Grenoble Campus (FR)
Scheme: MicroPDU (07)
Universities area(50,000 students)
Foster soft modes, reduce private car (40%) and park-ing space
Tramway enlarge-ment, bike parking and lanes, improve accessibility soft modes, car pooling
PDU On track
Apeldoorn (NL) Scheme: Traffic and Transport Plan (99/10)
156,000 Access to city centre, bicycles, Mobility plans for big areas
Pedestr, bikes prior-ity, areas 30, park-ing information, PT+P&R, special buses for schools, hospitals and indus-trial areas
Municipality , province and public and pri-vate institutions
Accidents decrease 50% (99/04), road congestion improved (citizen satisfaction in-dex increased from 7 to 8)
Aalborg
Traffic/Environment Action Plan (1994-)
192,000 Reduce traffic, energy consump-tion, emissions
Parking manage-ment, bus priority, company bikes, car sharing
Municipality, national gov.
On track2
Table 2. Measures of a Sustainable Urban Mobility Plan. Source: Own
It is important to remark that, despite the long list of cities analysed, only a few provide data regarding the quantitative reduction of emissions. Almost all of the plans give information about the impact of the measures on congestion and modal shift, which obviously have positive effects on urban environment, but it is not enough since detailed consideration of lo-cal circumstances should be needed.
4.
Results and discussion
As it can be seen, each country names its urban mobility plans in a dif-ferent manner: PDUs, PTUS, PUM, LTP are all difdif-ferent names given to the same reality. But, as “head document” above all of them the UE is re-markable the recent Green Paper Towards a new culture for urban mobility (COM 2007), that claims for integrated urban mobility approaches, ex-pressed in Sustainable Urban Transport Plans (SUTP). This document
2Ad exemplum: regarding environmental and energy impacts of the parking system in-formation, calculations of energy reductions were made on the basis of an average speed of 30 km/h. All 'searching' traffic is car. 20% of all cars are equipped with catalytic exhaust purifiers. Based on this the reduction in energy consumption will be 3521 MJ or 971 l of petrol daily. On an annual basis this is 980,000 MJ or 29,400 l of petrol.
proves that it is time to act and3, so, the European Commission committed
itself to produce guidelines to implement those plans, not yet published. These guidelines should be the umbrella to cover the different national plans, suggesting a minimum content for each one in such a way that all of them had a common evaluation framework, with a set of indicators and goals that allowed, through a benchmarking exercise, the dissemination of good practices. Anyway, it is indifferent the use of the term “transport” or “mobility” as long as the plan reflects the concept of mobility regarding objectives, policies and measures (Expert Working Group on SUTP, Ru-precht Consult, 2004)
On the other hand, being true that there is nothing new under the sun, we could ask then which could be the added value of the EU initiative de-rived from the Green Paper. The answer adopts different forms: promot-ing the exchange of good practices at all levels (local, regional and na-tional); underpinning the establishment of common standards and the harmonisation of standards if necessary; offering financial support to those who are in greatest need of such support; encouraging research the applica-tions of which will make it possible to bring about improvements in mobil-ity safety and environmental; simplifying legislation and, in some cases, repealing existing legislation or adopting new legislation. Not certainly minor questions to put into practice, although none of them are a big nov-elty.
The cases analysed in this paper show that regardless the existence or not of a specific law, and the different names adopted, there are some countries where successful urban mobility plans have been implemented. In Spain, for instance, these plans are not compulsory, but there are many municipalities that have started to implement them benefiting from the na-tional subsidies, what is, at last, the main problem: funding.
And, just regarding on funding schemes, is very important to link it to the achievement of the objectives (as in the UK). And closely related to this we must remark the importance of a good set of key, homogeneous, available and clear indicators that allow to calculate the effectiveness and level of achievement of the measures implemented which, in turn, will al-low to design alternatives, becoming a key support of the decision making process.
Another important aspect is the need of coordination between the differ-ent levels of the administration, both hierarchical and horizontal, i.e, Na-tional Government/ Region/Department/Local, and between departments of the same administration, beyond informal cooperation agreement. The
coordination is especially visible in France and the UK, where the urban plans must be coherent and consistent with the national and regional land use planning, and with the air quality legislation. In the second case (UK), integration with sectoral policies (disabled, social inclusion, noise) is re-quired as well.
Plans must be realistic, since in some cases seems obvious that the ob-jectives are clearly Utopian, as public institutions seems more interested in “sell” it than in implement it (at last, are the citizens who vote). Some-times, in fact, results may be better acting on a small area, such as univer-sities, whose mobility is half a commuter plan and half an urban mobility plan.
Finally, it is highly recommended to avoid the temptation brought about by the language tricks: pompous names do not turn into better what is not and, all in all, it is the same a Sustainable Urban Mobility Plan that a Local Development Strategy…as long as it is sustainable, of course.
5. REFERENCES
[1] EUROPEAN ENVIRONMENT AGENCY. TERM 2007: Indicators tracking transport and environment in the European Union (Report 1/2008).
[2] EUROPEAN COMMISSION White Paper European Transport Policy for 2010: time to decide (COM (2001) 370 final).
[3] INFRAS-IWW. External costs of transport. October 2004.
[4] EUROPEAN COMMISSION. Green Paper: Towards a new culture for urban mobility COM (2007) 551.
[5] EUROPEAN COMMISSION. Communication from the Commission to the Council and the European Parliament on Thematic Strategy on the Urban En-vironment. SEC (2006) 16.
[6] Loi d’Orientation des Transports Intérieurs (LOTI), 1982; Loi sur l'Air et l'Utilisation Rationnelle de l'Energie (LAURE) 1998; Loi Solidarité et Renou-vellement Urbain (SRU), 2000.
[7] CENTRE D’ETUDES SUR LES RESEAUX, LES TRANSPORTS, L’URBANISME ET LES CONSTRUCTIONS PUBLIQUES (CERTU). Les Plans de déplacements Urbains. Guide Méthodologique. 1996.
[8] THEVENON, JEAN (CERTU) “The urban travel plan in France: 25 years on. From UTP to SUTP?” IDAE, Espacios Urbanos Espacios Humanos…hacia una movilidad sostenible”, Madrid, March 14-15, 2007.
[9] THOMÉ, BENOÎT, Local public transport organisation in France: A new deal? Seventh THREDBO Conference, Molde (Norway) - June 2001.
[11] MINISTERIO DE MEDIOAMBIENTE. Planes de Movilidad Urbana. Tec-nologías de Reducción de Emisiones en el Transporte. Madrid, 21-22 Sep-tember 2005.
[12] EXPERT GROUP IN GROUP ON SUSTAINABLE URBAN TRANSPORT PLANS. Final Report 17 December 2004.
[13] INSTITUTO PARA LA DIVERSIFICACIÓN Y EL AHORRO DE ENERGÍA. Guía práctica para la elaboración e implementación de Planes de Mo-vilidad Urbana Sostenible, IDAE, Madrid, 2006.