Improving Automatic Detection of Obstructive Sleep Apnea
Through Nonlinear Analysis of Sustained Speech
José Luis Blanco • Luis A. Hernández • Rubén Fernández • Daniel Ramos
Abstract We present a novel approach for the detection of severe obstructive sleep apnea (OSA) based on patients' voices introducing nonlinear measures to describe sus-tained speech dynamics. Nonlinear features were combined with state-of-the-art speech recognition systems using sta-tistical modeling techniques (Gaussian mixture models, GMMs) over cepstral parameterization (MFCC) for both continuous and sustained speech. Tests were performed on a database including speech records from both severe OSA and control speakers. A 10 % relative reduction in classi-fication error was obtained for sustained speech when combining MFCC-GMM and nonlinear features, and 33 % when fusing nonlinear features with both sustained and continuous MFCC-GMM. Accuracy reached 88.5 % allowing the system to be used in OSA early detection. Tests showed that nonlinear features and MFCCs are lightly correlated on sustained speech, but uncorrected on continuous speech. Results also suggest the existence of nonlinear effects in OSA patients' voices, which should be found in continuous speech.
Keywords Obstructive sleep apnea (OSA) • Continuous speech • Sustained speech • Gaussian mixture models (GMMs) • Nonlinear analysis • Speech dynamics • Classification and regression tree (CART)
Introduction
Speech technologies have gained new interest in recent years due to applications related to the identification of clinical disorders affecting, directly or indirectly, the production of speech. Long-term efforts devoted to enhance automatic speech and speaker recognition tools are currently being reworked to consider whether they could be used in describing characteristic patterns in these nonconventional applications aiming to enhance the characterization of the upper airway (UA) condition.
others focused on particular aspects of nonlinear system dynamics. The first approach would require a more disrup-tive review of the problem at hand, whereas the second one could be worked out on top of the most successful existing speech processing technologies. Features and algorithms have been developed in recent years on complex dynamics and could be used to extend our construction of the models on speakers' records and enhance the performance of speech processing tools for the automatic detection of clinical dis-orders affecting the production of speech.
Speech recording and posterior processing are noninva-sive procedures involving negligible costs and efforts, especially when compared to those used in most clinical tests. This has boosted the use of speech analysis tools in the context of prediagnosis tests and in combination with information included in patients' medical history. Only recently have patients suffering from an abnormal condition of the UA (e.g., polyps, laryngeal diseases as laryngeal carcinomas, etc.) been extensively recorded and included in databases (such as widely used KayPENTAX-MEEI [7], among several others) designed for the development of automatic tools based on speech technologies. Anyhow, differences between clinical disorders frequently require the specific design of databases, though the effort to fulfill this task, as well as for their collection itself, is very demanding. Consequently, the number and availability of these dat-abases is limited, and most efforts have been focused on disorders that exhibit strong similarities regarding both the way in which they affect the production of speech and the parameters to be used to describe them.
Furthermore, as most frequent speech disorders are rela-ted to abnormalities found at the glottal source excitation, existing automatic speech processing tools often overlook the effects of an abnormal configuration of the vocal tract, while struggling to model the deviations found in the excitation source. This lack of perspective has caused that certain disorders predisposed by an altered structure of the vocal tract have received little attention from the signal processing community and that their early detection by means of automatic speech processing techniques is still being worked out.
Obstructive Sleep Apnea
Obstructive sleep apnea (OSA) patients provide an excellent example of a population group suffering from a medical condition that can exhibit particular voice characteristics which could be detected—at least in severe stages—through the modeling and posterior identification of specific patterns within patients' speech records by comparing these to samples collected from healthy subjects.
OSA is a highly prevalent disease affecting an estimated 2-4 % of male population between the ages of 30 and 60 years
[8]. It is characterized by recurring episodes of sleep-related collapse of the UA at the level of the pharynx and is usually associated with loud snoring and increased daytime sleepi-ness. It is a serious threat to an individual's health if not treated, as it is known to be a risk factor for hypertension and, possibly, cardiovascular diseases [9] and even cancer [10]. Quite recently, it has also been related to traffic accidents caused by somnolent drivers [8,9,11] and might lead to a poor quality of life and impaired work performance.
OSA can be diagnosed on the basis of a characteristic patient's history and physical examination, though a full overnight sleep study is still required to confirm diagnosis. This involves the recording of neuroelectrophysical and cardiorespiratory variables (ECGs), as well as a complex and intensive post-processing of collected data [12]. Though excellent performance rates are obtained by this method (ca. 90 % [12]), developing these tests is quite expensive and time-consuming, causing most patients to suffer waiting lists of several years [8]. These undesirable delays brought cli-nicians' interest to the development of early diagnosis tools providing additional information [13,14] to be considered in combination with results from standard diagnosis protocols [13]. The later can be used to estimate patient's priority of need and proper place in the polysomnography test waiting list, speeding up the diagnosis of severe cases.
Nonlinear Speech Analysis to Assist OSA Diagnosis
Over the last decade, extensive efforts have been devoted to the characterization of OSA patients' acoustic space to trace the presence of specific patterns which could be connected to the apnea syndrome [13-18]. Nonetheless, no previous work has focused on introducing nonlinear tech-niques to improve characterization of severe OSA cases and enhance the accuracy of automatic detection tools.
In this contribution we intend to extend our previous work by considering deterministic and stochastic dynamics of sustained speech for OSA detection, while aiming to enhance our baseline automatic OSA detection system over continuous speech records [17]. Features to account for these complex phenomena were introduced into acoustic space modeling, while a novel classification scheme was designed to successfully fuse the information in both sustained and continuous speech records to reach a final decision on whether or not a particular speaker suffers from OSA.
"Database Design and Collection." Further on, in section "Automatic Detection of Apnea Based on Speech Pro-cessing," we briefly review our previous contributions and describe our baseline systems based on the cepstral repre-sentation of continuous (see section "Continuous Speech Classifier") and sustained (see section "Sustained Speech Classifier") speech. Considerations on sustained speech nonlinear dynamics and the set of related features included in our classification system are outlined in section "Measures on Sustained Speech Dynamics," while the discussion on the alternatives for these to be combined with the baseline systems is included in section "Proposed Classification Scheme." In section "Results" we present the results from our experiments, which are thoroughly dis-cussed in section "Discussion," focusing on assessing our improvements in OSA detection. Finally, in section "Conclusions and Future Work," some conclusions are pointed out, along with several open issues that need to be addressed in the near future regarding the prospects for complex speech dynamics analysis over continuous speech.
OSA Effects on Patients' Voices
The pathogenesis of OSA has been under study for over 25 years, during which a number of factors that contribute to UA collapse during sleep have been identified. Essen-tially, pharyngeal collapse occurs when the normal reduction in pharyngeal dilator muscle tone at the onset of sleep is superimposed on a narrowed and/or highly com-pliant pharynx. This situation is predisposed by increased laxity of the pharyngeal soft tissues, lack of muscular tone and advancing in age and appears more frequently in male population. OSA can be diagnosed on a loud snoring story lasting for several years and most frequently appears in patients with a high body mass index (ratio between weight and squared height) as a result of comorbidities: accumu-lation of localized fat deposits and the lack of muscular tone. Interested readers can find further information on the anatomic and physiological factors predisposing to UA collapse in adults with OSA in [19].
Most noticeable is the fact that the particular configura-tion of the UA that might lead to the OSA condiconfigura-tion could also be related to particular speech production patterns in OSA speakers' voices. According to the work by Davidson [20], the evolutionary change in hominid craniofacial anat-omy has been prompted by the selection of a smaller more vertically oriented upper airway in Homo Sapiens in order to facilitate spoken language. To quote the author: "for pur-poses of speech, smaller is better and this is exactly what evolved in humans." Unfortunately, this smaller configura-tion of the UA has the negative consequence of the most likely appearance of an obstruction at the level of the
pharynx causing a prolonged cessation in the breathing air-flow during sleep. Consequently, there seems to exist a plausible connection between speech production and OSA syndrome, which entitles us to trace its presence in records of patients' voices through the identification, modeling and detection of characteristic patterns.
Distinctive Patterns Described in the Previous Literature
Few evidences on the effects of OSA on patients' voices have actually been reported. Most valuable information can be found in a 1989 work from Fox et al. [21] in which results from evaluations of skilled judges on a perceptual study were presented. These evaluations have pointed out several dif-ferences which can be found by comparing voices from apnea patients and those from control (healthy) subjects, including: 1. Articulation anomalies: Fox et al. stated that
neuro-motor dysfunction could be found in the sleep apnea population due to a "lack of regulated innervations to the breathing musculature or upper airway muscle hypotonus." This dysfunction is normally related to speech disorders, especially dysarthria. There are several types of dysarthria, and consequently, different acoustic features have to be used in the parameteriza-tion of speech. Anyhow, all of them affect the articulation of consonants and vowels causing the slurring of speech.
2. Phonation anomalies: Irregular phonation patterns may be related to heavy snoring observed in sleep apnea patients, which can cause inflammation in the upper respiratory system and affect the vocal cords. 3. Resonance anomalies: What seems to be clear is that
voices from the apnea group exhibit abnormal reso-nances that might appear due to the altered structure previously discussed, or a malfunction of the upper airway causing velopharyngeal dysfunction. This anomaly should, in theory, result in abnormal vocal quality related to the acoustic coupling between the oral and nasal cavities and be revealed in two features: • Speakers with a defective velopharyngeal
resonance disorder affecting speech sound quality has been associated with vocal tract damping features distinct from airflow imbalance between the oral and nasal cavities [22]. The term applied to this speech disorder is "cul-de-sac" resonance, a type of hyponasality perceptually perceived as if the sound was resonating in a blind chamber.
• On the other hand, because of the pharyngeal anomaly, differences in formant values can be expected, since for instance, according to [21] the position of the third formant might be related to the degree of velopharyngeal opening (lowering of the velum produces higher third formant frequen-cies). Similarly, in Robb's work [23] vocal tract acoustic resonance was evaluated in a group of OSA males, and significant differences were found in formants' frequencies and bandwidths between apnea and control groups. In particular, results of the formant frequency analysis indicated lower Fl and F2 values among the OSA group compared to the non-OSA.
In summary, as Fox et al. [21] concluded, it can be stated that deviations of these descriptors (articulation, phonation and resonance) may occur either as an isolated disturbance or in combination. Still, judges in [21] described "phonation" (a function attributed to the larynx) as the most predictive of the three descriptors they used to differentiate between normal and OSA individuals. How-ever, that single descriptor was not sufficient to guarantee an accurate assessment since all the three were necessary to achieve a reliable prediction on whether the subject belonged to the control or apnea group.
Moreover, Robb's contribution to the analysis of vocal tract resonances in apnea patients uttering sustained vowel sounds [23] also pointed out the fact that these phenomena shall be connected to muscular hypotonus and increased velar and pharyngeal compliance, which most probably translates to widened formants bandwidth. Fiz et al. [24] focused on the spectral analysis of speech prior to Robb's work and introduced a new set of measures for OSA voices' analysis which are closely related to the characterization of a nonlinear system, including the number of harmonics, along with their mean and maximum frequencies.
More recently, in [16-18] it was shown that automatic speaker recognition techniques based on short-time analy-sis and cepstral representation can be used to detect OSA, on both continuous and sustained speech. Though the resulting alternatives obtained promising results, accuracy rates from these were significantly different as the one based on continuous speech clearly outperformed the other [17]. Discussions on these results have motivated the present contribution, encouraging us to enhance our OSA
detection system. This has been achieved through the fusion of information extracted from continuous and sus-tained speech utterances collected from OSA patients. However, it is clear that such work requires from a specific database that had to be designed and collected on purpose. The design of the database used in our experiments was inspired on the previous literature review on OSA effects on patients' voices. The criteria and particular conditions of its recording have been broken down and briefly sum-marized in section "Database Design and Collection."
Database Design and Collection
By the time this research began and still nowadays, no database including speech records of patients suffering from OSA was publicly available. Consequently, a data-base had to be collected which included records from both OSA patients and healthy subjects to be used in the iden-tification of distinctive patterns, as well as in the training and testing of an automatic detection tool.
The selection of the speakers to be included, the recording procedure and the collection of clinical infor-mation were all carried out at Hospital Clínico de Málaga, Spain. The selection of severe OSA and control (i.e., healthy) speakers was carried out attending to the so-called Apnea-Hypoapnea Index (AHI), which is calculated as the number of apnea and hypoapnea events per hour of sleep and is regarded within the medical community as a reliable score to diagnose patients suffering from OSA syndrome and to rank them attending to the severity of their illness. Conventionally, an AHI value below 10 is associated with a healthy subject, while values over 30 indicate the patient should go into medical treatment. These same thresholds were adopted during the selection of speakers to be included in our database [25] for their inclusion under the control (AHI < 10) or OSA (AHI > 30) groups. Inter-mediate values between 10 and 30 are usually observed in people with high body mass index (BMI, height-to-square weight ratio) and most often do not require from the pneumatic splint provided by CPAP—continuous positive airway pressure—treatment to prevent UA obstruction. Improving their lifestyle with exercise and a healthy diet to reduce their BMI is usually enough to improve muscle tonus and enhance rest quality.
Table 1 Physiological characteristics of the subjects included in the
Apnea Database [20]
Measures Control group Apnea group Mean ± SD. Mean ± SD
Number of speakers 40 40
Age 40.2 ± 8.8 49.5 ± 10.8
BMI (kg/m2) 26.2 ± 3.9 32.8 ± 5.4
be doubtlessly related to the OSA condition. Moreover, speakers' condition and medical story were checked to guarantee that they did not exhibit any additional phona-tory problem. For all OSA speakers a long snoring hisphona-tory was described, while no consideration was made regarding this particular for healthy subjects included in the control group.
At this point, it is important to stress that our aim is not to advocate for an OSA diagnosis procedure based only on speech analysis. Our goal is to explore the possibilities of using results from speech analysis that when combined with other available data already used in OSA diagnosis (see, e.g., [26]) can represent a progress toward more effective screening methods before going into polysom-nography study.
Regarding the utterances to be recorded, it was decided to collect several repetitions of sustained vowel/a/along with a number of predefined sentences. While a sustained sound is being uttered, no significant modifications in articulators' position are to be expected, and alterations in glottal source waveform are easier to track. Whereas in continuous speech utterances different sounds are articulated, the combined effects of the source waveform production and vocal tract conformation affect speech signal generation. Conse-quently, sustained vowel/a/records were collected to look for those spurious, nonstationary effects arising while a sus-tained sound is uttered, to which we referred in the introduction. Differences found in samples from subjects in control or OSA groups would most probably be easier to identify than those to be observed in continuous speech and would most probably be related either to the excitation source or to the vocal tract properties, providing a simpler interpretation.
Four sentences were designed keeping in mind the results from the perceptual study by Fox and colleagues [21]. The phrases include instances of the following spe-cific phonetic contexts which are connected to the identified characteristic patterns of OSA patients as previ-ously reported:
• In relation to resonance anomalies, sentences were designed to allow measuring differential voice features for each speaker (e.g., to compare the degree of vowel nasalization).
• Regarding phonation anomalies, we included consecu-tive voiced sounds to measure irregular phonation patterns related to muscular fatigue in apnea patients. • To look at articulatory anomalies, we collected voiced
sounds affected by preceding phonemes that have their primary locus of articulation near the back of the oral cavity (e.g., velar allophones such as the Spanish velar approximant [ii|]).
The selected groups of 40 healthy male speakers and 40 male patients suffering from OSA in a severe degree were asked to read out the four sentences three times each, with a specific rhythmic structure and under the supervision of an expert. As previously mentioned, sustained vowel/a/instan-ces were also recorded and included in our database. Expert's supervision guaranteed that sustained speech records included a stable segment of at least 2 s in which standard algorithms for nonlinear analysis of sustained speech dynamics could be used. Those speech files which did not meet this requirement were automatically discarded. All recordings were collected in an isolated booth using a high-quality microphone from USB Plantronics DSP500 head-phone. Signals were recorded at 16 kHz rate, and samples were encoded in 16 bits with a recording system specially tuned for every speaker to maximize the CAD range while uttering sustained/a/sound (SNR > 30 dB). Further infor-mation on the design of the database can be found in [25].
Automatic Detection of Apnea Based on Speech Processing
Formally, the detection of characteristic patterns in speech records that can be related to OSA speakers' voices can be expressed as a standard classification problem in which a set of descriptive features are to be selected to discriminate between two classes: OSA and control. So far, for the detection of severe OSA cases, which is the focus in this contribution, the dataset was divided into a unique partition with two classes: one for control (i.e., healthy) and the other for OSA speakers.
explain the remarkable results addressed in the previous contributions. On the top of these, Gaussian mixture models (GMMs) have proved an enormous potential to model the variability found in human speech and are intensively used for both speech [27] and speaker [28] recognition, as well as in the detection of pathological voices [29].
Methodological considerations on speech-oriented GMM-based classifiers have been largely discussed in the context of speech and speaker recognition. Several strategies can be followed to derive a reliable model depending on the char-acteristics of the problem and the amount of data available. In our experiments, we chose to train a suitable universal background model (UBM) from a broader database [30], which is further adapted onto the samples from each of the two classes (namely, control and apnea) by means of the maximum aposteriori (MAP) adaptation scheme. This approach is repeatedly used in speaker adaptation, and most frequently only the components' mean vectors are adapted. The major issue in following this training strategy is the size of the dataset, which should be large enough to guarantee the reli-able convergence of the class-dependent (i.e., OSA and control) GMM parameters resulting from the expectation maximization algorithm implementing MAP adaptation. Other adaptation techniques were also tested, though the size of our database seemed to be enough to rely on the MAP algorithm convergence. Therefore, in this contribution we will only consider MAP adaptation of mean vectors. Figure 1 summarizes the whole training and posterior adaptation pro-cedures from which we obtained two mixture models, corresponding to control and apnea groups.
The current state-of-the-art classification system in automatic detection of OSA based on speech processing techniques focuses on the classification of scores that result from comparing two models which describe the acoustic spaces for OSA patients and healthy subjects. This proce-dure has been used in the past [17] on continuous and sustained speech, resulting in two separated classification schemes. The two of them were developed according to the previously described procedure using the BECARS open source tool [30]. Though formally very similar, intrinsic
Fig. 1 Apnea and control GMM training scheme based on MAP adaptation from a UBM model trained on the Albayzin database (extracted from [24])
differences were found during the development of both classifiers [17]. These peculiarities are mainly related to the different nature of sustained and continuous speech signals, and to the limited amount of available data resources for training the models, as we will discuss in sections "Con-tinuous Speech Classifier" and "Sustained Speech Classifier." Feature vectors used in all our experiments included 12 MFCC, normalized energy, velocity and acceleration coefficients, calculated using the HTK tool [31]. No normalization procedure was applied to the fea-ture vectors, while a diagonal covariance matrix was assumed for the UBM trained with BECARS, as it is typ-ically done in speaker verification.
Continuous Speech Classifier
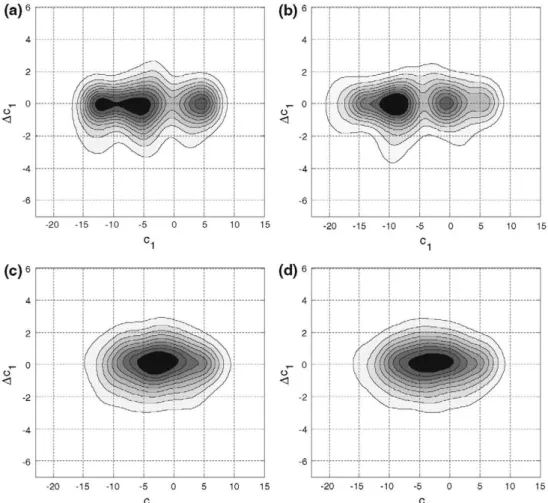
Regarding the amount of data needed to estimate a suitable GMM, we chose to train a UBM from phonetically balanced utterances included in the Albayzin Spanish database [32] and use MAP adaptation to derive the specific GMMs for the two classes as described above. Figure 2 (subplots c and d) depicts the 2-D Gaussian mixture contours for the first cepstral coefficient and its derivative from the estimated GMMs of both control (subplot c) and OSA (subplot d) groups.
This classifier was tested using a leave-one-out cross-validation scheme over all control and apnea speakers in our database: all samples from one speaker at a time were left out for validation (regardless of his group—OSA or control), while the remaining observations were used to train the classifier. This procedure was repeated for each speaker included in the database; therefore, it could be considered as a leave-one_speaker-out protocol. Thus, for each leave-one-out test, all 12 recordings (3 repetitions corresponding to each one of the four sentences, see section "OSA Effects on Patients' Voices") of an OSA or control speaker were left out to train two GMMs for the remaining OSA and control speakers (each one including 256 components). Afterward, each one of the 12 left-outrecordings was used to classify the left-out speaker as OSA or control. Therefore, the resulting cross-validation testing protocol involved a total of 960 tests. Classification results provided an overall 81.2 % accu-racy rate in the detection of severe apnea cases (see Table 5, configuration 1). Further information on this classification scheme can be found in [17].
Sustained Speech Classifier
Fig. 2 Contours from the estimated GMMs on sustained (upper: a, b) and continuous (lower: c, d) speech, both for the control group (right: a, c) and the OSA group (left: b, d). These are represented on the first cepstral dimension (cj) and its derivative (Acj)
developed and assessed on the records of sustained vowel/ a/included in our database. However, despite our desire to entirely reproduce those results, we lacked of a database that could match our needs in the same way as Albayzin did for continuous speech. This fact raised a number of questions regarding the best way to train and adapt our models and motivated a deep discussion on the balance between models' complexity, the dependency of the final models on the initial one, the convergence of the algo-rithms from the initial UBM and the accuracy in the classification results obtained. Interested readers would refer to a recently published work [17] for further infor-mation on the design of this classifier and a discussion on the most adequate approach for it to be trained.
In the end, two GMMs including 16 Gaussian components each were adapted from a UBM trained on several records of sustained vowel/a/from Childers database [33]. Only these records were taken into the training of the background model as they account for a better matching between the apnea database records and the pretrained model (see [17]). Once again feature vectors included 12 MFCC, along with energy, velocity and acceleration parameters, just as for the contin-uous speech classifier. Unlike the previous one, this classifier achieved a 39.6 % misclassification rate (see Table 5,
configuration 2), which is far from the less than 21.0 % rate achieved by the continuous speech classifier. Figure 2 (subplots a and b) shows the estimated 2D Gaussian mixture contours for the first cepstral coefficient and its time deriv-ative in the control (subplot a) and OSA (subplot b) GMMs, respectively.
Measures on Sustained Speech Dynamics
Though most of the work on speech analysis techniques has been based on the assumption that speech signals are the response from a linear, locally time-invariant system, excited with a bounded input, modeling of speech signals has been thoroughly enhanced by the work developed during the last three decades on effects which cannot be correctly contex-tualized without these assumptions. Recently, several features have been specifically derived from the fact that speech pro-duction is actually a dynamic, nonlinear process, and throughout the literature, many of these have been suggested, which could aim us at providing new insights into the effects of OSA on patients' voices. Most of these nonlinear measures of speech dynamics can be broadly classified (see Table 2) into three groups attending to the particular properties of speech signals on which they rely. These are the following:
1. identifiable deviations of the vocal tract from an ideal
resonator, including both time and peak-to-peak
amplitude variations,
2. recurrent structure and self-similarity observed in speech signals, as a mathematical concretization of well-known and frequently assumed pseudo-periodic-ity hypothesis,
3. presence of noisy components within speech signals, typically found at high frequencies, which can be quantified by means of signal-to-noise power ratios.
The first group includes features quantifying cycle-to-cycle variations in the fundamental frequency and waveform amplitude, namely jitter and shimmer. Both magnitudes can be measured according to different criteria resulting in a set of jitter and shimmer measures providing different results at every pitch cycle. In this contribution we have chosen to include a subset of these (see Table 3) that have been suc-cessfully used in speaker verification [34]. W e will test their ability to discriminate between our two classes and to ana-lyze whether an abnormal condition of the vocal folds could be induced by OSA (e.g., inflammation caused by frequent snoring).
In this same group, a recently proposed measure on pitch period estimation uncertainty was included. Pitch
period entropy (PPE) [4] quantifies the inefficiency in
speaker's voice frequency control in terms of the unpre-dictability of the fundamental frequency evolution while uttering a sustained sound.
Regarding the second group, a whole set of measures have been included, which are based on ideas taken from dynamic systems theory. All of them are somehow related to the recurrence and self-similarity properties postulated for sustained vowel sounds. In this contribution we have chosen to include two of the most common and well-known features [4], briefly described in Table 4. RPDE and
DFA are based on the analysis of speech records in time domain representation, as almost all features described in the literature dealing with the quantification of complexity in sampled signals are. Therefore, time resolution has to be a major concern as it has been addressed in the previous contributions and experimental research on these measures [3, 4]. These previous studies point out that algorithms implementing dynamic measures on speech signals behave differently depending on the recording sampling rate, the amplitude resolution and the signal-to-noise ratio. Their conclusions suggest that a sampling rate of about 44.1 kHz should be sued (high-quality audio, far above conventional 8-16 kHz rates used in conventional speech processing). Unfortunately, our available databases had been recorded at lower rates: apnea, 16 kHz [25]; Albayzin, 16 kHz [32]; and Childers, 10 kHz [33]. Speech records were interpo-lated to achieve the best possible estimation of the RPDE and DFA values. Nonetheless, we acknowledge the fact that a lower sampling rate will most probably affect the actual discriminative capabilities of the selected measures. Besides, all of the recordings in our OSA database were recorded at 16 bits per sample, under controlled acoustic conditions to minimize the spurious effects of external sources of noise. The SNR quotient varied from one speaker to another, but during the database collection, the microphone position and recording level were adjusted for each speaker to guarantee SNR > 3 0 dB.
Finally, the third group includes measures that aim at estimating the fraction of noise present in speech signals, which is inherent to them. This is usually described by means of an estimated signal-to-noise power ratio (SNR), or its converse the noise-to-signal power ratio (NSR), attending to a consistent definition of the average energy (e.g., squared energy operator, SEO, or Teager-Kaiser energy operator, TKEO). In this contribution we have selected two algorithms [4] for noise level estimation, which decompose speech signals attending to:
• an hypothetically invariant excitation: the vocal fold
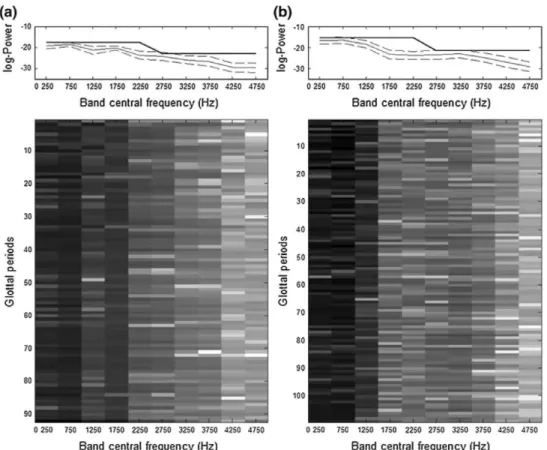
excitation ratio, VFER (Fig. 3 shows the multiband distribution of power, which is used for the VFER calculations, on two different samples from control— subplot a—and OSA—subplot b—sustained speech records).
• the existence of a set of AM-FM contributors (usually referred as intrinsic mode functions): the empirical
mode decomposition excitation ratios, EMD-ER.
Table 2 Measures for control
and apnea on the dynamics of sustained speech included in this contribution
Mutual information (MI) was estimated for the mRMR measures selection. The 6th (MI = 0.09) position attending to relevance (not shown in the Table) was assigned to the MFCC-GMM scores Measures Group 1 Group 2 Group 3 Jitter Absolute jitter Relative jitter RAP jitter PPQ5 jitter Shimmer Shimmer Relative shimmer APQ3 shimmer APQ5 shimmer APQ11 shimmer
Pitch period entropy (PPE)
Recurrence period density entropy (RPDE)
Detrended fluctuation analysis (DFA)
Vocal fold excitation ratio (VEER)
SEO TKEO Energy SNR 1 SNR 2 SNR 3 NSR 1 NSR 2 NSR 3 10~4 10~2 10~2 10~2 10~2 10~2 io-7 10~8 Control Mean ± SD
2.30 ± 1.38
2.63 ± 1.59
1.61 ± 1.03
1.63 ± 1.20
0.47 ± 0.27
5.21 ± 2.89
2.94 ± 1.78
3.20 ± 1.85
3.96 ± 2.10
5.03 ± 13.45
0.43 ± 0 . 1 1
0.61 ± 0.04
0.78 ± 0.94
3.42 ± 3.52
5.55 ± 6.70
25.5 ± 23.7
23.7 ± 21.9
281 ± 406
1.22 ± 0.07
2.63 ± 0.10
1.26 ± 0.05
Empirical mode decomposition excitation ratios (EMD-ER)
SNR 1 SNR 2 SNR 3 NSR 1 NSR 2 NSR 3
2.26 ± 2.56
0.24 ± 0.22
0.24 ± 0.22
0.11 ± 0.03
6.39 ± 3.67 0.13 ± 0.02
Apnea Mean ± SD
2.48 ± 1.56
2.78 ± 1.89
1.68 ± 1.14
1.67 ± 1.35
0.51 ± 0.23
5.67 ± 2.62
3.16 ± 1.60
3.50 ± 1.58
4.37 ± 1.84
7.06 ± 17.45
0.45 ± 0 . 1 0
0.60 ± 0.04
0.50 ± 0.45
3.49 ± 3.83
4.03 ± 3.93
18.8 ± 27.7
16.6 ± 21.7
250 ± 390
1.20 ± 0.07
2.60 ± 0.10
1.27 ± 0.05
1.80 ± 1.90
0.19 ± 0.14
2.78 ± 1.69
0.11 ± 0.02
6.07 ± 3.05
0.12 ± 0.02 MI (Position), * Selected
<10~4 (21)
< 10~4 (22)
<10~4 (23)
< 10~4 (24)
0.09 (08)*
<10~4 (25)
<10~4 (26)
<10~4 (27)
< 10~4 (28)
0.004 (11)
0.0005 (13)
<10~4 (20)
0.09 (7)*
<10~4 (14)
<10~4 (15)
0.30 (04)*
0.34 (03)*
0.77 (01)*
<10~4 (16)
0.002 (12)
<10~4 (17)
0.04 (10)
0.34 (02)*
0.09 (05)*
<10~4 (18)
0.09 (09)* <10~4 (19)
experience and intensive testing. Following some pre-liminary experimental analysis, we found that results from this test are close to those described by A. Tsanas on Parkinson's disease [4], and therefore, the same parameters were chosen for our study. In Table 2 several of these definitions on VFER and EMD-ER are included to show that these are actually different and provide different results. Both SNR—signal-to-noise ratio—and its converse NSR—noise-to-signal ratio—were calculated on three different configurations (SNR1-3, NSR1-3) in which con-tributors correspond to signal or noise subsets were gradually changed to assess the discriminative capabilities of VFER and EMD-ER. Additionally, for VFER, as is also
Table 3 Jitter and shimmer measures (group 1) considered in this work on sustained vowels recordings analysis (T¡ stands for the estimated
glottal closure instants—estimated with the Matlab's VOICEBOX toolbox [35], A¡ for the extracted peak-to-peak amplitude on each cycle)
Jitter measurements Shimmer measurements
Absolute jitter _J_ Yf^S,1 \T¡ - T¡-iI
Relative jitter
RAP jitter
PPQ5 jitter
tiETilJi-Ji-il / ( ¿ E L I *
Shimmer
Relative shimmer
1 v^AT-l T£ f=? 2 0 1 o g | Am- A , |
APQ3 shimmer 3-Point period perturbation quotient, based on the 2 closest neighbors averaging.
A¿iEf_i' |r¡-(r¡-i+7¡+r¡+i)/3|
»2-ii-i •
3-Point period perturbation quotient based 2 closest neighbors averaging.
5-Point period perturbation quotient requires APQ5 shimmer 5-Point period perturbation quotient requires averaging averaging in the period and the four closest in the period and the four closest neighbors,
neighbors. APQ11 shimmer 11-Point period perturbation quotient requires averaging in the period and the four closest neighbors.
Table 4 Description of RPDE and DFA complexity measures—x(n) stands for the sampled speech signal, (a, b) are obtained from first-order
approximation to the windowed series, Nm¡s:í is the maximum recurrence time in the attractor, R(i) the normalized recurrence time histogram
Measure Definition Equation
RPDE
Recurrence period density entropy
DFA
Detrended fluctuation analysis
Extends the conventional concept of periodicity and substitutes it by the idea of recurrence. Quantifies uncertainty in pitch period estimation
Calculates the scaling exponent in nonstationary time series. A least-square straight-line approximation is calculated on each frame
at every time step
RPDE = -ES"g('>gw
DFA
= V¿ELw")-(
an+
¿)]
2^") = ELi
xw
Proposed Classification Scheme
In order to have the best possible OSA/control classifica-tion scheme, the results from state-of-the-art classifiers using spectral envelope information (MFCC-GMMs) (described in section "Automatic Detection of Apnea Based on Speech Processing"), working on both continuous and sustained speech, must be combined with the features characterizing sustained speech dynamics (in section "Measures on Sustained Speech Dynamics"). To this end, a feature vector was built by concatenating the nonlinear measures with the scores obtained from the continuous and sustained speech GMM classifiers. These MFCC-GMM scores were calculated as an average over the frame-by-frame log-likelihood ratios resulting from the evaluation of MFCC coefficients on control and apnea mixture models. Figure 4 displays the block diagram summarizing the overall scheme of the proposed system. Its parallelized structure has a bearing on the idea of incrementally enhancing the accuracy rate, which perfectly matches our
initial goal to improve our baseline system and to effi-ciently combine all information to model speakers' (healthy subjects and OSA patients) acoustic space. Two main branches can be identified in Fig. 4. The lower one focuses on continuous speech using MFCC-GMM (results in configuration 1 in Table 5). The upper one allowed us to get a closer insight into the discrimination capabilities when using sustained speech, so both a MFCC-GMM classifier (configuration 2 in Table 5) and a classifier fusing nonlinear measures with MFCC-GMM scores (configura-tion 3 in Table 5) were implemented. All branches were finally combined to make a final decision which takes into account all available information (configuration 4 in Table 5).
leave-0 25leave-0 7Sleave-0 125leave-0 175leave-0 225leave-0 275leave-0 325leave-0 375leave-0 425leave-0 475leave-0
Sand central frequency (Hz)
0 250 750 1250 17S0 2250 27S0 3250 3750 42S0 4750
Band central frequency (Hz)
Fig. 3 VFER estimation process for two different sustained speech
samples (a from a control speaker, b from a patient suffering from OSA). The energy distribution among the frequency bands varies significantly from one group to the other and is quite stable throughout a 1-s duration sample (lower images). The average log-energy is estimated for each frequency band and presented along with the standard deviation intervals in the upper subplots (dashed and
one_speaker-out cross-validation scheme (described in section "Automatic Detection of Apnea Based on Speech Processing"). MFCC-GMM scores from each repetition of each utterance on continuous (total of 4 samples out of 4 recordings per speaker) and sustained (1 sample out of the 4 repetitions) speech were combined at a time with the nonlinear features calculated on the sustained speech sample, attending to the identity of the recorded speaker, and arranged to form the feature vectors. This procedure was repeated for all repetitions and possible combinations of continuous and sustained speech records from every speaker included in the database. Moreover, the optimiza-tion for the regression trees was driven by the convenoptimiza-tional misclassification rate, while the initial points for the iter-ative algorithm were selected through a naive K-means partition.
In addition to the CART classifiers, and prior to them, feature selection tests based on minimum redundancy and maximum relevance (mRMR) were developed to identify those features with negligible interclass variability. These
0 250 7Í0 12£0 1750 2250 2750 3250 3750 J250 4750
Band central frequency (Hz)
0 250 760 1250 17S0 2250 27S0 3250 37S0 J250 4750
Band central frequency (Hz)
continuous thin lines). The difference between aggregated energy
values from bands 1 to 5 (0-2.5 kHz) and 6 to 10 (2.5-5.0 kHz) provides the final excitation ratio used in classification (continuous
strong black line in the upper plots represents the accumulated
log-energy values associated with their corresponding frequency bands and prior to their subtraction)
were removed from the feature vector without a major decrease in the accuracy of the automatic classification system, while reducing the feature space dimensionality. The final result from the mRMR module is an ordered list of features, very similar to the one we would obtain from the posterior pruning of the lower branches in a classification regression tree (less probable leaves). The adopted solution reduced the number of features beforehand, simplifying and consequently accelerating the training of regression trees. At the end of this process, the reduced feature vectors were used to train and test the CARTs, which provided a final decision on the presence/absence of the OSA disorder.
Results
Fig. 4 Block diagram of the
proposed scheme for automatic detection of severe OSA. Upper branches—dark gray—focus on sustained speech analysis, while the lower one—white—focuses on continuous speech. Both branches are finally combined to reach a final decision based on both sources of information
("'ART Decision
from the two identifiable starting points (i.e., sustained or continuous speech records) to the final decision step, sev-eral alternative approaches can be compared to shed some light on the complex nature of the problem we faced.
Prior to the analysis on the results from the CARTs, we shall turn our attention to the reduced feature set which resulted from the mRMR feature selection procedure. All the nonlinear measures were ranked (see Table 2), along with the averaged MFCC-GMM scores obtained from sustained speech records. Attending to the precedence order assigned to each feature, those more relevant were chosen to be included in the final feature vector and used for classification (only features ranked from 1 to 9 were included). The list of the nine more relevant features (see Table 2) included seven measures related to VFER and EMD-ER, plus the absolute shimmer and MFCC-GMM score (i.e., average log-likelihood ratio from control and apnea GMMs using MFCC coefficients and their time derivatives). This feature selection process stresses the fact that the moderate capabilities for OSA detection (previ-ously presented in section "Automatic Detection of Apnea Based on Speech Processing") when using only MFCCs description of the acoustic space on sustained speech, which was ranked in the 6th position, could be improved if combined with the other nonlinear features selected in the list.
Therefore, once the selected feature vectors were built, accuracy rates were obtained for each one of the branches
(i.e., configurations) in Fig. 4 (see section "Proposed Classification Scheme") and are presented in Table 5.
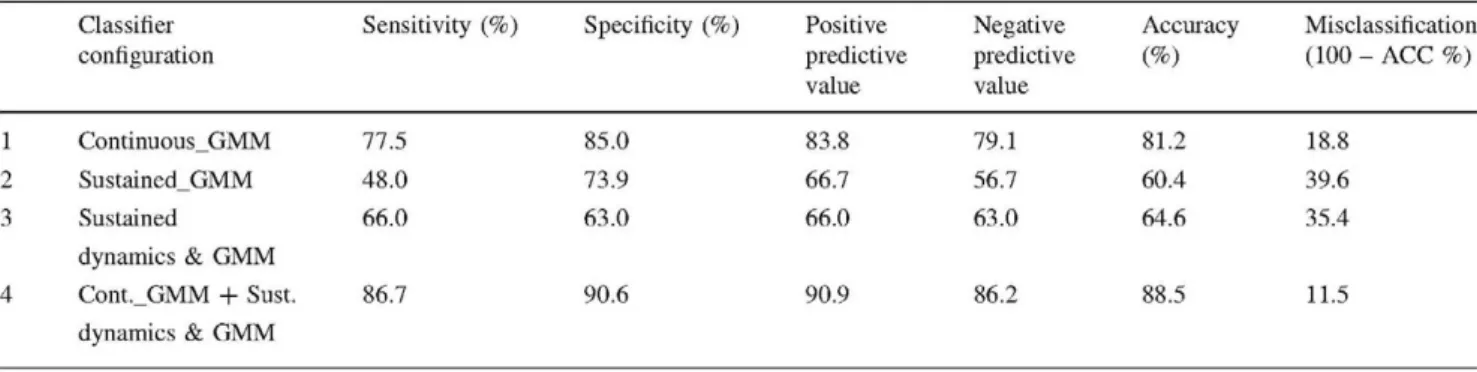
As it can be seen in the table, a 35.4 % error rate was achieved for OSA/control classification based only on the information extracted from sustained speech (fused GMM scores and features on sustained speech dynamics—upper branches in Fig. 4, configuration 3 in Table 5). This rep-resents a 10 % relative reduction from the previously reported 39.6 % misclassification rate (when using sus-tained speech MFCC-GMM scores only). To validate the statistical significance of this result, the p value was esti-mated from the exact significance binomial test reaching a 0.075, while the confidence value was set to 0.95.
Looking now for a global severe OSA classification scheme, all the branches in Fig. 4 were combined, including scores from both MFCC-GMM classifiers on sustained and continuous speech and the previously selected nonlinear fea-tures on sustained speech dynamics. This global classification scheme (configuration 4 in Table 5) reached a misclassification rate of 11.5 %, which represents over a 33 % relative reduction from the 18.8 % misclassification rate provided by our previ-ous best-performing MFCC-GMM system working on continuous speech (configuration 1 in Table 5). Significance test assessment for the achieved reduction in misclassification rate resulted in a <0.01 p value (for a confidence a — 0.95). Consequently, it must be stressed that the obtained
Table 5 Results from the classifiers described in sections "Auto-matic Detection of Apnea Based on Speech Processing" and
"Proposed Classification Scheme": configurations (1) and (2) were obtained from baseline systems on continuous and sustained speech,
respectively; (3) combines scores in (2) with measures resulting from sustained speech dynamics analysis; (4) is the final proposed classifier combining all the information available (see Fig. 4)
1
2
3
4
Classifier configuration
Continuous_GMM
Sustained_GMM
Sustained
dynamics & GMM
Cont._GMM + Sust.
dynamics & GMM
Sensitivity (%)
77.5
48.0
66.0
86.7
Specificity (%)
85.0
73.9
63.0
90.6
Positive predictive value
83.8
66.7
66.0
90.9
Negative predictive value
79.1
56.7
63.0
86.2
Accuracy (%)
81.2
60.4
64.6
88.5
Misclassification (100 - ACC %)
18.8
39.6
35.4
classification accuracy of 88.5 % is really close to ca. 90 % reported in the literature for ECG-based diagnosis tests [12], while the average test time is reduced from over 8 h required just for ECG data acquisition, to less than 5 min required to record spoken utterances and get the final output from the proposed classifier. Nevertheless, taking into account the necessary precautions due to the still limited population of our OSA database, further improvements should be expected when combining the output from our speech-based severe OSA detection system with other pieces of information clini-cians actually use (e.g., age, cervical perimeter, etc.) [26]. It is this combined system that we foresee as a powerful approach to enhance OAS patients' screening that can help in reordering and reducing waiting lists.
Discussion
The major result in this work is that automatic severe OSA detection based on sustained speech is enhanced when nonlinear features describing complex dynamics are included to extend MFCC-GMM classification scores.
On the one hand, our experiments on sustained speech have shown that features derived from nonlinear analysis can be combined with state-of-the-art MFCC-GMM scores to improve their discriminative power (increasing correct classification to 64.6 from 60.4 %, respectively). This supports our prior hypothesis that certain phenomena connected to nonlinear processes involved in speech pro-duction can actually be observed and traced in severe OSA patients' voices. However, limitations on the discrimina-tive capabilities of selected features might arise from the low sampling rate (i.e., 16 kHz for the apnea database). Therefore, the fact that the mRMR analysis ranked many of the studied nonlinear features low and that consequently, they were keep out of our final extended feature vector should be reworked in the future once this limitation is solved. Anyhow, results from the mRMR feature selection process have been very useful as the relatively low rank (6th position) assigned to MFCC-GMM scores suggests that MFCC-based spectral envelope characterization might not be the best representation for OSA patients' voices. In fact, discriminative properties of alternative representations such as those resulting from the decomposition of the recorded signals attending to their harmonic structure (i.e., VEER and EMD-ER) have been shown to be better.
On the other hand, results from the OSA classification scheme only based on continuous speech have shown that this scheme still outperforms the proposed classifier com-bining all available information on sustained speech (81.2 and 64.6 %, respectively). This result suggests that main characteristic patterns found in OSA patients' voices should be related to the way in which different sounds are naturally
co-articulated in continuous speech without the restrictions of sustained voices. More importantly, the fact that the proposed global severe OSA classification scheme has been able to successfully combine information extracted from both sustained and continuous speech (increasing classifi-cation accuracy from 81.2 to a 88.5 %) seems to support our initial hypothesis on the existence of a certain degree of complementarities in both types of speech information for characterizing severe OSA patients' voices. In order to have a more precise understanding on this complementary infor-mation, correlation tests on MFCC-GMM scores and nonlinear features were analyzed. These tests showed some correlation between MFCC-GMM scores from sustained and continuous speech, as well as for nonlinear features and MFCC-GMM for sustained speech, while apparently no correlation exists between nonlinear features and the MFCC-GMM scores from continuous speech.
Finally, if we further analyze the results summarized in Table 5, together with the 33 % relative reduction in classification error between configurations 1 and 4, it can be observed that the sensibility and specificity values, also included in the Table and representing, respectively, the proportion of actual positives (OSA) and negatives (con-trol) which were correctly identified as such, are noticeably biased toward one of the groups (specificity is always higher than sensitivity for all configurations). Nevertheless, it is also interesting to note that the two novel proposed configurations exhibited a small deviation of sensibility and specificity from the mean accuracy value (ACC ± 1 . 4 and ±1.8 % for configurations 3 and 4 in Table 5, respectively) when compared to the same results from our baseline systems (ACC ± 3.75 % and ± 12.4 % for con-figurations 1 and 2 in Table 5).
Conclusions and Future Work
Automatic tools based on speech technologies have proved to be a reliable, cost-effective approach for the early detection of OSA patients at severe stages of the syndrome. Clinicians have repeatedly shown their interest on this kind of technologies, which have been developed to identify, model and detect abnormal voice and speech patterns found in subjects suffering from this condition.
from the results achieved by modeling continuous speech, this work encourages us to explore other possible parame-terizations that could be suitable to describe the dynamics behind the co-articulation of sounds. The particular patho-genesis of OSA regrets following such approach for a future full-AHI-range OSA detection system, as abnormal patterns caused by vocal folds irregular vibration can only be expected in a severe stage of the syndrome. Therefore, fur-ther experiments have to be carried out to analyze all possible situations. However, as previously stated, such analysis is out of the scope of this contribution, as clinicians' major concern is about early diagnosis and severe cases detection.
Moreover, the combination of all three branches (i.e., continuous, sustained and sustained speech dynamics) to finally reach a decision on the speaker's health condition has obtained a significant improvement in the classification rate for the control/severe OSA problem. This reinforces our intuition that information coming from sustained and continuous speech was poorly correlated as different phe-nomena are taking place during their production and have proved useful for this particular problem.
We are enthusiastic about our results and about the generalization properties of the proposed classification scheme combining information from different sources. Nonetheless, we acknowledge that future improvements should be expected from a further analysis on the dynamics of speech as new features are introduced to enhance our description on the acoustic space. A reliable framework for short-time analysis on the alterations in nonlinear dynamics of continuous speech still has to be worked out, and this will be one day satisfactorily accomplished. Meanwhile, despite these efforts and the time required for this task to be fulfilled, the proposed scheme could still be used to com-bine those into a single automatic classification system, just as we have done for sustained vowels.
Acknowledgments The activities described in this paper were
funded by the Spanish Ministry of Science and Innovation as part of the TEC2009-14719-C02-02 (PriorSpeech) project. The correspond-ing author also acknowledges the support from Universidad Politécnica de Madrid full-time PhD scholarship program. Finally, authors would like to thank Athanasios Tsanas, Max Little and Pro-fessor J. I. Godino Llórente, for their comments and suggestions.
References
1. Faundez-Zanuy M, McLaughlin S, Esposito A, Hussain A, Scho-entgen J, Kubin G, Kleijn WB, Maragos P. Nonlinear speech processing: overview and applications. Control Intell Syst. 2002; 30:1-10.
2. Kubin G Nonlinear processing of speech. In: Kleijn WB, Paliwal KK, editors. Speech coding and synthesis. Amsterdam: Elsevier Science; 1995.
3. Little MA, Costello DAE, Harries ML. Objective dysphonia quantification in vocal fold paralysis: comparing nonlinear with classical measures. J Voice. 2009;25(1):21-31.
4. Tsanas A, Little MA, McSharry PE, Ramig LO. Nonlinear speech analysis algorithms mapped to a standard metric achieve clinically useful quantification of average Parkinson's disease symptom severity. J R Soc Interface. 2010;8:842-55.
5. Gómez-Vilda P, Rodellar-Biarge MV, Nieto-Lluis V, Muñoz-Mulas C, Mazaira-Fernández LM, Ramírez-Calvo C, Fernández-Fernández M, Toribio-Díaz E. Neurological disease detection and monitoring from voice production. Lecture notes in artificial intelligence. Volume 7015: nonlinear speech processing NOLISP 2011, Springer; 2011.
6. Arias-Londoño JD, Godino-Llorente JI, Sáenz-Lechón N, Osma-Ruiz V, Castellanos-Domínguez G Automatic detection of path-ological voices using complexity measures, noise parameters, and mel-cepstral coefficients. IEEE Trans Biomed Eng 2011;58 (2):370-9.
7. KayPENTAX. Massachusetts Eye and Ear Infirmary (MEEI) Voice and Speech Lab. Disordered Voice Database and Program, Model 4337. Viewed September 2011; 2011. http://www.kaypentax.com.
8. Puertas FJ, Pin G, María JM, Duran J. Documento de consenso Nacional sobre el síndrome de Apneas-hipopneas del sueño. Grupo Español De Sueño; 2005.
9. Coccagna G, Pollini A, Provini F. Cardiovascular disorders and obstructive sleep apnea syndrome. Clin Exp Hypertens. 2006; 28:217-24.
10. Nieto FJ, Peppard PE, Young T, Finn L, Hla KM, Farré R. Sleep disordered breathing and cancer mortality: results from the Wisconsin Sleep Cohort Study. Am J Respir Crit Care Med. 2012;186(2):190^1.
11. Lloberes P, Levy G, Deseáis C, et al. Self-reported sleepiness while driving as a risk factor for traffic accidents in patients with obstructive sleep apnoea syndrome and in non-apnoeic snorers. Respir Med. 2000;94(10):971-6.
12. Penzel T, McNames J, de Chazal P, Raymond B, Murray A, Moody G Systematic comparison of different algorithms for apnoea detection based on electrocardiogram recordings. Med Biol Eng Comput. 2002;40(4):402-7.
13. Calisti M, Bocchi L, Manfredi C, Romagnoli I, Gigliotti F, Donzelli G Automatic detection of snore episodes from full night sound recordings: home and clinical application. In: Proceedings of the 3rd advanced voice function assessment international workshop. 2009.
14. Alcázar JD, Fernández R, Blanco JL, Hernández L, López L, Linde F, Torre-Toledano D. Automatic speaker recognition techniques: a new tool for sleep apnoea diagnosis. Am J Respir Crit Care Med. 2009;179:A2131.
15. Fernández-Pozo R, Blanco-Murillo JL, Hernández-Gómez L, López-Gonzalo E, Alcázar-Ramírez J, Torre-Toledano D. Assessment of severe apnoea through voice analysis, automatic speech, and speaker recognition techniques. EURASIP J Adv Signal Process. 2009;2009(982531). doi:10.1155/2009/982531.
16. Blanco JL, Fernández R, Díaz-Pardo D, Sigüenza A, Hernández L, Alcázar J. Analyzing GMMs to characterize resonance anomalies in speaker suffering from apnoea. In: Proceedings of the 10th annual conference of the international speech communication association. 2009.
17. Blanco JL, Fernández R, Torre D, Caminero FJ, López E. Ana-lyzing training dependencies and posterior fusion in discriminative classification of apnea patients based on sustained and connected speech. In: Proceedings of the 12th annual conference of the international speech communication association. 2011.
19. Ryan CM, Bradley TD. Pathogenesis of obstructive sleep apnoea. J Appl Physiol. 2005;99(6):2440-50.
20. Davidson TM. The Great Leap Forward: the anatomic evolution of obstructive sleep apnoea. Sleep Med. 2003;4:185-94. 21. Fox AW, Monoson PK, Morgan CD. Speech dysfunction of
obstructive sleep apnea. A discriminant analysis of its descriptors. Chest. 1996;96(3):589-95.
22. Kummer A. Cleft palate and craniofacial anomalies: effects on speech and resonance. Clifton Park: Thomson Delmar Learning; 2001.
23. Robb MP, Yates J, Morgan EJ. Vocal tract resonance charac-teristics of adults with obstructive sleep apnea. Acta Otolaryngol.
1997;117(5):760-3.
24. Fiz JA, Morera J, Abad J, et al. Acoustic analysis of vowel emission in obstructive sleep apnea. Chest. 1993;104(4):1093-6. 25. Fernandez R, Hernández LA, López E, Alcázar J, Portillo G, Toledano DT. Design of a multimodal database for research on automatic detection of severe apnoea cases. In: Proceedings of 6th language resources and evaluation conference. LREC, Mar-rakech; 2008.
26. Linde de Luna F, Alcazar J, Vergara C, Blanco JL, Fernandez R, Hernandez LA, Lopez E. Combining voice classification scores with clinical data for improving sleep apnea syndrome diagnosis. Am J Respir Crit Care Med. 2012;185:A6427.
27. Huang X, Acero A, Hon WH. Spoken language processing. Englewood Cliffs: Prentice-Hall; 2001.
28. Reynolds DA, Quatieri TF, Dunn RB. Speaker verification using adapted gaussian mixture models. Digit Signal Process. 2000; 10: 19-41.
29. Godino-Llorente JI, Gomez-Vilda P, Blanco-Velasco M. Dimen-sionality reduction of a pathological voice quality assessment system based on gaussian mixture models and short-term cepstral parameters. IEEE Trans Biomed Eng. 2006;53(10): 1943-53. 30. Blouet R, Mokbel C, Mokbel H, Sanchez-Soto E, Chollet G,
Greige, H. BECARS: a Free Software for Speaker Verification. In: Proceedings of the speaker and language recognition work-shop, ODYSSEY; 2004. p. 145-148.
31. Young SJ, Evermann G, Gales MJF, Hain T, Kershaw D, Moore G, Odell J, Ollason D, Povey D, Valtchev V, Woodland PC. The HTK Book, version 3.4. Cambridge, UK: Cambridge University Press; 2006.
32. Moreno A, Poch D, Bonafonte A, Lleida E, Llisterri J, Marino JB, Nadeu C. ALBAYZIN speech database: design of the phonetic corpus. In: Proceedings of Eurospeech 93, vol. 1. Berlin, Ger-many, 1993. p. 175-178.
33. Childers D G Speech processing and synthesis toolboxes. New York: Wiley; 2000.
34. Farrus M, Hernando J. Using jitter and shimmer in speaker ver-ification. IET Signal Process J. Special issue on biometric recognition; 2008. doi:10.1049/iet-spr.2008.0147.
35. Brookes M. VOICEBOX: Speech processing toolbox for Matlab. Department of Electrical & Electronic Engineering. Imperial College, London; 2002. http://www.ee.ic.ac.uk/hp/staff/dmb/voice

![Fig. 1 Apnea and control GMM training scheme based on MAP adaptation from a UBM model trained on the Albayzin database (extracted from [24])](https://thumb-us.123doks.com/thumbv2/123dok_es/6842825.837065/6.892.82.431.865.1011/apnea-control-training-adaptation-trained-albayzin-database-extracted.webp)