THERMAL AND MECHANICAL PROPERTIES OF SELF-HEALING
EPOXY/GRAPHENE NANOCOMPOSITES
I. AGUIRRE DE CÁRCER *, M.G. PROLONGO*, C. SALOM*, J. PARRADO*, R. MORICHE AND S.G. PROLONGO†
*
Dpt. Materiales y Producción Aeroespacial, Universidad Politécnica de Madrid, Spain. e-mail: [email protected], [email protected]
†
Dpt. Ciencia e Ingeniería de Materiales, Universidad Rey Juan Carlos, Madrid, Spain e-mail: [email protected]
Key words:self-healing epoxy, graphene, thermal-mechanical-electrical properties.
Abstract. The goal of the present work is to analyze the influence of the type of graphene and graphene content on the thermo-mechanical properties of an epoxy nanocomposite formed by an epoxy resin base on diglycidyl ether of bisphenol A (DGEBA) and 4-aminophenyl disulphide (AFD) as curing agent. This is a “dynamic” epoxy matrix (vitrimer), which has reversible crosslinks based on aromatic disulphide bonds. The idea is to take the advantage of the high thermal conductivity of graphene nanocomposites to promote the self-healing. The study of the epoxy-graphene systems was carried out using two types of graphene: un-functionalized and a functionalized graphene. The functionalized graphene contains amine groups that are reactive with the epoxy prepolymer, forming nanocomposites in which the graphene nanoplatelets remain chemically anchored to the matrix. Dispersions of GNPs in the DGEBA were studied by Differential Scanning Calorimetry (DSC) in order to investigate the curing reaction. Dynamic Mechanical Thermal Analysis (DMTA) and tensile stress-strain measurements were performed to compare the glass transition temperature, the storage modulus in the glassy and rubber states, the Young modulus, deformation at break, mechanical strength and toughness. Electrical conductivity and combined tensile stress-electrical resistance experiments are reported for these nanocomposites.
1 INTRODUCTION
2
applicability for the manufacture of (re) processable, repairable and recyclable FRPCs [1]. Recently we have studied the self-heating by the Joule effect in composites reinforced with CNTs and GNPs [3]. We confirm that Graphitic nanofillers induce an increase of the thermal conductivity of the epoxy resin, proportional to the nanofiller content and that the electrical conductivity has a clear percolation threshold. Electrical conductivity is needed to create the Joule Effect. In this work, we study the curing, thermo-mechanical and electrical properties of a self-heating epoxy (DGEBA-AFD) and their graphene nanocomposites. The idea is to take the advantage of the high thermal conductivity of grapheme nanocompoposites to promote the self-healing.
2 EXPERIMENTAL
2.1 Materials
An aeronautical grade epoxy prepolymer based on a basic DGEBA, Araldite LY556 (LY), was purchased from Huntsman. The curing agent: 4-aminophenyl disulfide (AFD) was purchased from TCI Europe. AFD was mixed at stoichiometric concentration with respect to oxirane rings. Moreover samples containing an excess of AFD (11% by weight) have been prepared.
The epoxy-graphene nanocomposites were prepared using two types of graphene with different nanoplatelet dimensions: GNPn was purchased from Cheap-Tubes (GNPS grade 4) and GNPM25 was purchased from XGScience. GNPn graphene nanoplatelets have average
thickness < 4 nm and an average lateral size of 1-2μm, and GNPM25 graphene nanoplatelets
have average thickness of 6-8 nm and an average lateral size of 25 μm. Frekote from Loctite was employed as mold release product.
2.2 Preparation of the dispersions and nanocomposites
Dispersions of graphene nanoplatelets in the epoxy prepolymer were obtained through sonication during 60 min using a horn and a sonicator UP400S Hielscher: 0.5 s cycles with a power of 400 W and amplitude of 50%. The temperature did not exceed 80°C. Dispersions were prepared with 1wt%, 4wt% and 6wt% of GNPs. Once the dispersions were obtained, the curing agent (AFD) was added at 80-85 °C and mixed during 5 min, these samples were studied by differential scanning calorimetry (DSC) in order to investigate the curing reaction.
Moreover specimens for dynamic mechanical thermal analysis (DMTA) and for tensile tests were prepared. For this purpose after adding the AFD to the dispersions they were degased under vacuum (15 min, 50 mmHg) and poured in aluminum molds of suitable dimensions and cured in an oven following the protocol: 8h at 140 ºC under atmospheric pressure. The molds were coated with a release product.
AFD /LY ratio was stoichiometric (molar ratio amino hydrogen / epoxy group = 1.00). There have been also prepared samples having (11wt% excess of AFD) in order to compere results of the neat system with the previously reported [1]
2.3 Techniques
3
were performed under a nitrogen atmosphere Samples of 10-20 mg were weighted in aluminum pans. The reaction enthalpy (H) and the exothermic peak temperature (Tp) were obtained from the first scans (-50ºC to 270ºC) of the reactive mixtures and dispersions. For each composition several first scans were done at different heating rates from 3 to 10 °C·min-1 in order to calculate the apparent activation energy of the curing reaction (Ea). To obtain the Tg of the nanocomposites samples were scanned from 25 ºC to 250 ºC at 10ºCmin-1. The Tgs were taken at the midpoint of the heat capacity change.
Dynamic Mechanical Thermal Analysis (DMTA): a DMTA V Rheometric Scientific instrument was used. Measurements of cured samples were performed in dual cantilever bending mode at 1, 2, 5, 10 and 50 Hz, with temperature increasing from 30 °C to 220 °C at a heating rate of 2 °C·min-1. Specimens dimensions were: 35101.8 mm3. The elastic or storage modulus (E´), the loss modulus (E´´) and loss tangent (tan) were recorded for each frequency as a function of temperature. The maxima in tan-temperature curves were determined to identify the -relaxations associated to the glass transitions.
Tensile tests: a MTS machine model QTest 2L with a load cell of 2 kN, using an MTS extensometer model 63411F-54 was used to study tensile mechanical properties of the nanocomposites. Experiments were performed at room temperature (22 ºC) at constant speed of 1 mm· min-1 until fracture. The specimen dimensions were 140 x10 x 1.8 mm3. The stress-strain curves were recorded for six samples of each composition. The average values of mechanical properties: tensile modulus, tensile strength, strain to failure were calculated for each composition. Mechanical tests with the simultaneous measurement of the electrical resistance were performed using a Zwick Roell 100 kN machine with a coupled load cell of 5 kN and a meter instrument Agilent 34410A.
DC volume electrical conductivity was measured according to ASTM D257 using a Source Meter Unit instrument (Keithley 2410). The electrical resistance was determined from the slope of the current-voltage curve, and the electrical conductivity taking into account the geometry of specimens (10 x 10 x 1 mm3). Six samples of 6%GNPn nanocomposite were measured in the range of 0-15 V.
3 RESULTS AND DISCUSSION
3.1 Curing of GNP/epoxy dispersions by DSC
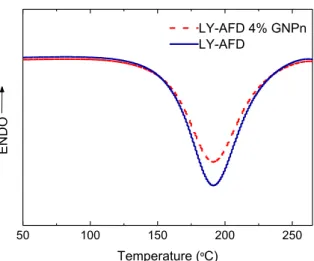
The thermograms of neat epoxy (LY-AFD) and 4wt% GNPn/epoxy dispersion are shown
in Figure 1.The exothermic peak corresponds to the epoxy-amine curing reaction. Table 1 shows the DSC results for neat LY-AFD mixtures having stoichiometric ratio and 11wt% excess of AFD, together with the results for the corresponding GNPn and GNPM25 dispersions
4
50 100 150 200 250
E
N
D
O
Temperature (ºC)
LY-AFD 4% GNPn LY-AFD
Figure 1: DSC thermograms (10ºC/min) of epoxy (LY-AFD) and 4wt% GNPn/epoxy
Table 1: DSC results of curing epoxy (LY-AFD) and GNP/epoxy dispersions
v
(ºC/min)
-ΔH (kJ/gLY)*
Tpeak (ºC) †
Tg
(ºC) ††
Ea
(kJ/mol)
LY-AFD
3 583 162 122
4 574 169 128
5 564 175 131 641
8 550 187 136
10 524 193 136
LY-AFD +1%GNPn
3 578 160 124
4 544 167 129
5 528 173 130 621
8 529 186 136
10 514 193 136
LY-AFD + 4%GNPn 10 530 192 137 -
LY-AFD + 4%GNPM25 10 556 192 138 -
LY-AFD (11% excess)
3 568 159 113
4 559 166 118
5 574 172 120 620.5
8 555 185 124
10 551 191 129
LY-AFD (11% excess) + 4% GNPn
10 558 191 130 -
5
Tpeak of samples containing 4% of GNPn and 4% of GNPM25 is slightly lower than Tpeak of
LY-AFD (see Table 1) this reflects a small catalytic effect of GNP. However, no catalytic effect was noticed for samples containing lower GNP content, a previous work with another epoxy resin having 1% of GNPM25 showed similar behaviour [4]. The values of Tpeakof
LY-AFD (11% excess) are lower than the corresponding to LY-LY-AFD which is due to the faster reaction of primary amine with respect to secondary amine. From the slope of the plots ln v vs. Tpeak-1, according to Arrhenius equation, the apparent activation energy of the curing
reaction (Ea) was obtained and the results are given in Table1. A decrease of Ea is clearly
detected of LY-AFD (11% excess) confirming that with amine excess the reaction goes faster.
The Tg values of samples cured during the first DSC scan are given in Table 1. The networks having excess of AFD have lower Tg than the stoichiometric LY-AFD samples. The preferential reaction of primary amine leads to networks with higher molecular weight between crosslinks, which corresponds with lower degree of crosslinking, and lower Tg. Regarding the effect of graphene on Tgthe presence of GNPs has little influence on the Tg of the epoxy network for samples dynamically cured in the DSC.
3.2 Thermo-mechanical properties of DMTA of GNP/epoxy nanocomposites
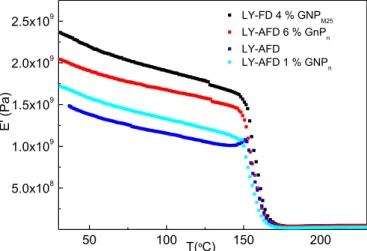
DMTA curves (E´-temperature and tan-temperature for neat LY-AFD thermoset and for LY-AFD-GNPs nanocomposites at 1 Hz are given in Figures 2a and 2b.
50 100 150 200
5.0x10⁸
1.0x10⁹
1.5x10⁹
2.0x10⁹
2.5x10⁹ LY-FD 4 % GNPM25
LY-AFD 6 % GnPn LY-AFD LY-AFD 1 % GNPn
E'
(Pa)
T(ºC)
Figure 2a:E´-temperature of epoxy (LY-AFD) and epoxy/graphene nanocomposites
It can be see (Figure 2a) that in the glassy state (T < Tg) the nanocomposites have higher E´ than the neat epoxy thermoset. Table 2 collect E´ values for all the nanocomposites in the glassy and rubbery state (T < Tg). As it can be observed the addition of GNP increases the storage modulus in the glassy (T < Tg) and rubbery (T > Tg) states with regard to neat epoxy
thermoset. The increment is proportional to the graphene content and is more important in the rubbery state. Moreover GNPM25 is a more effective reinforcement than the GNPn as a
6
opposite behavior is observed in the glassy state, because the stoichiometric network has all amine-epoxi bonds formed but is a less packed and more open network.
140 160 180 200
0.0 0.2 0.4 0.6 0.8 1.0
tan
T(ºC)
LY-AFD 6 % GNPPn LY-AFD 1 % GNPn LY-AFD
LY-AFD 4 % GNPM25
Figure 2b:E´-temperature of epoxy (LY-AFD) and epoxy/graphene nanocomposites
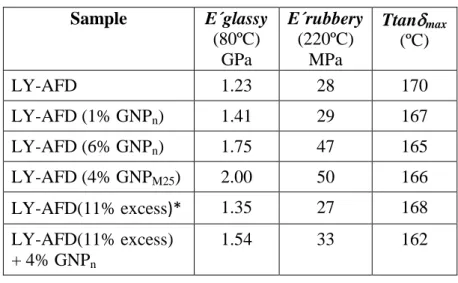
Table 2:E´ modulus, temperature of tanmax ,
of epoxy thermoset and GNP nanocomposites.
*Curing: 2,5h -120ºC+ 2h-150ºC
It is noteworthy that the tan -temperature curves (Figure2b) show a main peak around 162ºC-170ºC and a shoulder at 12-15ºC below. This reflects that the epoxy matrix behaves mechanically as no homogeneous, that is, there are regions with high mobility that relax at lower temperatures and rigid regions that relax at higher temperature. This behaviour is minimized in networks cured with excess of AFD, where the tan -temperature curves show a single peak.
Sample E´glassy
(80ºC) GPa
E´rubbery
(220ºC) MPa
Ttanmax
(ºC)
LY-AFD 1.23 28 170
LY-AFD (1% GNPn) 1.41 29 167
LY-AFD (6% GNPn) 1.75 47 165
LY-AFD (4% GNPM25) 2.00 50 166
LY-AFD(11% excess)* 1.35 27 168
LY-AFD(11% excess) + 4% GNPn
7
The temperature of tanmax at 1 Hz (-relaxation associated to the glass transition) for the
neat epoxy thermoset and for the nanocomposites are included in Table 2. The Tg is taken as temperatura at which tan (1Hz) reaches a máximum and usually Tgs from tanmax (1Hz) are
higher than the Tgs fromDSC.The nanocomposites (see Table 2) have lower temperature of tanmax than neat epoxy thermoset, i.e., a less perfect epoxy networks are formed in presence
of GNPs.
3.3 Tensile properties of DMTA of GNP/epoxy nanocomposites
The tensile properties of nanocomposites were determined by tensile stress–strain measurements. Figure 3 shows the more representative stress–strain curves for epoxy thermosets and GNP nanocomposites. From the curves the values of tensile modulus E, tensile strength (stress at break), strain at break and area under stress-strain curves which is a measure of the toughness were calculated. Tensile test results are given in Table 3. The tensile modulus of the nanocomposites is higher than that of the epoxy thermoset evidencing the reinforcing action of the GNPs. The tensile strength, deformation at break and toughness values hardly changes with low GNP content (1%). However tensile strength, deformation at break and toughness decrease for 4% and 6% of GNP nanocomposites. This suggests the presence of defects in these nanocomposites.
0 1 2 3
0 20 40 60
LY556 AFD LY556 AFD 1% GNPn LY556 AFD 4% GNPM25 LY556 AFD 6% GNPn3
St
res
s
(
M
P
a
)
strain (%)
Figure 3: Stress–strain curves for epoxy (LY-AFD) and epoxy/graphene nanocomposites
Table 3: Stress-strain results for epoxy thermosets and GNP nanocomposites
Sample
Young Modulus
(GPa)
Tensile strength
(MPa)
Deformacion at break
(%)
Toughness
(MJ/m3)
LY-AFD 2.76 0.09 60 4 2,8 0.3 0.97
LY-AFD 1%GNPn 2.83 0.07 56 3 2.7 0.2 0.93
LY-AFD 6%GNPn 3.32 0.19 42 2 1.8 0.3 0.46
8
3.4 Combined tensile tests-electrical conductivity GNP/epoxy nanocomposites
It is known that in nanocomposites the electrical conductivity shows a percolation threshold, this means that at GNP contents lower than the percolation threshold, the composites are insulator but their electrical conductivity increases abruptly at higher contents. The electrical percolation depends on the connectivity between nanoplatelets. Previous works [3] have shown that for GNPM25-epoxy nanocomposites the percolation threshold is close to 3%. As
GNPn has smaller dimensions, it is expected that its electrical percolation would be reached at
higher GNPn content. In order to select a suitable composition to carry out the combined
tensile stress-electrical conductivity tests, we have determined the conductivity of nanocomposites. Figure 4 shows the Intensity-Voltage dependence for six samples of LY-AFD-6%GNPn. From the slopes of Intensity-Voltage lines and considering the sample
geometry, a value of 10.4·10-5 S·m-1 was found, which is suitable for the combined tests.
Figure 4: Intensity vs.-voltage for LY-AFD-6%GNPn nanocomposites
In order to perform the combined tensile stress-electrical conductivity test of LY-XB-6%GNPn nanocomposite, the specimens prepared for the tensile stress–strain test were painted
around the perimeter with conductive silver paint at set intervals. Copper wire was then attached to the painting and covered with an adhesive thermoplastic, so efficient electrical contacts between the silver and the copper were produced. This set up creates five channels which allow the measurement of the electrical properties of the material at differentiated locations as can be seen in Figure 5 a. The tensile force-time curve of this set up was assayed at 5 mm/min while measuring simultaneously the two point electrical resistance at the different channels. The combined tensile force-electrical conductivity test for the LY-AFD-6%GNPn specimen is shown in Figure 5 b. It can be seen the tensile force-time curve together
the normalized resistance-time curves for the five different channels.
As the strain builds up in the specimen the electrical resistance through the different channels increases as seen by the rise in normalized resistance of all the channels. When the stress
0,00E+00 4,00E-07 8,00E-07 1,20E-06 1,60E-06 2,00E-06
1 6 11 16
In
ten
sit
y
(A)
9
disappears, in this case due to the specimen breaking, the conductivity of the channels returns to basal values, but the channel where the break occurs (chanel 11 in Figure 5) shows no conductivity after the break. This experiment would indicate that addition of 6% of graphene is not adequate as electrical sensor in the experimental conditions (high strain rate). Nevertheless this result suggest that reducing strain rate and/or GNPn content, GNPn could be
used as electrical sensor.
0 10 20 30 40 50
0.0 0.4 0.8 1.2 1.6 N o rm a liz e d R e sis te n ce Time (s) Canal 3 Canal 6 Canal 9 Canal 10 Canal 11 0 200 400 600 800 1000 A p p lie d F o rc e ( N )
Figure 5: Combined tensile tests-electrical conductivity for LY-AFD-6%GNPn nanocomposite: a)Specimen set up with five conductive channels before test, b) Force- time curve (
) together with resistance-time curves (□) measured in five channels, c) specimen after break.
4 CONCLUSIONS
- Incorporation of GNP up to 6% does not significantly modify the curing reaction of LY-AFD, nor in the presence of an excess of 11% of AFD.
- A small catalytic effect of GNP on curing LY-AFD was detected and the curing rate in excees of AFD (11%) is faster than in the stoichiometric LY-XB mixture.
- The networks having excess of AFD have lower Tg than the stoichiometric LY-AFD samples due to their higher molecular weight between crosslinks.
- The nanocomposites present increased glassy and rubbery moduli with regard to neat epoxy thermoset. The increment is proportional to the graphene content and is more important in the rubbery state.
- GNPM25 is a more effective reinforcement than the GNPn as a consequence of its
bigger size.
a c
10
- The sample having AFD excess presents E´ rubbery lower than the stoichiometric (LY-AFD) due to its lower degree of crosslinking. The opposite behavior is observed in the glassy state, because is a more packed network.
- Increasing GNP content increases the tensile modulus at room temperature. Tensile strength, strain at break and toughness decrease with the increase of GNP content suggesting the presence of defects.
- The measured conductivity of LY-AFD-6%GNPn is 10.4·10-5 S·m-1 been suitable to
carry out the combined tensile stress-electrical conductivity tests.
- The combined tensile force-electrical conductivity test for the LY-AFD-6%GNPn
specimen suggests that reducing strain rate and/or GNPn content, GNPn could be used
as electrical sensor.
Acknoledgements
The authors acknowledge the financial support by Ministerio de Economía y Competitividad of Spain Government (Projects: MAT2013-46695-C3 y MAT2016-78825-C2)
REFERENCES
[1] Ruiz de Luzuriaga A., Martín R., N. Markaide, Rekondo A., Cabañero G., Rodríguez J. and Odriozola I. Epoxy resin with exchangeable disulfide crosslinksto obtain reprocessable, repairable and recyclable fiber-reinforced thermoset composites. Mater. Horiz. (2016) 3:241-247.
[2] Azcune I. and Odriozola I. Aromatic disulfide crosslinks in polymer systems : selt-healing, reprocesability, recyclability and more.Eur. Polym. J. (2016) 84:147-160.
[3] Prolongo S.G, Moriche R. Del Rosario G., Jiménez-Suárez A. Prolongo M.G. and Ureña A. Joule effect self-heating of epoxy composites reinforced with graphitic nanofillers. J Polym Res (2016) 23:189 1-7