An Integrated Modeling Approach to Assess the Impact on
Road Freight Transport Demand of Allowing Longer and
Heavier Vehicles (LHVs) in Spain
Andres Felipe Guzman Valderrama
Assistant Professor, Centro de Estudios de Vías y Transporte – ECI, Colombia Jose Manuel Vassallo Magro
Professor, Transport Research Center TRANSyT – UPM, Spain
SUMMARY
The assessment on introducing Longer and Heavier Vehicles (LHVs) on the road freight transport demand is performed in this paper by applying an integrated modeling approach composed of a Random Utility-Based Multiregional Input-Output model (RUBMRIO) and a road transport network model. The approach strongly supports the concept that changes in transport costs derived from the LHVs allowance as well as the economic structure of regions have both direct and indirect effects on the road freight transport system. In addition, we estimate the magnitude and extent of demand changes in the road freight transportation system by using the commodity-based structure of the approach to identify the effect on traffic flows and on pollutant emissions over the whole network of Spain by considering a sensitivity analysis of the main parameters which determine the share of Heavy-Goods Vehicles (HGVs) and LHVs. The results show that the introduction of LHVs will strengthen the competitiveness of the road haulage sector by reducing costs, emissions, and the total freight vehicles required.
1. INTRODUCTION
Freight transportation has become an increasingly important player in national economies since it supports trade between producers and consumers. As of today, freight transportation systems throughout the world are facing key challenges to ensure a well-functioning system. For this reason, it is important to define regulations to better manage the freight transport system and which, in consequence will lead to a successful and sustainable transportation in the near future. In this sense, one of the possible measures that could be applied in the freight transportation system is to allow the circulation of Longer and Heavier Vehicles (LHVs). The experience of introducing LHVs is valuable in Europe (i.e. Sweden, Finland, Denmark, Germany, and Netherlands), and in other countries such as the United States, Brazil, Canada, Mexico, New Zealand, South Africa and Australia. These experiences have demonstrated that LHVs vehicles have the potential to make freight transport more efficient and environmentally friendly (Nagl, 2007). However, there also exist well-known disadvantages from allowing those vehicles to drive on the infrastructure as Grislis (2010) pointed out: pavement and road damage, safety, and road design issues.
using standard Heavy Goods Vehicles (HGVs) for international road freight transport to guarantee the same conditions for interoperability and competition among EU members. However, this Directive has not set up common rules for domestic transport, and allows to each member state to set size and weight of freight vehicles freely within their national borders. Consequently, transport government related parties and carriers involved in the transport of goods of Spain have been engaged in the debate about the introduction of LHVs, and they have not reached an agreement yet.
Although in Spain LHVs assessments have been carried out by considering the relaxation of dimensions and weights limits for HGVs taking into account economic efficiency matters or by considering the suitability of the road network for the introduction of LHVs, there is no travel demand model assessment performed for Spain to determine the demand and traffic flows of HGVs and LHVs across the roads of the whole country.
Within this context, this paper applies an integrated modeling approach composed of a Random Utility Based Multiregional Input-Output (RUBMRIO) model and a road transportation network model to study the impact of LHVs in Spain on road freight transport demand and traffic flows. This integrated approach is highly suitable to assess transport policies of road freight transport because it has a commodity-based structure that traces the linkages of inter-industry purchases and sales that use road freight services within the country.
This paper is organized into five sections. The literature review on methodologies to estimate the impacts of the introduction of LHVs is described in section 2, right after the introduction. In section 3, we set out the methodology proposed, the solution, and its limitations to assess the introduction of LHVs on a selected road network. The detailed description of the case study is described in section 3. The following section 4 presents an analysis of results in terms of demand changes, and on the transportation system as well. Finally, in section 5 we share the most relevant conclusions and suggestions about the implementation of policies, and possible future developments.
2. LITERATURE REVIEW
Most of the existing LHVs assessments have been focused on economic efficiency based on national desk-based studies –see for example Ericson et al. (2010), Lukason et al. (2011), and Ortega and Vassallo (2012). These authors have generally used the Cost-Benefit Analysis (CBA) to establish potential cost savings of the relaxation of dimensions and weights limits for HGVs through costing functions. Most of these studies have analyzed how main assumptions on transport costs, cost of road damage, traffic safety cost, congestion, and environmental costs of LHV introduction scenarios are advantageous in comparison to a reference scenario. These of the alternative limits. Also, other technical aspects of LHVs have been evaluated –see more details in Leduc (2009).
as Input-Output relationships, System Dynamics Models (SDM), or by considering price elasticities for some specific corridors –see more details in De Ceuster et al. (2008), Doll et al. (2009), K+P and ISI (2011), and Vierth et al. (2008).
All these available studies conducted for the introduction of LHVs have taken into account an in-depth analysis on how main assumptions on LHVs are advantageous in comparison to a reference scenario. It is very clear that transportation costs are the main reasons behind the introduction of LHVs because of the reduction that would result in transport costs per tonne-km carried, and in fuel consumption, with the subsequent reduction of emissions that make road freight transport more sustainable and cleaner.
In any case, all these studies have widely reported the expected impacts of introducing LHVs. However, in the case of Spain, the available studies have not provide a comprehensive evidence of the demand changes derived from the allowance of LHVs on the road network. Our research aims at filling this gap by addressing the impact of LHVs on the road freight transport demand in Spain. To this end, we have looked at a varied range of key factors pertaining to Spain that will influence the successful introduction of such vehicles. In addition, we applied these factors through an integrated modeling approach composed of a Random Utility-Based Multiregional Input-Output Model (RUBMRIO), and a road transport network model to study the impact of introducing LHVs in a selected road transport network of Spain (9,799 kilometers, or 6,089 miles, in length). The results come from a comparison between the base-case scenario, and the case study.
3. A METHODOLOGY FOR ASSESSING THE INTRODUCTION OF LHVs ON THE ROAD TRANSPORT NETWORK
O-D Matrices Conversion
Sector Pri ces Tr uck Type Empty Truck Factors Interregional Flows Stochastic User
Equilibrium Assignment
VDF Par ameters Fields Iter ations Tol erance . Road Representation Links, L Regions, R Generalized Transport Cost
Print Results
Inte rregional Flows Macroeconomic Impacts Link V olume s Tr ansportation System
Impacts Path Builder
Utilities Initi al values of are set to equal zero
N is Acceptable Tolerance
? Production Consumption Interregional Flows Acquisition Costs Selling Price Iteration Counter User Message Check Predefined Values Iterations Tolerance Tolerance Iteration Max ? N Y Print Results Y
(a)
(b)
Step 1) RUBMRIO input is generated from the road transport network model considering the free-flow time for the estimation of the Generalized Transport Cost among regions .
Step 2) Estimation of the utility for origin region i of moving goods of sector m to be consumed in region j, considering the Generalized Transport Cost . Initial values of the purchasing prices in the origin region i are set to equal zero, and a random error term .
Step 3) Regional production of any given sector m in a producer region i is evaluated including intermediate demand ( - endogenous) and final demand ( - exogenous). Initial values of interregional flow of goods and services are set to equal zero.
Step 4) Consumption of sector m in region j , is calculated considering the set of technical coefficients for the production process of all sectors considering region j and total production .
Step 5) Interregional flows are distributed considering utility variations.
Step 6) The tolerance criterion is evaluated. In the case of achievement the procedure stops, and these interregional flows are the inputs for the road network model.
Step 7) If tolerance was not achieved, acquisition costs are updated, to represents the average weighted cost of commodity m in region j.
Step 8) new prices are computed considering technical coefficients without import considerations as a proxy of the quantity of sector n needed for the production of one unit of sector m in region j , and acquisition costs . Sales price depends on the costs of purchasing raw materials, labor and necessary services form other producers. The new prices are used to run a new iteration until the equilibrium of interregional flow is achieved.
Step 9) Once the interregional flow is achieved; OD matrices per sector are prepared considering the interregional flows and conversion factors (e.g. prices, truck types, and empty truck factors).
Step 10) The route assignment is performed, and volumes of HGVs traffic is determined for each of the 17,422 links Step 11) The results of the assignment are updated in the Generalized Transport Cost function considering the new travel time .
3.1 The Random Utility-Based Multiregional Input-Output Model (RUBMRIO)
The Random Utility-Based Multiregional Input-Output (RUBMRIO) approach (Figure 1.a) replicates observed conditions of trade among regions through a Multiregional Input Output table (MRIO) by considering technical coefficients and trade coefficients. In fact, the MRIO table displays the economic relations among different production sectors, and among regions of a country instead of considering these relationships as spatially homogeneous (Duchin & Steenge, 2007). The MRIO table displays the economic relationships among different sectors by intersectional relationships of Input-Output coefficients or demand functions, and it is also capable of representing the spatial distribution of the flow of goods by using random utility-based models (Wegener, 2004).
As a result, the RUBMRIO model traces the linkages of inter-industry purchases and sales among regions within a given country by using transport, and in so doing it reproduces with more detail and realism freight transport services through a commodity-based structure rather than a trip-based or truck trip-based structure. Therefore, the RUBMRIO approach is able to show shifts between industries/sectors and regions supporting generative, redistributive, substitutability and complementarity effects through trade patterns.
RUBMRIO analyses have been conducted in well-known land-use models involving spatial economy e.g. MEPLAN, TRANUS, and PECAS (Echenique, 2004). In addition, RUBMRIO applications to transport cover different “ex-ante” topics such as: construction of transportation corridors, changes in travel times, infrastructure investment, operational cost variation, fuel taxes, road charging, trade pattern changes, and regional transport conditions—for more details see: Cascetta, Marzano, and Papola (2008), Du and Kockelman (2012), Guzman and Vassallo (2013), Huang and Kockelman (2010), Marzano and Papola (2008), and Zhao and Kockelman (2004). Most of these applications have found out important indirect effects of transport policies at the regional level on various macroeconomic aggregated indicators, but they do not evaluate the impact on the transportation system (e.g. congestion reduction, time savings, traffic flow deviation, pollution and reduction of emissions). Therefore, in our methodology we have included a transport network model in order to address these effects. More detailed discussion on the transport network model will be provided later on in this paper.
3.2 The Road Network Model
The road network is made up of a set of nodes and links. Links and nodes represent the physical structure over which traffic flow moves including attributes, such as: length, travel time, speed, number of lanes, traffic flow restrictions, origin and end-point of the roads, regional capitals, and larger municipalities or ports.
The road network model (Figure 1.b) should deal with the spatial representation of transport flows on a road network considering: 1) the conversion of interregional flows to vehicle flows so as to generate matrices; 2) an assignment procedure used to predict the traveler’s choice of routes in the road transport network. For this purpose, the model considers the fact that link travel times are flow dependent through a volume-delay function ( ) which reflect traffic behavior as is shown in Equation (1). This traditional formulation was proposed by the Bureau of Public Roads (BPR) in 1964, and has been used ever since to specify how sensitive the network times are to traffic congestion; and 3) determine possible routes between any two locations through a cost minimization criterion given by Equation (2).
1 1
, ∗ ∗ 2
is the travel time when the link is reached. is the free-flow travel time. is the traffic volume. is the practical capacity is used to mean the maximum possible flow of vehicles that can be allowed in a road section per time period (usually one hour). In addition, the practical capacity might be reduced by the amount of roadway capacity that is utilized by the pre-load volumes ─corresponding to trips performed by car, and bus. In addition, the practical capacity. However, it could also be used to reflect specific time periods by using time-of-day factors to distribute trips during the day in order to determine traffic behavior at the peak period. , are BPR parameters defined by link type (usually 0.15 and 4 correspondingly that facilitate the adoption of different functions for different kinds of links and for each class of traffic.
3.3 Model Integration and Solution
The integration is done on the basis of the algorithm shown in Figure 1. From the road transport network, the values of among regions are calculated considering
integrated approach is re-run, with the updated , through an iterative feedback process
until equilibrium is reached.
3.4 Limitations of the Integrated Approach
Although the integrated approach is sophisticated enough to obtain results of acceptable accuracy regarding economic matters and traffic flow impacts, the model still has limitations stemming from both the data and the methodology. The first set of limitations stems from the incomplete availability of Input-Output ( ) data regarding a fine level of spatial detail, information of exports and imports from other countries, and real transportation costs from confidential business data or negotiations among carriers to make the model more complete. The second set of limitations comes from the IO methodology since it does not permit us to: (i) answer questions concerning issues as innovation, technological progress, ownership structures, and other economic factors of industries; (ii) draw the effects of changes in an economy at a further particular point of time; (iii) combine at the same time various transport policy scenarios; and (iv) include passenger or freight logistic models.
4. CASE STUDY: THE INTRODUCTION OF LHVs ON THE ROAD TRANSPORT NETWORK OF SPAIN
4.1 Description
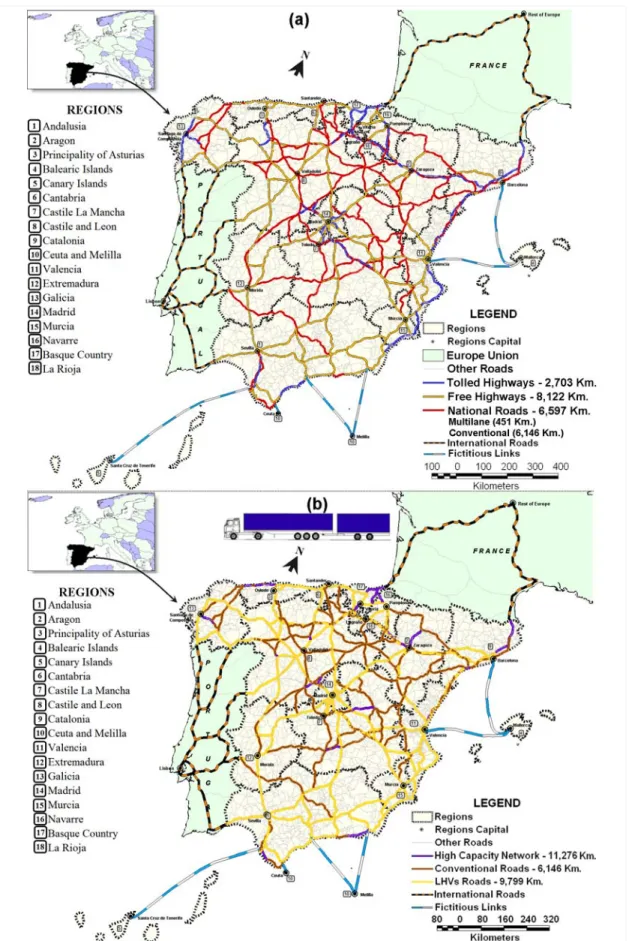
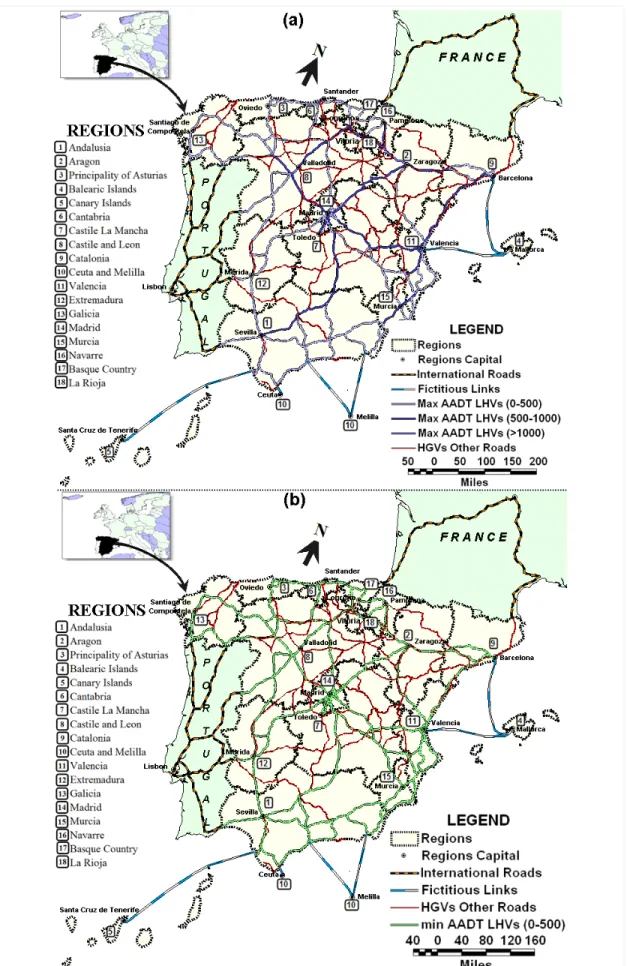
In 2007 Spain’s road transport network for HGVs has more than 20,000 kilometers distributed in high-capacity roads, and conventional roads. In this sense, it is important to note that the Spanish road transport network has witnessed the development of a vast modern high-capacity road network —11,276 kilometers (7,007 miles) of tolled highways, free highways, and multilane highways— over the last two decades (see Figure 2.a.).
With regard to freight transport, it is important to highlight that the road mode is by far the prevailing mode in Spain. Official statistics given in the Permanent Survey of Transport of Goods by Road —MFOM (2011) states that in 2010, 1,567 million tonnes —98.7%— were transported by road. Rail freight transport, by contrast, amounted only for 21.44 million tons —1.3%— in 2010 (FFE, MFOM 2011).
4.2 Application of the Methodology to the Base-Case
4.2.1 The RUBMRIO Model Estimation
In order to construct the model for Spain, we used the existing interregional IO table developed by the DESTINO research project (Consortium DESTINO et al., 2011) for the year 2007. A simplifying procedure was developed to aggregate sectors identified as freight transport intensive sectors (MFOM 2008a) —see Table 1—, non-freight transport intensive sectors (e.g. Trade and Repairs of Vehicles, Finance and Real State, Tourism, Education, among others), and to discard multi-sector relationships among sectors ( to ) to build up a MRIO compatible with the transportation data available.
Sector
Likelihood Ratio Index
McFadden Pseudo R2
( )
Fr
ei
gh
t Tr
an
sp
or
t
In
ten
sive
1 Agriculture, Fishing, Wood and Cork -0.00370* (-1.791) 0.602 0.151
2 Food and Kindred Products -0.00221(-1.618) 0.398 0.174
3 Non-metal Minerals and Kindred Products -0.00310** (-2.469) 1.212 0.174
4 Energy, Petroleum and Petroleum Products -0.00359* (-1.662) 0.286 0.101
5 Mining -0.00292** 0.999 0.328
(-2.393)
6 Metal minerals and Kindred Products -0.00262* 0.759 0.123 (-1.942)
7 Construction -0.00363** 1.730 0.365 (-2.508)
8 Chemical and Allied Products, Paper, Edition and Kindred Products, Rubber Materials -0.00186* (-1.726) 0.534 0.166
9
Textiles, Clothing, Leather and Shoes, Industrial Machinery and Equipment, Electric and Electronic Equipment, Transportation Equipment, and Other Manufacturing Industries
-0.00252*
0.417 0.144 (-1.68)
( ) Wald statistical significance test *p<0.10
**p<0.05
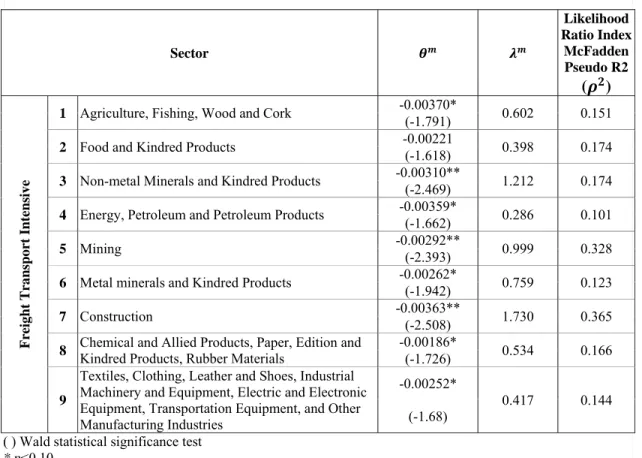
Table 1 – Input-Output Economic Sectors and Estimated Parameters for the Nested Logit Model
, (3)
, , (4)
shows the utility for region j of acquiring commodity m in region i. The systematic utility of the lower nest , is defined in Equation (4). is the price of goods/services of sector
m in region i. and are the logit model parameters. is the Generalized Transport Cost of sector m goods from production or origin region i to consumer region j. Total between production and consumer regions was incorporated to avoid possible multicollinearity problems.
For the calculation of transport costs inside the same region (i.e. ), an average cost value was determined from the capital of the region to provinces of that same region by using the road transport network. Regions outside continental Spain were linked to the continental transport network by using fictitious links and attributing a larger share of the total costs to fixed costs in the transport network. This calculation assumes that transport costs increase with distance. The resulting combinations are computed through the road network model as it is described in detail in the following section.
The parameter estimates of the NL utility model —shown in Table 1— were obtained by using the NLOGIT with the maximum likelihood method. The estimated coefficients have the expected signs because costs have a negative effect on utility. Moreover, the Wald statistic (values in brackets) rejects the null hypothesis that the coefficient is zero with a level of 90% confidence —p-values for each parameter are reported. Also, it is convenient to measure goodness of fit analogous to those in linear statistical models. Indeed, the Likelihood Ratio Index —McFadden Pseudo — provides a convenient basis for comparing different models when estimating more than one alternative. Pseudo values between 0.2 and 0.4 are fairly good reliable according to McFadden (1977).
Low values in these two tests could be explained by the lack of sufficient data at this point (Kockelman, 2008). This indicates that more data about flows of goods would be required in order to obtain more accurate results, but unfortunately these data are not available for the case of Spain.
4.2.1 The Road Network Model
year assignment model. We had to consider that in the model not only truck traffic —affected by the introduction of LHVs— but also cars and buses use the same road network. Therefore we treated these traffic flows as a pre-load volume, because we are not including them in our integrated modeling approach.
Conversion factors from the RUBMRIO model were applied so as to convert the measurement of the commodity trade in the transportation system from monetary units (Euros) to tonnes, and from tonnes to trucks per year, and finally, to trucks per day. This conversion used an average price per tonne for a specific commodity (€/tonne), the Heavy Goods Vehicles (HGVs) configuration of each sector, and a factor reflecting the percentage of trips of empty trucks. This procedure enabled us to obtain matrices per sector. The percentage of empty HGVs was adopted from the Ministry of Transportation of Spain (MFOM 2008a), considering pickup/delivery truck operations in both directions of origin-destination pairs as a proxy since detailed information required to build up an empty trip model for Spain was not available. Additional information regarding external trips (imports and exports to/from other peripheral countries as Portugal, and elsewhere in Europe) were also incorporated (Gutiérrez, Condeço-Melhorado, Martin, & Román, 2012), since it was not included in the RUBMRIO.
A Multi-Modal Multi-Class Stochastic User Equilibrium assignment (SUE) procedure was conducted to assign the HGVs traffic of the resulting matrices as user classes and considering VDF functions for each functional classification class through TransCAD for the base-case scenario. These functions incorporated individual variations of generalized cost perceptions. We adopted a time period of 24 hours (one day) since detailed information about time periods was not available taking into account that daily capacity is calculated by multiplying the hourly capacity by a daily expansion factor.
Functional Classification
Class
Number of (Links)
Km.
Average Traffic Count Data
Average Error
% Error
% RMSE
Recommended % RMSE*
1 Tolled Highways 2,703 (578) 5,576 -111.88 -3.65 29.92 43
2 Free Highways (1,776) 8,122 8,562 129.39 3.57 21.91 37
3 National Road System (1,520) 6,597 3,547 183.50 19.86 45.55 51
ALL (3,874)
17,422 8,523 114.62 4.62 27.95 37 * Recommended %RMSE targets for the average traffic count data considering guide (TMIP 2010)
Table 2 – Road Transport Network Model Validation by Functional Classification Class
4.2 Application of the Methodology to the LHV Scenario
The LHV scenario was developed by considering: ( ) the road network ready to handle LHVs; ( ) the distance over which goods are transported; ( ) the characteristics of commodities transported; ( ) the potential market which might be relocated away from the existing ones; and ( ) the expected cost reduction factor of LHVs compared to HGV. With regard to the road network suitable for the LHVs scenario, it was shown in Figure 2.b. In addition, we have excluded intraregional pairs because LHVs are mostly favorable for longer distances (De Ceuster et al., 2008; K+P Transport Consultants & ISI Fraunhofer, 2011).
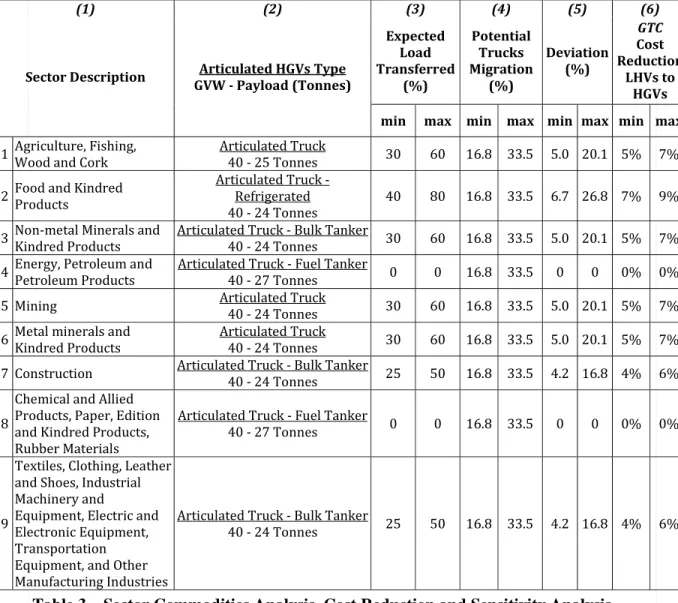
The characteristics of commodities as well as the potential market to be relocated in LHVs vehicles was defined by considering a sensitivity approach in the following way —see Table 3. First, loads transferred from HGVs to LHVs —column 3— were estimated based on the experience of other countries (De Ceuster et al., 2008; K+P Transport Consultants & ISI Fraunhofer, 2011; Vierth et al., 2008) and on the basis of their physical characteristics, such as the weight and/or volume for each commodity, and the ease of transferring them. We have considered a minimum and a maximum value.
maximum possibilities.
These factors are included in the integrated approach to generate the RUBMBRIO input according to Equation (5). Other research works have established cost saving of LHVs varying from 10 to 25% against conventional HGVs due to greater loads (De Ceuster et al., 2008; Doll et al., 2009).
∑ , 1 ∑ , 1
∑ ,
(5) ∀ ,
is the weighted average among regions for the LHVs scenario.
, are HGVs traffic flows from the base-case of the sector and for the same
pair. are deviation factors from HGVs to LHVs for each sector . is the generalized transport cost in the base-case scenario from production or origin region to consumer region . is the cost reduction factor of LHVs compared to HGVs defined in Table 3.
The assignment of the LHVs scenario was carried out in a way similar to that of the base-case one by adopting the calibrated assignment parameters of the base-base-case (VDF parameters, and empty trips of trucks per pair). The matrix included additional matrices of trips considering the new user class (LHVs) resulting from the deviation factors applied to the HGVs of each sector. Therefore, we have considered that LHVs will compete with other HGVs in the same road network. Also, for LHV trips the road links that cannot be used by these vehicles were specified. For both scenarios, transfer penalties for each functional classification of roads to prevent very short interchanges, convergence criterion value, and the maximum number of iterations to be performed were defined.
5. ANALYSIS OF RESULTS
The introduction of LHVs would mean lower transportation costs. This, in turn, would produce several effects on trade patterns and vehicle flows since it will make sales and purchases easier, and for that reason regions will be able to re-allocate goods to other regions, substitute production from other regions, and trade goods which previously were not being traded. All these changes will be reflected in the demand of freight services which in turn will be reflected on the road freight transport flows over the whole network.
(1) (2) (3) (4) (5) (6)
Sector Description GVW ‐ Payload (Tonnes) Articulated HGVs Type
Expected Load Transferred
(%)
Potential Trucks Migration
(%)
Deviation (%)
GTC
Cost Reduction
LHVs to HGVs min max min max min max min max
1 Agriculture, Fishing, Wood and Cork Articulated Truck40 ‐ 25 Tonnes 30 60 16.8 33.5 5.0 20.1 5% 7%
2 Food and Kindred Products Articulated Truck ‐Refrigerated
40 ‐ 24 Tonnes 40 80 16.8 33.5 6.7 26.8 7% 9%
3 Non‐metal Minerals and Kindred Products Articulated Truck ‐ Bulk Tanker40 ‐ 24 Tonnes 30 60 16.8 33.5 5.0 20.1 5% 7%
4 Energy, Petroleum and Petroleum Products Articulated Truck ‐ Fuel Tanker40 ‐ 27 Tonnes 0 0 16.8 33.5 0 0 0% 0%
5 Mining Articulated Truck40 ‐ 24 Tonnes 30 60 16.8 33.5 5.0 20.1 5% 7%
6 Metal minerals and Kindred Products Articulated Truck40 ‐ 24 Tonnes 30 60 16.8 33.5 5.0 20.1 5% 7%
7 Construction Articulated Truck ‐ Bulk Tanker40 ‐ 24 Tonnes 25 50 16.8 33.5 4.2 16.8 4% 6%
8
Chemical and Allied Products, Paper, Edition and Kindred Products, Rubber Materials
Articulated Truck ‐ Fuel Tanker
40 ‐ 27 Tonnes 0 0 16.8 33.5 0 0 0% 0%
9
Textiles, Clothing, Leather and Shoes, Industrial Machinery and
Equipment, Electric and Electronic Equipment, Transportation Equipment, and Other Manufacturing Industries
Articulated Truck ‐ Bulk Tanker
40 ‐ 24 Tonnes 25 50 16.8 33.5 4.2 16.8 4% 6%
Table 3 – Sector Commodities Analysis, Cost Reduction and Sensitivity Analysis
5.1 Impact of Allowing LHVs on the Demand of the Road Freight Transportation System of Spain
Impact on the demand of the road freight transportation system have been focused on changes in flow volumes under both minimum and maximum scenario, as shown in Table 4. Overall, the results show a promising decreases of freight transport flows considering the Annual Average Daily Traffic – AADT (-0.90% in the minimum scenario and -3.60% in the maximum scenario). Furthermore, the detailed results sorted by type of road are worth analyzing.
national road constraint.
One of the most important advantages of the introduction of LHVs is the reduction of emissions for different kinds of pollutants (CO2, NOx, and PM10) in both scenarios. In Table
4 we show the main results of the model in this respect. The expected reduction in the whole road network is less than 1% for each one of the three pollutants considered. However, considering the network where LHVs are not allowed –National roads, the reduction will much more significant. Although emission savings do not look substantial in the short term, they may have a greater impact in the long-term.
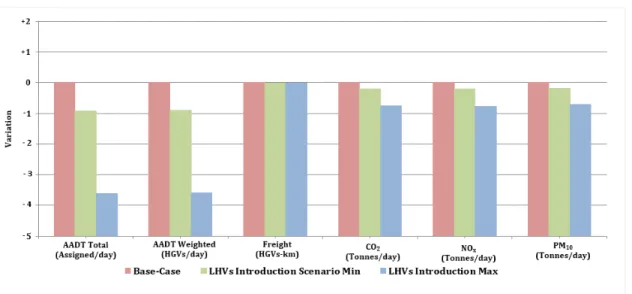
The comparison of both the minimum and the maximum scenario in relation with the base-case is shown in Figure 3. This figure displays the percentage change of both scenarios referred to the base-case scenario assumed as zero in each flow and emission comparison.
(a)
Functional Classification Class Number of (Links) Km Total AADT Assigned HGVs/day (Millions) HGVs-Km/day (Millions) Payload-Distance (tonne-km/day) (Millions) Base-Case Scenario LHVs Scenario min Max Change (%) Base-Case Scenario LHVs Scenario min Max Change (%) Base-Case Scenario LHVs Scenario min Max Change (%)1Highways Tolled (604) 2,703 1.78 1.76 1.77 -0.43-1.39 7.73 7.697.61 -1.62 -0.41 92.77 95.1396.03 2.543.51
2Highways Free (1,739) 8,122 6.59 6.34 6.53 -0.98 -3.86 29.28 29.00 28.17 -3.79 -0.96 351.41 351.59 352.10 0.05 0.20
3Road System National (1,531) 6,597 1.68 1.59 1.66 -1.26 -4.95 6.91 6.83 6.57 -4.92 -1.11 82.90 81.98 78.82 -1.11 -4.92
ALL (3,874)
17,422 10.05
9.96 -0.93
43.92 43.53 -0.90 527.08 533.51 -0.01 9.69 -3.60 42.35 -3.59 526.96 -0.02
(b)
Functional Classification Class Number of (Links) Km CO2 Emissions (Tonnes/day) NOx Emissions (Tonnes/day) PM10 Emissions (Tonnes/day) Base-Case Scenario LHVs Scenario min Max Change (%) Base-Case Scenario LHVs Scenario min Max Change (%) Base-Case Scenario LHVs Scenario min Max Change (%)1Tolled Highways 2,703 (604) 7,465 7,504 0.52 196.6 197.6 0.52 6.5 6.6 0.54
7,648 2.45 201.4 2.45 6.7 2.51
2Highways Free (1,739) 8,122 28,277 28,098 28,227 -0.18 -0.63 744.6 743.3 739.6 -0.63 -0.18 24.7 24.7 24.6 -0.17 -0.58
3Road System National (1,531) 6,597 6,671 6,343 6,597 -1.11 -4.92 175.7 173.7 167.0 -4.92 -1.11 5.8 5.77 5.54 -1.11 -4.92
ALL (3,874)
17,422 42,413
42.328 -0.20
Fig. 3 – Transportation System Impact Comparison
In addition, the model has allowed for the calculation of the LHV traffic volumes for both minimum and maximum scenarios (see Figure 4). This figure shows the flow volumes of LHVs in each link. In the maximum scenario (Figure 4.a.), the LHV flow volume will be significant in the road network ready to handle LHVs. 71% of the roads – 6,938 Km – will have less than 500 LHVs per day, 27% – 2,699 – will have between 500 to 1,000 LHVs per day, and only 2% – 161 km – will have more than 1,000 LHVs per day. On the other hand, in the minimum scenario (Figure 4.b.), the road network will not exceed the 500 LHVs per day.
6. CONCLUSIONS
This paper provides an integrated approach to assess the nationwide impact of transport policy measures such as the introduction of LHVs. The results demonstrate that the model developed in this research is able to forecast freight transport demand changes ─ direct and indirect effects ─ produced on freight flows. In addition, the model designed provides a useful tool for policy makers, governments, and transportation authorities to evaluate the expected impacts on the road freight transport system of a country.
The first conclusion of this research is that introducing LHVs is good for the road system since it can offer traffic and pollution relief across the country, since LHVs will reduce the amount of truck-kilometers needed for transporting goods. These results are a consequence of bigger trucks that imply a need for fewer trucks to move the same amount of freight. Moreover, bigger trucks imply more trade because transport, and consequently exports to other regions and abroad, are subsequently cheaper. Finally, it is worth noting that there will be a deviation of traffic towards the corridors where LHVs are allowed to be used.
The third conclusion is that national roads will experience the greatest decrease of traffic flows, and payload-distances (tonne-km). Fourth, introducing LHVs will lead to a certain reduction of emissions in the road transport network so it will overall be favorable for the environment. However, tolled highways will produce more emissions (CO2, NOx, and PM10)
since LHVs emissions factors per kilometer are greater than the emissions factors of HGVs. Overall, the results have pointed out that our integrated modeling approach based on a commodity-based structure assesses the impact of transport policy measures on freight flows running on the road transportation network. This approach overcomes the undesirable limitations of models based on truck-trips. As a result, this research has proposed, and constructed, a comprehensive approach to better forecast transportation demand impacts, upon the introduction of new freight transport vehicles (in this case, LHVs) within a country like Spain. Moreover, the integrated modeling approach determines the flow volumes of both HGVs and LHVs vehicles in the road network of Spain.
7. ACKNOLEDGEMENTS
The authors wish to acknowledge the support of the Research Ministry of Spain (MICINN) in funding the research project on the interregional input-output table approach to assess the effects of a transport policy measure (DESTINO).
8. REFERENCES
Cascetta, E., Marzano, V., & Papola, A. (2008). Multi-Regional Input-Output Models for Freight Demand Simulation at a National Level. In M. Ben-Akiva, H. Meersman, & E. Van de Voorde (Eds.), Recent Developments in Transport Modelling: Lessons for
the Freight sector (First Edit., pp. 93–116). London, UK: Emerald Group Publishing
Limited. doi:10.1016/B978-0-08045-119-0.00006-8
Consortium DESTINO, Universidad Politécnica de Madrid, Universidad Autonóma de Madrid, Universidad Complutense de Madrid, Universidad Politécnica de Cataluña, CSIC-IRNASA, … Grupo Enarcar S.A. (2011). Proyecto DESTINO: Desarrollo de Metodologías de Evaluación del Impacto Económico del Sistema de Transportes
Mediante Tablas Input-Output Interregionales. (Ministerio de Fomento Plan Nacional
de I+D+i (P42/08), Ed.) (pp. 1–200). Madrid, España: MICINN - Ministerio de Ciencia e Innovación.
De Ceuster, G., Breemersch, T., Van Herbruggen, B., Verweij, K., Davydenko, I., Klingender, M., … Bereni, M. (2008). Effects of Adapting the Rules on Weights and Dimensions of Heavy Commercial Vehicles as Established within Directive 96/53/EC. (I. & C. European Commission - Directorate General Energy and Transport - Unit Logistics, Ed.)TREN/G3/318/2007 (pp. 1–315). Brussels, Belgium: TML,
TRANSPORT & MOBILITY LEUVEN.
Doll, C., Fiorello, D., Pastori, E., Reynaud, C., Klaus, P., Lückmann, P., … Kochsiek, J. (2009). Long-Term Climate Impacts of the Introduction of Mega-Trucks Study to the
Community of European Railways and Infrastructure Companies (CER). (T. F.-I. for
Du, X., & Kockelman, K. M. (2012). Tracking Transportation and Industrial Production Across a Nation. Transportation Research Record: Journal of the Transportation
Research Board, 2269(-1), 99–109. doi:10.3141/2269-12
Duchin, F., & Steenge, A. E. (2007). Mathematical Models in Input-Output Economics.
Rensselaer Working Papers in Economics, 1–33. doi:10.1007/978-1-4020-5737-3_2
Echenique, M. (2004). Econometric Models of Land Use and Transportation. In D. A. Hensher, K. J. Button, K. E. Haynes, & P. R. Stopher (Eds.), Handbook of Transport
Geography and Spatial Systems. Handbook 5 of the Handbook in Transport (First
Edit., Vol. 5, pp. 185–202). Kidlington, UK: Elsevier Science Ltd.
Ericson, J., Gunnar, L., Mellin, A., & Vierth, I. (2010). Co-Modality – The Socio-Economic Effects of Longer and/or Heavier Vehicles for Land-Based Freight
Transport. In World Conference on Transport Research (Ed.), 12th World Conference
on Transport Research Society. Lisbon, Portugal: Selected Proceedings of the 12th
World Conference on Transport Research Society.
Fundación de los Ferrocarriles Españoles FFE, & Ministerio de Fomento - MFOM. (2011).
Informe 2010 - Observatorio del Ferrocarril en España. (M. Ministerio de Fomento,
Ed.)Documento de Trabajo 2011 (pp. 1–231). Madrid, España: Fundación de los
Ferrocarriles Españoles. Retrieved from
http://www.observatorioferrocarril.es/archivos/Ofe2010/ObservatorioFerrocarril_201 0.pdf
Grislis, A. (2010). Longer combination vehicles and road safety. Transport, 25(3), 336– 343. doi:10.3846/transport.2010.41
Gutiérrez, J., Condeço-Melhorado, A., Martin, J. C., & Román, C. (2012). Impacto de la Tarificación en Carreteras en el Acceso a los Mercados: El Caso de la Euroviñéta. In Congreso Panamericano de Ingeniería de Tránsito, Transporte y Logística (Ed.), XVII
Congreso Panamericano de Ingeniería de Tránsito, Transporte y Logística (pp. 1–
20). Santiago de Chile, Chile: Congreso Panamericano de Ingeniería de Tránsito, Transporte y Logística.
Guzman, A. F., & Vassallo, J. M. (2013). Methodology for Assessing Regional Economic Impacts of Charges for Heavy-Goods Vehicles in Spain. Transportation Research
Record: Journal of the Transportation Research Board, 2378(1), 129–139.
doi:10.3141/2378-14
Huang, T., & Kockelman, K. M. (2010). The Introduction of Dynamic Features in a Random-Utility-Based Multiregional Input-Output Model of Trade, Production, and Location Choice. Journal of the Transportation Research Forum, 47(1), 23–42. doi:10.5399/osu/jtrf.47.1.1061
K+P Transport Consultants, & ISI Fraunhofer. (2011). Study on the Effects of the
Introduction of LHVs on Combined Road-Rail Transport and Single Wagonload Rail
Kockelman, K. M. (2008). Documentation for Application of Kockelman et al.’s
Random-Utility-Based Multi-Regional Input-Output (RUBMRIO) Model. (Department of Civil,
Architectural and Environmental Engineering The University of Texas, Ed.) (pp. 1– 19). Austin, TX: Department of Civil, Architectural and Environmental Engineering The University of Texas. Retrieved from
http://www.ce.utexas.edu/prof/kockelman/RUBMRIO_Website/RUBMRIODocumen tation.pdf
Leduc, G. (2009). Longer and Heavier Vehicles: An overview of technical aspects. (J. R. C.-I. E. Comission, Ed.)JRC Scientific and Technical Reports (pp. 1–49). Seville, Spain: European Commission - Joint Research Centre - Institute for Prospective Technological Studies. doi:10.2790/12649
Lukason, O., Ukrainski, K., & Varblane, U. (2011). Economic Benefit of Maximum Truck Weight Regulation. Discussions on Estonian Economic Policy, 2(2011), 87–100. Marzano, V., & Papola, A. (2008). A multi-regional input-output model for the appraisal
of transport investments in Europe. In European Conference of Ministers of Transport ECMT (Ed.), European Transport Conference 2008 (pp. 1–12). Noordwijkerhout, The Netherlands: Association for European Transport.
McFadden, D. (1977). Quantitative methods for analyzing travel behavior of individuals: some recent developments. In D. A. Hensher & P. R. Stopher (Eds.), Behavioural
Travel Modelling (pp. 279–318). London, UK: Croom Helm London. Retrieved from
https://korora.econ.yale.edu/P/cd/d04b/d0474.pdf
Ministerio de Fomento - MFOM. (2008a). Encuesta Permanente de Transporte de
Mercancías por Carretera 2007. (Dirección General de Programación Económica del
Ministerio de Fomento, Ed.) (First., Vol. 1, pp. 1–206). Madrid, Spain: Ministerio de Fomento. Retrieved from
http://www.fomento.gob.es/MFOM/LANG_CASTELLANO/ESTADISTICAS_Y_P UBLICACIONES/INFORMACION_ESTADISTICA/Transporte/EPTMC/EPTMC_P ublicacion/defaultEPTMC2007.htm
Ministerio de Fomento - MFOM. (2008b). Mapa de Tráfico 2007. Estadísticas Y
Publicaciones. Madrid, Spain: Secretaria General de Infraeastructuras - Centro de
Publicaciones, Ministerio de Fomento.
Ministerio de Fomento - MFOM. (2011). Encuesta Permanente de Transporte de
Mercancías por Carretera 2010. (Dirección General de Programación Económica y
Presupuestos, Ed.)Serie Estadísticas (Vol. 1, pp. 1–226). Madrid, Spain. Retrieved from
http://www.fomento.gob.es/MFOM/LANG_CASTELLANO/ESTADISTICAS_Y_P UBLICACIONES/INFORMACION_ESTADISTICA/Transporte/EPTMC/EPTMC_P ublicacion/defaultEPTMC2010.htm
Nagl, P. (2007). Longer Combination Vehicles (LCV) for Asia and the Pacific Region:
Some Economic Implications. (P. and D. D. U. N. Amarakoon Bandara - Economic
Ortega, A., & Vassallo, J. M. (2012). El Mega truck en España: ¿Camino Hacia una Mejora Energetica y Medioambiental? In J. de Oña, F. Calvo, R. de Oña, & G. López (Eds.), X Congreso de Ingenieria del Transporte (pp. 1–13). Granada, España: ETSI Caminos, Canales y Puertos, Universidad de Granada.
Travel Model Improvement Program - TMIP. (1997). Model Validation and
Reasonableness Checking Manual. (Federal Highway Administration - Travel Model
Improvement Program, Ed.) (First Edit., pp. 1–118). Cambridge, MA: Federal Highway Administration.
Travel Model Improvement Program - TMIP. (2010). Travel Model Validation and
Reasonability Checking Manual Second Edition. (Federal Highway Administration -
Travel Model Improvement Program, Ed.) (Second Edi., pp. 1–240). Cambridge, MA: Federal Highway Administration.
Vierth, I., Berell, H., McDaniel, J., Haraldsson, M., Hammarström, U., Yahya, M.-R., … Björketun, U. (2008). The Effects of Long and Heavy Trucks on the Transport System
- Report on a government assignment. (E. and C. Ministry of Enterprise, Ed.)VTI
rapport 605A (pp. 1–92). Linköping, Sweden: Ministry of Enterprise, Energy and
Communications.
Wegener, M. (2004). Transport Geography and Spatial Systems: Overview of Land-Use Transport Models. In K. J. Button & D. A. Hensher (Eds.), Handbook in Transport (Vol. 5, pp. 127–146). Kidlington, UK: Pergamon/Elsevier Science.
Zhao, Y., & Kockelman, K. M. (2004). The random-utility-based multiregional input– output model: solution existence and uniqueness. Transportation Research Part B: