Travel time savings, better quality of supplied services, greater comfort for users, and improved accessibility are the main factors of success for high-speed rail (HSR) links. In this paper, results are presented from a revealed and stated preference survey concerning HSR and air transport users in the Madrid–Barcelona, Spain, corridor. The data gathered from the stated preference survey were used to calibrate a modal choice model aimed at explaining competition between HSR and air transportation in the corridor. The major findings of the paper describe the demand response to different policy scenarios considering improvements in the level of transport services. From the model, prices and service frequency were found to be among the most important variables in competing with the other mode. In addition, it was found that check-in and security con-trols at the airport are a crucial variable for users in making their modal choices. Other policies, such as the improvement of parking facilities at train stations, play a secondary role.
The development of high-speed rail (HSR) has been one of the central features of the recent European Union (EU) transport infrastructure policy. The proposals for a European HSR network emerged in a report of the Community of European Railways in 1990, and this was adopted as the base for what essentially became the European Com-munity’s proposed Trans-European Network (1). The latter, which is basically the linking of a series of national plans for promoting HSR improvements, emerged during the 1970s and 1980s.
High-speed trains can be used to solve two different accessibility problems. In the first case, in which a point-to-point link is dominant, each train is a potential substitute for an air connection between two cities (2, 3). The HSR link Madrid–Barcelona, Spain, belongs to this case. In the second case, in which a high-speed network is domi-nant, the train system links many cities and central business districts and, therefore, creates a new type of region sharing a common labor market and a common market for household and business services.
Having first sanctioned a 160-km/h maximum speed as recently as 1986, Spain moved quickly to get HSR into operation. The first pres-tigious alta velocidad Española (AVE), used to denote long-distance HSR services, linked Madrid with the country’s fourth largest city in Spain, Seville, which had been chosen to host the 1992 Expo World’s
Fair and to stimulate the economy of the country’s south in general. It was not until 2008 that Barcelona would have gained the AVE link with Madrid.
HSR was so successful in Spain that in its latest National Infra-structure Plan the government decreed that all capitals of Spain’s provinces should have a high-speed connection no longer than 4 h from the capital, Madrid, and 6.5 h from the second city, Barcelona (4). However, because of the high infrastructure cost of HSR and the shortfall of budgetary resources caused by the economic recession starting in 2008, the government has since postponed or even can-celed some of the projects already approved, such as the connection with Portugal.
The objective of this paper is to identify the key aspects that explain mode choice between HSR and frequent air transportation services for HSR in the Madrid–Barcelona corridor. The methodology used is based on modeling the choice between air and rail through the cali-bration of a binomial logit model with a survey carried out between February and March 2010.
The effects caused by investments in HSR have been analyzed in the literature in many different ways. In particular, studies on the Madrid–Barcelona corridor carried out before the entrance of HSR can be classified into the following groups: (a) evaluations of the economic profitability of particular corridors or areas [see de Rus and Román for the Madrid–Zaragoza–Barcelona HSR (5), de Rus and Nombela for the EU (6), and Martín and Nombela for Spain (7)]; (b) studies of the effects on accessibility (8–10); and (c) studies on intermodal competition based on the analysis of passenger percep-tions and preferences (11, 12), which analyzed the potential of high-speed trains to compete with airlines and private car markets by using stated preference (SP) experiments.
López-Pita and Robusté analyzed the effect that high-speed railway services have on air traffic demand by using forecasting models that have been applied in Europe (13). Forecasts predicted that the railway line will have a market share of between 53% and 63%, compared with its current 11%, thus reducing the airlines’ current 89% mar-ket share to between 36% and 47%. More recently, Román et al. used a mixed revealed preference (RP)–SP data set to study the Madrid– Zaragoza–Barcelona line, focusing on modeling issues and policy analysis (14, 15). Effort was concentrated on Madrid–Zaragoza and Madrid–Barcelona routes, in which HSR could attract more traffic from the competing modes. Román and Martín predicted an expected demand for HSR in the Madrid–Barcelona corridor of between 2.7 million and 3.2 million passengers per year, with a market share for HSR in the air–rail market ranging from 43% to 48%, and pointed out that this volume of traffic is not enough to guarantee that this proj-ect will have a positive social benefit (16). Finally, Román and Martín highlighted the important role that access time to terminals may play in regard to modal competition between rail and plane for interurban travel passengers (17).
High-Speed Rail Versus Air Transportation
Case Study of Madrid–Barcelona, Spain
This paper is organized as follows. The next section describes the main features of competition between HSR and air transportation in the Madrid–Barcelona corridor. In the following section, a mode choice model is calibrated with data from a survey carried out after the introduction of HSR. The last section discusses the conclusions and further perspectives.
CoMpetition Between HSR and aiR tRanSpoRt in MadRid–BaRCelona CoRRidoR
Madrid–Barcelona Corridor Before HSR
Before the entrance of HSR, the Madrid–Barcelona rail line was served by a low-quality service, especially in regard to the com-mercial speed achieved between the two cities (13). A conventional train of the Talgo technology covered the 625-km distance in 5 h 30 min for an average ticket price of €65 and with a service fre-quency of eight departures per day. Before the opening of the HSR service the patronage of the former rail service was about 800,000 passengers a year.
Most of the trips between Madrid and Barcelona (about 4.8 mil-lion in 2007), were therefore made by air transportation. In fact, the Madrid–Barcelona route was the busiest air route in Europe before inauguration of the HSR system. Iberia has been the major carrier on this route, particularly because of its air shuttle service “Puente Aéreo” (PA), which moved 3 million passengers before the open-ing of the HSR service. This air shuttle was conceived as a com-muter service. Passengers do not need a previous booking; they just arrive at the airport and board the next available flight. If a plane is full, another one departs shortly after, with peak-hour frequencies of departures every 15 min, rivaling those of public transportation. The idea is to provide plenty of flexibility and short waiting times at the airport. PA has its own identity brand and fare structure. PA has been a sort of second home to generations of businessmen and politicians, ready to pay for all this flexibility and convenience. It has been for years Iberia’s most profitable route; in a way, PA is to Iberia what London Heathrow–New York is to British Airways.
After the liberalization of the Single European Sky, other air car-riers such as Spanair, Air Europa, and Vueling entered the Madrid–
Barcelona market. Even though these companies have been gaining share over the years, they have not been able to beat the hegemony of Iberia on this route.
opening of HSR Service Between Madrid and Barcelona
The Madrid–Barcelona corridor is one of the busiest in passenger transport in Europe. Madrid City has a population of about 3.3 lion inhabitants, but the Madrid metropolitan area has about 6.5 mil-lion. The city of Barcelona has 1.6 million, but its metropolitan area reaches 3 million. Both cities are quite compact. The density of Madrid is 5,400 inhabitants per square kilometer, and the density of the city of Barcelona is 15,900 inhabitants per square kilometer, more compact than the density of most U.S. cities.
The completion of HSR between Barcelona and Madrid has had a stronger effect on the route as HSR has emerged as a real alternative in regard to frequency and comfort for business travelers, taking half of the market on the Madrid–Barcelona corridor. HSR has forced Ibe-ria to reduce capacity and maintain frequency with smaller aircraft. However, the 625-km (388-mi) distance between Madrid and Barce-lona is really at the edge of what is considered a competitive distance range for HSR. For that reason the analysis of competition between HSR and PA in this corridor was found to be particularly interesting.
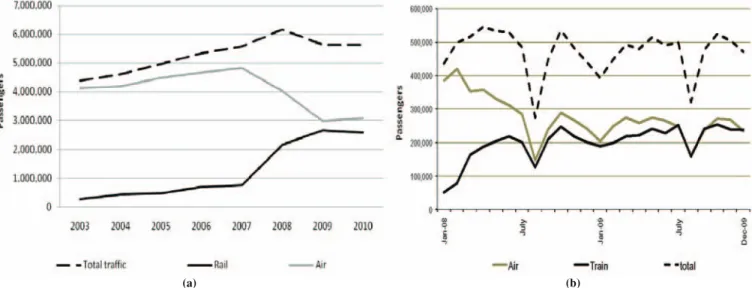
Figure 1 shows the evolution of market share before and after introduction of the new HSR. The total number of passengers trav-eling by air and train has increased constantly over the years, reach-ing a peak in 2008. The reduction of passengers from 2008 on was caused by the economic recession that struck Spain and has con-tinued ever since. Some of those passengers moved to cheaper and slower transport modes such as coaches.
With the introduction of HSR at the beginning of 2008, passenger volume for the rail mode increased by 1,380,000 in the first year of operation and by more than 500,000 in the second year. In the same period air transport lost 800,000 passengers in the first year and more than 1 million in the second year. The modal share at the end of 2009 was 47.1% for rail and 52.9% for air.
In 2010 a slight increase in modal share for the air mode was registered (to 54.4%) and a slight drop to 45.6% for rail. The reason
(a) (b)
12 Transportation Research Record 2289
for this increase was the air companies’ response to the competition from HSR: the reduction of air ticket prices.
Competitive Characteristics of HSR and iberia air Shuttle in Madrid–Barcelona Corridor
Madrid and Barcelona are the two most important economic poles in Spain. This fact generates a great number of short-term business trips between the two cities. Before the opening of the HSR service, most of these trips were channeled through the Iberia air shuttle, PA. After the inauguration of HSR a strong competition started between PA and HSR services. This subsection analyzes the aspects that might influence the modal choice. The following have been identified: travel time, service frequency, price, reliability, and comfort, along with the possibility of engaging in additional activities during the trip.
Travel Time
Travel time is made up of (a) access time from origin to airport or station, (b) check-in time and security procedures, (c) waiting time at the airport or station, (d) transport time, (e) baggage pickup time if necessary, and ( f) egress time from airport or station to final destination.
PA transport time is 1 h 10 min. HSR transport time depends on the number of stops made by the train. There are basically three different types of HSR service in regard to time: (a) nonstop trains that take 2 h 38 min, (b) trains stopping in Zaragoza that take 2 h 52 min, and (c) trains stopping three times along the way that take 3 h 18 min. Consequently the travel time varies between 2 h 38 min, and 3 h 18 min.
The time in the airport for the air shuttle is only 30 min. This time includes check-in, security procedures, and waiting time. This time is shorter than the equivalent for conventional flights because PA has a specific security checkpoint next to a specific boarding gate assigned to PA, which is the boarding gate closest to the airport entrance. The check-in and waiting time for HSR is between 10 and 15 min.
The baggage check-in and pickup time is nonexistent for HSR since passengers are allowed to board trains with heavy luggage. Check-in and pickup time plus security procedures time are much longer for PA. However, 80% of PA users do not check baggage, so ultimately that is not such a critical aspect. The EU sets up com-mon rules across its countries to protect civil aviation against acts
of unlawful interference. The regulation’s provisions apply to all airports or parts of airports located in an EU country that are not used exclusively for military purposes. Airport security in Spain is provided by police forces, as well as private security guards. Secu-rity checkpoints in Spain involve inconvenience for users stem-ming from the long time spent waiting in lines and the requirement of passing through detectors for metal and explosives.
Access time from the origin of the trip to the departure airport or station and the egress time from the arrival airport or station to the final destination are crucial factors explaining modal choice. Atocha Station in Madrid and Sants Station in Barcelona are located in central positions inside the cities with good accessibility by public transportation. However, the stations are not convenient for people getting there by car because parking facilities in the stations are small and fill up early in the morning. Barajas Airport in Madrid and El Prat Airport in Barcelona are located 15 km and 13.5 km away from their respective city centers. This is not too far compared with other airports. Despite that, Barajas and El Prat Airports are still much farther from their respective city centers than are Atocha and Sants Stations.
Table 1 shows that average travel times by public transportation to the stations are shorter than to the airports, especially in Barce-lona. This table displays average travel times. Obviously personal travel times depend on the ultimate location of the origin and the destination of the trip within the regions. The difference in regard to car accessibility, by both private car and taxi, is not so notable. Moreover, even though travel times by car and taxi to the stations are shorter, Atocha and Sants Stations have two problems. The first one is their scarce parking capacity. Atocha Station in Madrid has only 965 parking spaces compared with 16,300 spaces at Barajas Airport, and Sants Station Barcelona has only 900 parking spaces compared with 13,000 at El Prat Airport. The second one is waiting time for passengers taking taxis, which is longer at the stations compared with waiting time at the airports.
Travel Cost
HSR and PA have different travel classes. PA has the traditional econ-omy and business classes, even though most of the passengers (98% according to the questionnaire conducted for this research) choose economy class. The HSR service has three different classes: econ-omy class, which is chosen by most passengers (81% according to the questionnaire conducted for this research); business class chosen by
TABLE 1 Average Access Time and Average Cost to Get to HSR Stations and Airports in Madrid and Barcelona
Madrid Barcelona
Time (min) Cost (E) Time (min) Cost (E)
Access Mode
Atocha Station
Barajas Airport
Atocha Station
Barajas Airport
Sants Station
El Prat Airport
Sants Station
El Prat Airport
Taxi 15 20 14 28 10 25 10 26
Car 15 20 29 20 10 25 26 20
Local train 15 NA 0 NA 12 45 0 3
Metro 30 35 1 2 12 NA 1 NA
Bus 45 45 1 1 20 40 1 5
18%; and club class chosen by 1%. In this section the focus is on cost for economy class, which is the service taken by most users.
Travel cost includes the price of buying the air or train ticket plus the access cost to and from the stations. Ever since inauguration of the HSR service, there have been constant changes in the pricing policies of the PA and HSR services responding to each other’s strategy. To give an example, when HSR service between Madrid and Barcelona was inaugurated, PA reduced its prices by 35%, the lowest air fare for this service.
In March 2010, when the survey described in the following section was conducted, the one-way price for PA was €129. Iberia offered rebates to this price for either buying a round-trip ticket or buying the ticket in advance. The one-way price for HSR was €135.5, slightly more expensive than PA’s price. RENFE, the company operating the HSR service between Madrid and Barcelona, offered a 20% discount for a round-trip ticket, a 40% discount for buying the ticket 1 week in advance, and a 60% discount for buying the ticket 2 weeks in advance.
To the price of the ticket, the cost of accessing and leaving the air-port or station has to be added. Table 1 shows the average costs to get to and to come from the stations and airports in Madrid and Barcelona. The costs include parking fares paid in the case of parking a car at the airport or station. The cost of using a local train to get to or to leave the stations is zero because the HSR ticket enables users to take a local train at the station free of charge. The only access mode that is more expensive for getting to the stations than to the airports is the car, pre-cisely because of the high price of parking at Madrid and Barcelona stations compared with parking prices at the airports.
Service Frequency
Frequency is a crucial variable for modal choice, particularly for busi-ness travelers. More frequent services allow passengers greater flex-ibility to get back sooner or later if their meetings end before or after schedule. That issue explains why, despite the PA patronage reduction after the opening of the HSR service, one of Iberia’s priorities for PA was to maintain the same frequency. This was achieved by introduc-ing smaller planes on the Madrid–Barcelona route. As of March 2010, Iberia offered 30 flights a day on working days for each direction. The frequency offered by HSR was 27 trains a day for each direction, but only 10 of them were nonstop trains. This makes the HSR frequency less appealing for users than the PA frequency.
Reliability
One main advantage of HSR services compared with air transporta-tion is punctuality and reliability. Actually, the percentage of PA flights getting to their destination on time in 2010 was 92% compared with 99.3% for HSR. HSR services are less sensitive to weather con-ditions and congestion problems than is air transportation. Moreover, in the case of a delay longer than 15 min RENFE reimburses 50% of the ticket price; the reimbursement is 100% if the delay is longer than 30 min. PA does not offer any kind of reimbursement for delay.
Comfort and Possibility of Additional Activities During Trip
Anther crucial advantage of HSR compared with PA is greater com-fort for the user and the possibility of taking advantage of travel time
to work or to engage in other activities. HSR is more comfortable in regard to space for users. The seats are wider and the distance between seat rows is longer (90 cm in the economy class of HS trains versus 73 cm in the economy class of the air shuttle). Inside the trains, users may have access to the Internet, and they can use their cell phones. Moreover, the train is equipped with a cafeteria car where passengers can have meals or drinks. Because of those aspects, users perceive HSR travel to be better than traveling by plane.
MadRid–BaRCelona CoRRidoR afteR HSR
Survey
The results of a survey conducted between February and March of 2010 have been used to analyze the competition between HSR and PA along the Madrid–Barcelona corridor. The reference universe is made up of all users who in the reference period traveled along the corridor with HSR and PA, moving from the Atocha train sta-tion and Barajas Airport in Madrid, respectively. The survey was designed specifically to analyze the demand response to additional policies—different from the obvious and substantial reduction in travel time after the opening of the HSR service—which would affect the competitiveness of both modes in the near future. There-fore, specific questions were included to obtain information about other important service attributes.
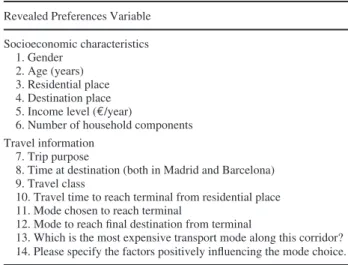
The questionnaire submitted to users was made up of two parts: the first included RP questions concerning users’ socioeconomic characteristics, trip purpose, time at destination, travel class, and so on (Table 2). The second part collected the information needed to specify and then to calibrate a mode choice model between HSR and PA. Although the survey did not contain a standard stated choice experiment, some SP questions were included to analyze the effect of travel cost, service frequency, parking availability at the train station, as well as the ease of security controls at the airport.
From the RP survey, it has been found that most users are men, 71% and 75% from Atocha and Barajas, respectively. Most users are between 36 and 50 years old. The income level ranged between €40,000 and €80,000 a year. The main trip purpose was work for 66% of the users traveling from Barajas and 81% for those who traveled from Atocha. The specific details of the sample distribu-tion are shown in Table 3. Concerning the SP survey, users were
TABLE 2 Characteristics of Questionnaire
Revealed Preferences Variable
Socioeconomic characteristics 1. Gender
2. Age (years) 3. Residential place 4. Destination place 5. Income level (€/year)
6. Number of household components Travel information
7. Trip purpose
8. Time at destination (both in Madrid and Barcelona) 9. Travel class
10. Travel time to reach terminal from residential place 11. Mode chosen to reach terminal
12. Mode to reach final destination from terminal
14 Transportation Research Record 2289
presented with different scenarios representing possible changes in the transportation supply system in regard to the following attribute changes:
1. Increase in fare ticket for competing mode (in Barajas and Atocha),
2. Increase in service frequency of HSR (in Barajas),
3. Improved parking opportunities at the train station (in Barajas), and
4. Eased security controls at the airport (in Atocha).
Mode Choice Model
Discrete choice models have been widely used to study travelers’ behavior in the mode choice context. The theoretical underpinnings are found in the theory of rational choice and in the utility maximization behavioral rule. Thus, the utility to the decision maker is represented by the random variable Ujq= Vjq+εjq, where Vjq is the deterministic or observable utility and εjq is a random term representing the portion of utility unknown to the analyst. Therefore, under the assumption of utility maximization, it is possible to model only the choice probability of the different alternatives.
Different assumptions about the distribution of the unobserved portion of utility εjq result in different representations of the choice model. Thus, the widely used multinomial logit (MNL) and nested logit (NL) models are obtained when εjq are independent and identi-cally distributed (iid) extreme values and a type of generalized extreme value, respectively [see Train (18) and Ortúzar and Willumsen (19) for more details about the derivation of the choice probabilities]. The mixed logit (ML) model solves the main limitations of the MNL and NL models. The ML model allows for random taste variation, unrestricted substitution patterns, and even correlation in unobserved factors over time, which is particularly useful when one deals with
SP or panel data. The ML model is a very flexible model that can approximate any random utility model with total precision (20). Under the random coefficient version, the utility of alternative j for an individual q is represented by Ujq = β′qxjq + εjq, where xjq is a vector of observed attributes of alternative j for decision maker q, εjq is a set of random variables iid extreme value, and βq is a vector of random coefficients. In the error component formulation of the ML model, utility is represented by Ujq=α′xjq+ µ′qzjq+εjq, where xjq and zjq are vectors of observed attributes of the alternative j for individual q, α is a vector of fixed coefficients, µq is a vector of random terms with zero mean and covariance, and εjq are defined as above.
Three different models, based on the following linear-in- the-parameter specification for utility, were considered for this data set:
VAIR=βASC_AIR+βCOSTiCOSTAIR+βFREQiFREQAIR
++
= +
β
β β
CHECK-IN AIR
AVE COST AVE
CHECK-IN
COST i
i
V FFREQ AVE
PARKING AVE
FREQ
PARKING CAR i
i i ( )
+ β 1
where
COST = travel cost in euros,
FREQ = service frequency measured in departures per hour, CHECK-IN = 1 if security control service and check-in at the
airport are rapid and smooth and 0 otherwise, PARKING = 1 if parking capacity at the train station is good
and 0 otherwise,
CAR = 1 if access is by car and 0 otherwise, and βs = unknown parameters.
In particular, βASC_AIR represents the air-alternative-specific
con-stant, while other parameters represent the marginal utility of the corresponding attributes. Because particular interest lies in analyzing the policy consisting of improving parking facilities at the Atocha train station, the study of this effect refers only to trips with a home end in Madrid.
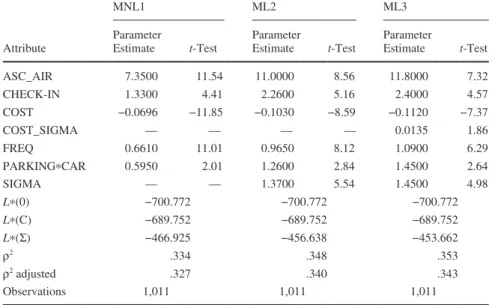
For the first model (MNL1), a binomial logit model specification was considered; for the second model (ML2) an error component panel mixed logit model was considered with fixed parameters but accounting for the correlation between the choices made by the same individual. Finally, in the third model (ML3), random taste hetero-geneity was analyzed considering the specification of a random cost parameter following the normal distribution. Random taste heteroge-neity was also tested for the rest of the parameters, but no consistent specification was found with more than two random parameters.
Unknown parameters were calibrated with BIOGEME 1.8 (21). Estimated results are shown in Table 4.
In all cases, parameters were significant at the 95% confidence level and presented the expected sign. The only exception was the standard deviation of the cost parameter, which was significant at the 94% confidence level. An increase in the cost of the ticket makes both alternatives less attractive as does a decrease in service fre-quency. A hypothetical increase in parking capacity around Atocha Station would make the HSR alternative more attractive, and the same would be true for the air alternative after a reduction in the time relative to check-in and security control at Barajas Airport. In that respect, the PARKING variable was significant only for those passengers who used a private car as their access mode to the
TABLE 3 Descriptive Analysis of Sample
Category Barajas (%) Atocha (%)
Age (years)
18–24 10 6
25–35 39 26
36–50 35 44
51–65 14 18
>65 10 6
No response 1 2
Income (€/year)
0–20,000 10 6
20,000–40,000 39 26
40,000–80,000 35 44
80,000–150,000 14 18
>150,000 10 6
No response 1 2
Trip purpose
Work 66 81
Leisure 25 7
Visiting relatives or friends 4 9
Other purposes 5 3
Travel class
Economy 98 81
Business 2 18
airport; that is, when the interaction PARKING*CAR was specified. Because the specification of the model does not include travel time as an explanatory variable, the effect of this attribute is confused with the alternative-specific constant for the air alternative, which explains the high value obtained for this parameter. Therefore, the positive sign of this constant should be interpreted in this case as passenger preference, in regard to total travel time and other unob-served factors, for the air alternative when the effect of the rest of the attributes is negligible.
The standard deviation (SIGMA) of the error component was found to be significant in both the ML2 and the ML3 models, thus verifying the existence of a correlation between choices made by the same individual in the SP questions. The size of this parame-ter indicates that the correlation is higher in model ML3. Because this model also presented a better likelihood and a better goodness of fit (according to the value of the rho square indices), it is preferred over the other two models.
demand analysis
From the estimates carried out, some results can be obtained on what effects changes in the supply system would have on users’ choices. Assuming a 3% increase in total traffic (to 5.815 million passengers) for 2011, the model predicts a 44.15% market share for HSR in this corridor given the actual situation. Improvements in the parking facilities at Atocha Station do not represent a sub-stantial increment in the market share of HSR (46.11%). However, improvements in check-in and security control processes at Barajas Airport would place the plane in a dominant position (77.64%) compared with that enjoyed by this mode before the entrance of HSR in the corridor. Departing from the actual situation, for HSR to achieve 50% of the market, a fare reduction of 3.76% would be needed. If the objective for the rail operator is to obtain more than a 10% advantage over the competing mode, a fare reduction of 6.63% should be accompanied by an incremental increase in the service frequency of 1.29%. A higher effort would be required to exert
a strong dominance (more than 60% of the share) in this market. In this case fares should decrease by 9.55% and frequency should increase by 1.81% (Table 5). These results reinforce the importance of prices and service frequency as the main instruments of modal competition for HSR in this market. The effect of other policies, such as improvement in parking facilities at the train station, would play a definitively secondary role.
willingness to pay for improving level of Service
Willingness to pay (WTP) measures, in monetary terms, express changes in the utility resulting from changes in the level-of-service attributes. In other words, the WTP is represented by the marginal rate of substitution between travel cost and the corresponding attri-bute. WTP measures are derived from estimates of discrete choice
TABLE 4 Estimation Results: After HSR
MNL1 ML2 ML3
Attribute
Parameter
Estimate t-Test
Parameter
Estimate t-Test
Parameter
Estimate t-Test
ASC_AIR 7.3500 11.54 11.0000 8.56 11.8000 7.32 CHECK-IN 1.3300 4.41 2.2600 5.16 2.4000 4.57 COST −0.0696 −11.85 −0.1030 −8.59 −0.1120 −7.37
COST_SIGMA — — — — 0.0135 1.86
FREQ 0.6610 11.01 0.9650 8.12 1.0900 6.29 PARKINGCAR 0.5950 2.01 1.2600 2.84 1.4500 2.64
SIGMA — — 1.3700 5.54 1.4500 4.98
L(0) −700.772 −700.772 −700.772
L(C) −689.752 −689.752 −689.752
L(Σ) −466.925 −456.638 −453.662
ρ2 .334 .348 .353
ρ2 adjusted .327 .340 .343
Observations 1,011 1,011 1,011
Note: — = not applicable.
TABLE 5 Demand Responses to Improvements in Supply System
Market Share Passengers (thousands)
Policy Scenario Plane (%) HSR (%) Plane HSR
Actual situation 55.85 44.15 3,248 2,568 Improvement in parking 53.89 46.11 3,134 2,681 Improvement of check-in
and security process in Barajas Airport
77.64 22.36 4,515 1,300
HSR fare reduction: 3.76% 50.00 50.00 2,908 2,908 HSR fare reduction: 6.63%;
HSR frequency increment: 1.29%
45.00 55.00 2,617 3,198
HSR fare reduction: 9.55%; HSR frequency increment: 1.81%
16 Transportation Research Record 2289
models as the ratio between the marginal utility of this attribute (qkj) and the marginal utility of the travel cost (cj):
WTPq
j j
kj j
kj
j
j
kj
dc dq
V q V c = − =
∂ ∂ ∂ ∂
( )2
where Vj is deterministic or observable utility of the alternative j as introduced previously.
In the case of qualitative variables, the WTP for improving an attri-bute (e.g., passing from Level 0 to Level 1) is given by the following expression:
WTPqj j j
kj
V V
= −
1 0
3
λ ( )
where V0
j, V1j represent the observable utility when the attribute takes Level 0 and 1, respectively; and λ is the marginal utility of income, which coincides with minus the marginal utility of the travel cost (−∂Vj/∂cj).
When the specification of Vj is linear with fixed parameters, as in MNL1 and ML2 models, Equation 2 yields the quotient between the coefficients of qkj and travel cost. Therefore, the point estimate of the WTP is represented by a fixed value. In the ML3 model, because the cost parameter is a random variable, the WTP measures for this model are random variables as well. Therefore, computation of the WTP distributions requires simulation of the cost parameter normal distribution according to the point estimates for the mean and stan-dard deviation. The table below shows the WTP measures obtained for models considered in the analysis. Values reported for the ML3 model below correspond to the WTP computed at the mean value of the cost parameter. In general, mixed logit specifications exhibit higher values for the WTP measures. The only exception is found for the service frequency in the ML2 model.
Attribute MNL1 ML2 ML3
Check-in (€) 19.11 21.94 21.43 Frequency (€/service) 9.50 9.37 9.73 Parking*Car (€) 8.55 12.23 12.95 The highest WTP, ranging from €19 to €22, is found for speed-ing up the check-in and security control processes at the airport. The three models presented a very similar WTP figure for having an additional departure per hour (about €9). Finally, the WTP for parking space availability at the train station ranges from €8 to €13, depending on the specification considered.
Figure 2 depicts the distribution of the WTP measures for the ML3 model after consideration of 10,000 random draws of the normal distribution for the cost parameter. The 95% confidence intervals for these distributions are also reported. Results show that the WTP for greater frequency presented the distribution with the lowest variance. However, as the only differences in the shape of the distribution are due to changes in the scale of the variable, all of the distributions presented the same value for the coefficient of variation: 12.61%.
ConCluSionS
This paper shows the big impact that introducing an HSR service between two big cities with a strong business relationship, such as is the case for Madrid and Barcelona, may have on the modal share distribution in the corridor. Despite that, the ultimate results show that the market share taken on by HSR has been lower than what was originally predicted. The difference was probably caused by the fact that modelers did not take into account the response of the air indus-try, especially PA, to the opening of HSR services, which involved reducing prices and maintaining frequency with smaller planes.
PA and HSR are presently engaged in a strong fight to get the lion’s share in the corridor. HSR is more comfortable for users because they do not have to go through security checkpoints and can make better use of their time inside the train. Moreover, HSR stations are on average more accessible for users than are airports, particularly for those users who take public transportation to get to or
0 100 200 300 400 500 600
WTP_Frequency; Cl = [7.90 , 12.16]
Frequency
WTP WTP_Parking; Cl = [10.50 , 16.17]
WTP_Check in; Cl = [17.38 , 26.76]
6
7.65 9.3 10.95 12.6 14.25 15.9 17.55 19.2 20.85 22.5 24.15 25.8 27.45 29.1 30.75 32.4 34.05 35.7 37.35 39