Simulation Study of the Effect of Decreasing Truck Traffic
Flow on Safety on Almeria-Barcelona Corridor
Bahar Dadashova
Associate Transportation Researcher, Transportation Institute (TTI), Texas A&M University, USA
Blanca Arenas-Ramírez
Head, Transport Studies and Vehicles Environmental Impact Unit of University Institute of Automobile Research (INSIA), Technical University of Madrid, Spain
Camino González-Fernández
Associate Professor, Statistics Laboratory, Technical University of Madrid, Spain
Francisco Aparicio-Izquierdo
Emeritus Professor, President of Institute of Automobile Research (INSIA), Technical University of Madrid, Spain
ABSTRACT
In this paper the effect of truck traffic on road safety has been analyzed through simulation study. The main objective of the study is to quantify the effect of the decreasing average annual daily traffic of heavy duty vehicles (trucks) on road safety. As the road safety indicators the frequency road accidents is considered. The data used in the study were collected from one of the most crowded routes in Spain which connects Almeria (south-east) with Barcelona (north(south-east). The observed data covers year 2010 and were classified into 2 road types: dual carriageways and toll roads. The estimation was carried out using negative binomial model and Markov Chain Monte Carlo simulation. Using the estimation results new traffic scenarios were proposed where the traffic flow is assumed to change its values. A total of 33 scenarios were proposed and new accidents data were generated through MCMC sampling. The comparison of the simulated and observed accident data shows that the effect of decreasing truck traffic flow could meliorate road safety in the route. The simulation tool could be applied to evaluate the effects of freight modal shift from road to rail.
1. INTRODUCTION
In the year 2010, the 82.48% of the global total of domestic ton-km in Spain, were moved by road while the rail modal shift was 2.4%. In 2012, the rail share was 4% in compared to EU average of 17% (Eurostat, 2012), confirming the supremacy of road transport in goods transportation. The future development of the EU transport system consists of the goals of achieving a 50% shift in middle distance passenger and longer distance freight journeys from road to other modes by 2020, as well as achieving a 60% reduction in CO2 emissions
and significant reduction in oil dependency of this sector as efficiency enhancement indicator (European Commission, 2001, 2011).
Transportation, 2010).
Empirical studies suggest that shifting away from road freight transport to different modes (e.g. railways, fluvial, maritime, etc.) can reduce the energy and emissions, as well as improve road safety (Ecola et al., 2009, Nealer et al., 2012).
The main objective of this work is to determine how partially removing the trucks from the total traffic through proposed traffic scenarios might affect the road safety and try to quantify this hypothetical impact through a statistical methodology based on the Markov Chain Monte Carlo (MCMC) simulation.
The road accident data were collected from the previously mentioned heavy freight route and covers the year 2010. The observed data on road safety indicator was first estimated as the function of different independent factors using a negative binomial model where a priori non informative distributions were assigned to parameters. Then using the results of the empirical studies, new accident data were simulated through different scenarios and their effect on safety was evaluated.
The paper is organized as follows: In section 2 the data are analysed, in section 3 the models estimation through Negative Binomial Regression is carried out. Section 4 introduces the simulation of scenarios and provides the results. The main conclusions are presented in section 5.
2. DATA DESCRIPTION
Observed data were collected from 95 road sections in Barcelona-Almeria route. Each road segment was classified as either dual carriageway (A) or toll roads (P). The characteristics of road segments are described in Table 1. The total length of the route is 714.36 km, where 56% of its amount are classified as dual carriageway, A while the remaining 44% are toll roads, P.
Table 1 – Road section classification.
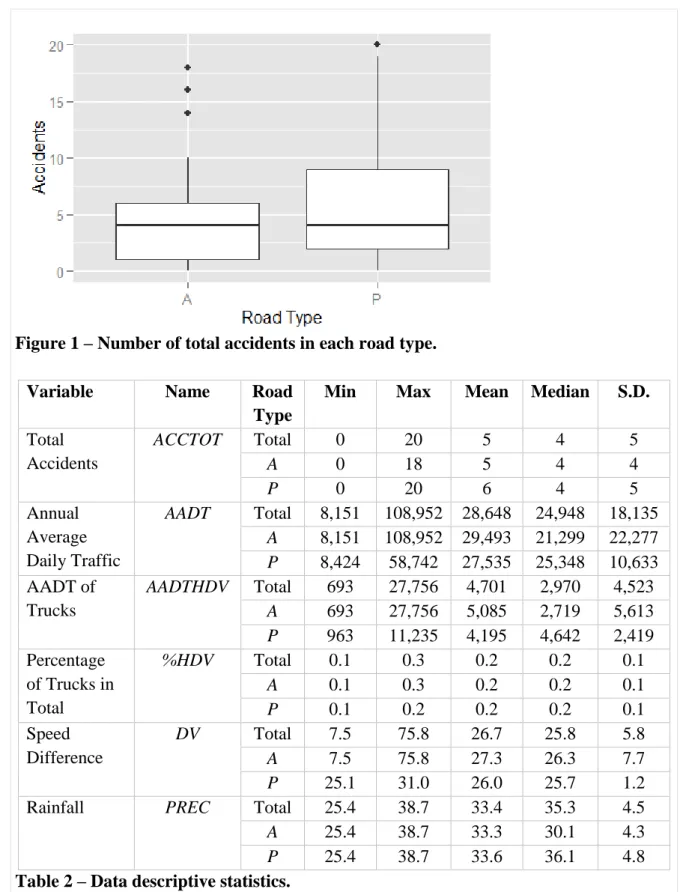
Road safety is measured through total accidents number ACCTOT in 2010. Count-data variable ACCTOT is the sum of accidents that took place in both directions. Box plot of the indicator as the function of road types is described in Figure 1. Maximum number of accidents as well the mean (accident number per segments type) are reached in toll roads. (See Table 2). Number of road accidents is studied as the function of traffic volume, a measure of exposure, speed and weather condition. The descriptive statistics of all the variables are presented in Table 2.
Road Type Segments Length
No. % (km)
Total 95 100 714.36
Dual carriageway (A) 57 60 307.72
Figure 1 – Number of total accidents in each road type.
Variable Name Road
Type
Min Max Mean Median S.D.
Total Accidents
ACCTOT Total 0 20 5 4 5
A 0 18 5 4 4
P 0 20 6 4 5
Annual Average Daily Traffic
AADT Total 8,151 108,952 28,648 24,948 18,135
A 8,151 108,952 29,493 21,299 22,277
P 8,424 58,742 27,535 25,348 10,633
AADT of Trucks
AADTHDV Total 693 27,756 4,701 2,970 4,523
A 693 27,756 5,085 2,719 5,613
P 963 11,235 4,195 4,642 2,419
Percentage of Trucks in Total
%HDV Total 0.1 0.3 0.2 0.2 0.1
A 0.1 0.3 0.2 0.2 0.1
P 0.1 0.2 0.2 0.2 0.1
Speed Difference
DV Total 7.5 75.8 26.7 25.8 5.8
A 7.5 75.8 27.3 26.3 7.7
P 25.1 31.0 26.0 25.7 1.2
Rainfall PREC Total 25.4 38.7 33.4 35.3 4.5
A 25.4 38.7 33.3 30.1 4.3
P 25.4 38.7 33.6 36.1 4.8
Table 2 – Data descriptive statistics.
2.1 Road Accident Predictors
average AADTHDV constitute 15% of the total AADT. The highest average flow of trucks (25%) is observed in dual carriageway, although it is not significantly different than the average percentage of trucks in toll roads (24%).
The relationship between the traffic flow and the accident rate has been analysed in several studies. Under the influence of different factors this relationship can be both linear and U-shaped (Wang et al., 2013; Martin, 2002; Garber and Subramanyan, 2001), e.g. under free traffic flow conditions (Ceder and Livneh, 1982). Lord et al. (2005) observe that although there is a positive relationship between traffic flow and accident occurrence however the accidents seem to increase at a decreasing rate as the traffic flow increases. The overall results of these studies show that the total number of accidents increases as traffic flow increases.
As the exposure variable the length of the road segment, LONG, is considered. The effect of road segment length on the accident frequency has been analysed mainly through exploratory data analysis (Thomas, 1996; Anastasopoulos and Mannering, 2009). The studies determined that the accident count observed on a road segment increases with the length of the segment. The length of the road segments in the route varies between 0.55 and 25.87 km, where the longest road segments belong to toll roads.
Speed is considered to be one of the main factors affecting the road safety. It has been stated that there is an increasing relationship between the higher speed and severity of the accidents (Chen et al., 2000; Yu et al., 2014; Dadashova et al., 2014). Almost 22% of the accident related fatalities have been estimated to be caused by inadequate speed (Chen et al., 2000) as it was observed in fatal accidents in Spain during year. In this study we have been interested in the difference between the average speed of passenger cars and the heavy vehicles, DV. Depending on the road type the minimum amount of the difference of speed risen by this two categories of vehicles types, ranges between 7.5 and 75.8 km per hour in dual carriageway type. The mean value of DV are next in the two road type. In the route the minimum speed difference value is 7.5 in A and 25.1 km/h in P type, while the maximum DV is observed to be 75.8 and 31 km/h in A and P respectively.
Among the factors affecting the crashes and the severity level of the accidents there are also weather conditions. Rainfall is associated with increasing accident risk especially in case of fatal accidents (Fridstrøm, 1995; Dadashova et al., 2014). The weather conditions are represented by the amount of rainfall, PREC, which fluctuates between 25.42 and 38.74 mm with the average value of 33.43 mm.
3. MODEL ESTIMATION
3.1 Negative Binomial Model Estimation
𝑛 =365 ∙ 𝐿𝑂𝑁𝐺 ∙ 𝐴𝐴𝐷𝑇 106
(1)
Statistical model estimation was carried out through MCMC sampling where the model parameters were assigned a non-informative priors. Regression coefficient parameters, 𝛽𝑘
were assigned a multivariate normal distribution with 𝑁(0, 𝜎2). Dispersion parameter 𝛼
was assigned a non-informative gamma prior,Γ(a, b) where a and b are hyperparameters. The model estimation was carried out using WinBUGS software. As the goodness of fit measures deviance information criteria (DIC) and 𝑅2 were used. Model estimation results are presented in Table 3. Parameter estimates are presented with their 95% credibility intervals, which is not to be confused with confidence intervals.
Parameters Mean S.D. 2.5% Median 97.5%
log(AADT) 0.46 0.14 0.18 0.48 0. 67
log(DV) 0.81 0.40 0.03 0.84 1.4
log(PREC) 0.02 0.36 -0.49 -0.05 0.9
Road type:
A 0.42 1.52 -1.59 0.00 3.64
P 0.70 0.96 -1.50 0.28 1.94
log(%HDV)
A 0.30 0.24 -0.09 0.27 0.82
P 0.21 0.51 -1.11 0.16 1.6
log(𝛼) 1.43 0.37 0.83 1.39 2.3
DIC 414
𝑅2 0.96
Table 3 – NB model parameter estimates with 95% probability interval.
The NB model fitted to the data has the following form:
𝑌𝐴 = (𝐴)0.42(𝐴𝐴𝐷𝑇)0.46(%𝐻𝐷𝑉)0.30(𝐷𝑉)0.81(𝑃𝑅𝐸𝐶)0.02(𝐿𝑂𝑁𝐺)1 (2)
𝑌𝑃 = (𝑃)0.70(𝐴𝐴𝐷𝑇)0.46(%𝐻𝐷𝑉)0.21(𝐷𝑉)0.81(𝑃𝑅𝐸𝐶)0.02(𝐿𝑂𝑁𝐺)1 (3)
The estimation results indicate that the effect of both AADT and %HDV on accident count are increasing in both road types. As well as the effect of speed difference and the precipitation are estimated to be negative on road accident occurrence.
3.2 Cross-Validation
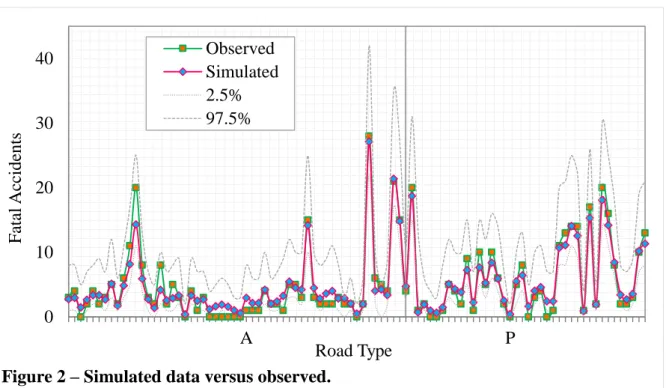
Figure 2 – Simulated data versus observed.
The prediction accuracy of the model was computed using mean absolute error (MAE) and mean squared error (MSE):
𝑀𝐴𝐸 =1
𝑛∑|𝑌̂𝑡− 𝑌𝑡| 𝑛
𝑡=1
(4)
𝑀𝑆𝐸 = 1
𝑛∑(𝑌̂𝑡− 𝑌𝑡) 2 𝑛
𝑡=1
(5)
The accuracy measures are estimated to be 1.03% and 1.85% for MAE and MSE respectively, showing that the simulated data was able replicate more than 98% of the observed data.
4. TRAFFIC SCENARIO: SIMULATIONS AND RESULTS
This study is essentially focused on how decreasing the road freight transport flow might affect the road safety. For this purpose new traffic scenarios are proposed and the accident data were simulated using the estimation results presented in the previous section. In order to estimate the effect of the changing traffic on the road safety indicators, the results of the simulation are compared with the observed data.
4.1 Description of Traffic Scenarios
Traffic scenarios were constructed by considering the reductions in truck traffic flow and total traffic flow as described below:
I. 5% decrease in truck traffic flow (AADTHDV; 5%) a. No change in total traffic flow (0%) (𝐼0)
b. Gradual increase in total traffic flow from 1% to 10% (𝐼10)
II. 10% decrease in truck traffic flow (AADTHDV; 10%) a. No change in total traffic flow (0%) (𝐼𝐼0)
b. Gradual increase in total traffic flow from 1% to 10% (𝐼𝐼10)
0 10 20 30 40
A P
F
atal
Ac
cidents
Road Type Observed
III. 15% decrease in truck traffic flow (AADTHDV; 15%) a. No change in total traffic flow (0%) (𝐼𝐼𝐼0)
b. Gradual increase in total traffic flow from 1% to 10% (𝐼𝐼𝐼10)
As a result a total of 33 scenarios were suggested.
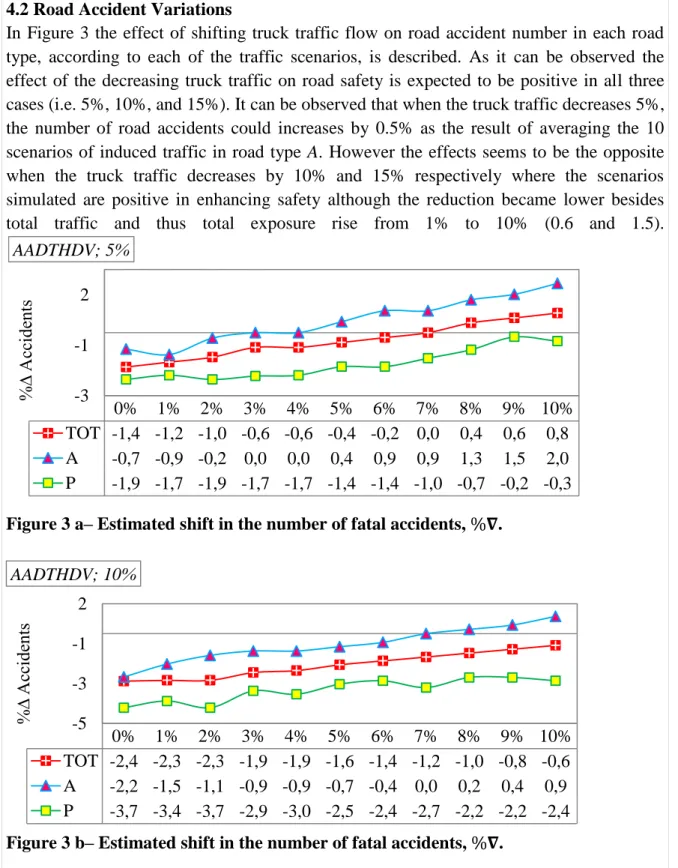
4.2 Road Accident Variations
In Figure 3 the effect of shifting truck traffic flow on road accident number in each road type, according to each of the traffic scenarios, is described. As it can be observed the effect of the decreasing truck traffic on road safety is expected to be positive in all three cases (i.e. 5%, 10%, and 15%). It can be observed that when the truck traffic decreases 5%, the number of road accidents could increases by 0.5% as the result of averaging the 10 scenarios of induced traffic in road type A. However the effects seems to be the opposite when the truck traffic decreases by 10% and 15% respectively where the scenarios simulated are positive in enhancing safety although the reduction became lower besides total traffic and thus total exposure rise from 1% to 10% (0.6 and 1.5).
Figure 3 a– Estimated shift in the number of fatal accidents, %𝛁.
Figure 3 b– Estimated shift in the number of fatal accidents, %𝛁.
The effect of decreasing truck volume on accident occurrence on toll roads (P) however is observed to be positive in all the scenarios simulated. The average percentage variations
0% 1% 2% 3% 4% 5% 6% 7% 8% 9% 10%
TOT -1,4 -1,2 -1,0 -0,6 -0,6 -0,4 -0,2 0,0 0,4 0,6 0,8
A -0,7 -0,9 -0,2 0,0 0,0 0,4 0,9 0,9 1,3 1,5 2,0
P -1,9 -1,7 -1,9 -1,7 -1,7 -1,4 -1,4 -1,0 -0,7 -0,2 -0,3
-3 -1 2
%
∆
Ac
cidents
AADTHDV; 5%
0% 1% 2% 3% 4% 5% 6% 7% 8% 9% 10%
TOT -2,4 -2,3 -2,3 -1,9 -1,9 -1,6 -1,4 -1,2 -1,0 -0,8 -0,6
A -2,2 -1,5 -1,1 -0,9 -0,9 -0,7 -0,4 0,0 0,2 0,4 0,9
P -3,7 -3,4 -3,7 -2,9 -3,0 -2,5 -2,4 -2,7 -2,2 -2,2 -2,4
-5 -3 -1 2
%
∆
Ac
cidents
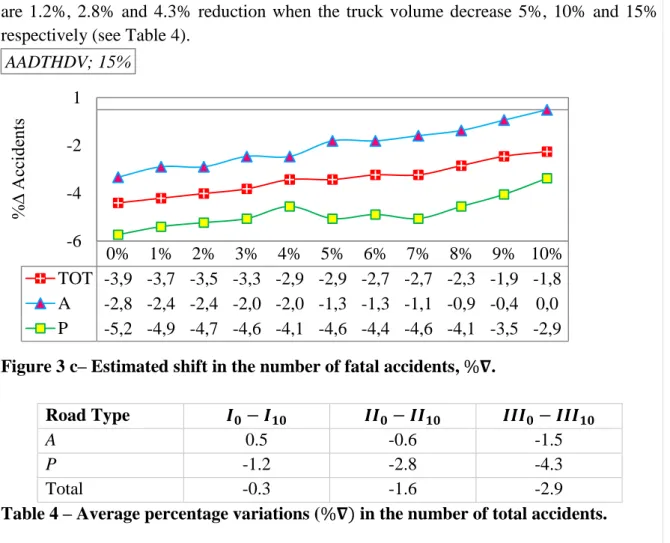
are 1.2%, 2.8% and 4.3% reduction when the truck volume decrease 5%, 10% and 15% respectively (see Table 4).
Figure 3 c– Estimated shift in the number of fatal accidents, %𝛁.
Road Type 𝑰𝟎− 𝑰𝟏𝟎 𝑰𝑰𝟎− 𝑰𝑰𝟏𝟎 𝑰𝑰𝑰𝟎− 𝑰𝑰𝑰𝟏𝟎
A 0.5 -0.6 -1.5
P -1.2 -2.8 -4.3
Total -0.3 -1.6 -2.9
Table 4 – Average percentage variations (%𝛁) in the number of total accidents.
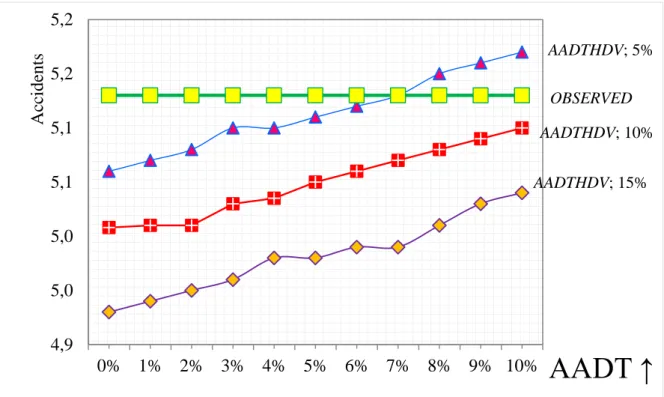
Globally the decreasing truck traffic scenarios are essentially positive on reducing accident occurrence. For three scenarios of truck traffic decrease the corresponding reductions are 0.3%, 1.6% and 2.9% in total. These reductions are linearly correlated with the increasing traffic volume as it can be observed in Figure 4. As the total traffic volume increases, an increment of the accident count can be expected.
0% 1% 2% 3% 4% 5% 6% 7% 8% 9% 10%
TOT -3,9 -3,7 -3,5 -3,3 -2,9 -2,9 -2,7 -2,7 -2,3 -1,9 -1,8
A -2,8 -2,4 -2,4 -2,0 -2,0 -1,3 -1,3 -1,1 -0,9 -0,4 0,0
P -5,2 -4,9 -4,7 -4,6 -4,1 -4,6 -4,4 -4,6 -4,1 -3,5 -2,9
-6 -4 -2 1
%
∆
Ac
cidents
Figure 4 – Evolution of road accident numbers following the gradual shifts in AADT when AADTHDV decreases.
5. CONCLUSIONS
The article studies the effect of the shifting truck traffic flow on road safety in Barcelona-Almeria route in Spain. The main reason behind this study, is the increasing motivations by the safety concerned as well as environmental organizations directed at the trade-off between road freight transport and railways with the purpose of decreasing accident rate, energy and emissions generated by transport sector. This study tries to analyse how the removal of trucks from total traffic flow, hypothetically would affect the road safety indicators.
It is a quite straightforward the fact that removing the freight transport vehicles from roads, will have an impact on the remaining traffic flow. Therefore, considering the simultaneous effect of both truck traffic and total traffic are important factors to consider in order to carry out the simulation study. Removing the freight transport vehicles from the traffic steam, and varying simultaneously the number of total vehicles in one road section, seem to have a positive impact in improving road safety. This possible improvement is particularly relevant in case of toll roads. The effect in dual carriageways is dependent of the level of truck average traffic reduction: these road segments could be contributors to safety in the 15% AADTHDV reduction, as far the simulated scenarios shows.
This outcome is especially important, given that Spain is in a recovering economy process and this actual favourable conditions can increase the demand for heavy goods vehicles in both high capacity road types. Thus, taking preventive measures having road type performance into account, will be the desirable action as far as the future improvement of road safety is concerned. The results of the simulation study provide us with very
AADTHDV; 5%
OBSERVED
AADTHDV; 10%
4,9 5,0 5,0 5,1 5,1 5,2 5,2
0% 1% 2% 3% 4% 5% 6% 7% 8% 9% 10%
Ac
cidents
AADT ↑
important outcomes for the future decision making concerning the road safety policies, as well to address freight modal shift from road to rail, specially focused on routes, where the railway is an alternative mode as it is the case.
ACKNOLEDGEMENTS
This work has been carried out in the framework of the MODALTRAM - TRA2011-28647-C02-01 Research Project "Development of an integrated methodology for the assessment of effects on Safety and Environment, for the road and rail modal shift", of the Spanish National Research Plan 2011-2014, Ministry of Economy and Competitiveness (MINECO). The authors would also like to thanks the Community of Madrid, that contributed to this work through the SEGVAUTO-TRIES-CM (S2013-MIT2713) Programme.
REFERENCES
ANASTASOPOULOS, P. C., AND MANNERING, F. L. (2009). A note on modeling vehicle accident frequencies with random-parameters count models. Accident Analysis & Prevention 41(1), pp. 153-159.
ANDREESCU, M. P., AND FROST, D. B. (1998).Weather and traffic accidents in Montreal, Canada. Climate Research 9(3), pp. 225-230.
ARENAS-RAMIREZ, B., APARICIO-IZQUIERDO. F., GONZALEZ-FERNANDEZ. C., AND GOMEZ-MENDEZ A. (2009). The influence of heavy goods vehicle traffic on accidents on different types of Spanish interurban roads. Accident Analysis & Prevention 41(1), 15-24.
CEDER, A., AND LIVNEH, M. (1982). Relationships between road accidents and hourly traffic flow: analyses and interpretation. Accident Analysis & Prevention 14(1), pp. 19-34.
CHEN, G., WILSON, R.J., MECKLE, W. AND COOPER, P. (2000). Evaluation of photo radar program in British Columbia. Accident Analysis & Prevention 32(4), pp. 517 - 526.
DADASHOVA, B., ARENAS, B., MIRA, J. M., AND APARICIO, F. (2014). Explanatory and prediction power of two macro models. An application to van-involved accidents in Spain. Transport Policy 32, pp. 203-217.
ECOLA, L., HASSELL, S., TOMAN, M., AND WACHS, M. (2009). Infrastructure, Safety and Environment. Integrating US Climate, Energy, and Transportation Policies. RAND Corporation.
EUROPEAN COMMISSION (2001). White Paper: European transport policy for 2010.
FRIDSTRØM, L., IFVER, J., INGEBRIGTSEN, S., KULMALA, R., AND THOMSEN, L. K. (1995). Measuring the contribution of randomness, exposure, weather, and daylight to the variation in road accident counts. Accident Analysis & Prevention 27(1), 1 -20.
GARBER, N.J., and SUBRAMANYAN, S., (2001). Incorporating crash risk in selecting congestion-mitigation strategies. Transportation Research Record 1746, pp. 15.
LORD, D., MANAR, A., AND VIZIOLI, A. (2005). Modeling crash-ow-density and crash-ow-V/C ratio relationships for rural and urban freeway segments. Accident Analysis & Prevention 37(1), pp. 185-199.
MARTIN, J.-L. (2002). Relationship between crash rate and hourly traffic flow on interurban motorways. Accident Analysis & Prevention 34, pp. 619-629.
NEALER, R., MATTHEWS, H.S., AND HENDRICKSON, C. (2012). Assessing the energy and greenhouse gas emissions mitigation effectiveness of potential US modal freight policies. Transportation Research Part A: Police and Practice, 4683, 588-601.
SPANISH MINISTRY OF TRANSPORTATION. Ministerio de Fomento (MFOM). (2010). Plan estratégico para el Impulso del Transporte Ferroviario de Mercancías en España .
THOMAS, I. (1996). Spatial data aggregation: exploratory analysis of road accidents. Accident Analysis & Prevention 28(2), pp. 251 - 264.
WANG, C., QUDDUS, M. A., AND ISON, S. G. (2013). The effect of traffic and road characteristics on road safety: A review and future research direction. Safety Science 57, pp. 264 – 275.