Instituto Tecnológico de Costa Rica
Área Académica de Ingeniería MecatrónicaYork University
Sustainable Energy Initiative-Proyecto Las Nubes
Design of Monitoring System for Photovoltaics Performance
Verification Plant in Project Las Nubes
Project for obtaining the degree: Licentiate in Mechatronics Engineering
Hugo Andrés Sánchez Ortiz ID Student: 201054402
Supervisors
Carlos Meza Benavidez, Ph.D. TEC, Costa Rica
José Etcheverry, Ph.D. York University, Toronto, Canada
Resumen (Spanish)
El presente informe describe el proceso de diseño de un sistema de monitoreo para una Planta
de Verificación Fotovoltaica que pretende ser implementada en el Proyecto Las Nubes,
proyecto desarrollado por el autor de esta tesis con la ayuda de Sustainable Energy Initiative
(Iniciativa de Energía Sostenible) y el proyecto Las Nubes, que operan bajo la coordinación
de la Facultad de Estudios Ambientales de la Universidad de York, en Toronto Canadá. La
zona tropical cuenta con excelentes condiciones para la utilización de la energía solar
fotovoltaica. Sin embargo, toda la información técnica dada por los fabricantes es obtenida
bajo pruebas de laboratorio, bajo condiciones ideales. El verdadero comportamiento de un
módulo fotovoltaico puede diferir mucho de este comportamiento previsto, y para El Trópico,
se desconoce dicho comportamiento. Esta información es de mucha utilidad al usuario final
para poder estimar el tiempo de retorno de la inversión para los distintos módulos
fotovoltaicos. Por esta razón, fue desarrollado un sistema de monitoreo que será
implementado en esta clase de estudios, de acuerdo a lo establecido por las normas IEC
61724 y IEC 61853. El sistema permite recolectar información sobre la salida de potencia
del módulo fotovoltaico y envía la información a un equipo de cómputo, para realizar análisis
más detallado.
El entregable final es un prototipo funcional que servirá para realizar futuros estudios. Y en
un trabajo adicional se diseñó una estructura de montaje para la Planta de Verificación
Fotovoltaica.
Abstract
The present report describes the design of a monitoring system for the Photovoltaics
Performance Verification that will implemented in Project Las Nubes, developed by the
author of this thesis within the Sustainable Energy Initiative and Project Las Nubes inside
the Faculty of Environmental Studies of York University based in Toronto, Canada. Tropical
zone has a good conditions for the implementation of photovoltaic energy. However, all the
information provided by the manufacturer is obtained under ideals conditions. But the final
energy yield of a photovoltaic module has a different behavior under real conditions and the
actual performance of photovoltaic cells is unknown at tropical latitudes. This information
really meets the requirements of the end user who wants to estimate the pay‐back time of his
investment for different module types. For this reason was development a monitoring system
that will be implemented in this kind of studies following the standards IEC 61724 and IEC
61853. The hardware can collect the information of the output power and the environmental
conditions of the PV module and send the information to the computer for future analysis.
The final deliverable is a testing model that is going to be used for further studies. An
additional work will be developed designing and a preliminary mounting structure for the
Performance Verification Plant.
Dedication
To Marcelino Sánchez Tencio and María de la Cruz Ortiz Castillo, the first engineers that I
knew, who planning, designed and implemented a great project, our family.
To Pablo and Randall, I hope always be a good example for you. I also expect great things from you. Dream, the limit is not in the sky
//
A Marcelino Sánchez Tencio y María de la Cruz Ortiz Castillo, los primeros ingenieros que
he conocido. Quienes planearon, diseñaron e implementan un grandioso proyecto, nuestra
familia.
A Pablo y Randall, espero siempre servirles de ejemplo. Espero también grandes cosas de
Acknowledgments
I do not have words for all the help that you provided me and this invaluable opportunity that
you give me. My sincere thanks to Dr. Jose Etcheverry, PhD, and Dr. Felipe Montoya, PhD,
from York University, for seeing and being guides for me during my stay in Canada. Thanks
Eng. Marco Anderson for all the support from Tecnológico de Costa Rica.
Thanks to all my friends, who were my right hand in this years in the university and always
will be. For all the study´s nights, and not study nights. Always I take you in my heart.
Thanks to all my family, who always believe in my work and always have a motivation words
to propel me to go ahead.
Thanks to all my mates of AEMTEC, DATIC and TEC Team, work teams that were my
second university and where always I could find affection. It was my pleasure to work with
you.
Thanks to Physicist Ana Segura to be a confident and tutor in all the years of the university.
For always giving me a wise advice. And always dwell me a friendly hand.
Thanks to my friends in Canada Mark, Gil and Bastian for all the feedback in the present
work. And especially thanks to Jorge, Ann and Natalia for all the support and make this
experience better.
Thanks to Eng. Carlos Meza Benavides, PhD; for help me like tutor in the development of
this project. And Eng. Sergio Morales and Eng. Javier Perez, who were the reviewers of the
present job.
GENERAL INDEX
Thesis Comitee Members ... i
Declaration of Authenticity ... ii
Resumen (Spanish) ...iii
Abstract ... iv
Dedication ... v
Acknowledgments ... vi
Chapter 1 Introduction ... 1
1.1. Context of the project ... 1
1.2. Problem Synthesis ... 4
1.3. Solution Approach... 4
1.4. Objectives ... 6
1.4.1. General Objective ... 6
1.4.2. Specific Objectives ... 6
Chapter 2 Literature Review ... 7
2.1 General Aspects about Solar Photovoltaic Energy ... 7
2.1.1 Photovoltaics Fundaments ... 7
2.1.2 Solar Cells Parameters ... 9
2.1.3 External variables involved in PV generation ... 12
2.2 Performance Measures for Photovoltaics Modules ... 16
2.2.1 Standard Test Conditions (STC) ... 16
2.2.2 Normal Operation Cell Temperature (NOCT) Test ... 17
2.2.3 Outdoor evaluated performance parameters ... 19
2.2.4 Photovoltaic Performance Verification Program (PVPV) ... 21
2.3 Conclusions ... 23
Chapter 3 Requirements ... 24
3.1 General characterization of the requirements ... 24
3.2 Monitoring system... 26
3.2.1 Functional requirements ... 26
3.2.2 Non-functional requirements ... 27
3.3 Mounting structure ... 28
3.3.1 Functional requirements ... 28
Chapter 4 Design ... 29
4.1 General description: Monitoring System ... 29
4.1.1 Data Transmission ... 30
4.1.2 Data Storage ... 30
4.2 Electronic Equipment selection ... 31
4.2.1 Controller ... 31
4.2.2 Current Sensor ... 32
4.2.3 Voltage Sensor ... 34
4.2.4 Module Temperature Sensor ... 35
4.2.5 Environmental conditions sensor ... 37
4.2.6 Communications modules ... 41
4.2.7 Data Back Up System ... 42
4.3 Signal Conditioning and Calibration ... 44
4.3.1 Current Sensor ... 44
4.3.2 Voltage Sensor ... 46
4.3.3 Temperature Sensor ... 48
4.3.4 Pyranometer ... 50
4.4 Overall Electronic Circuit ... 52
4.5 Power Supply ... 55
4.6 Programming ... 56
4.6.1 Microcontroller ... 56
4.6.2 CPU ... 58
4.7 Mounting Structure ... 60
4.3.1 Solar Assessment ... 60
4.3.2 Load considerations and stress verification ... 65
Chapter 5 Assembly and Testing ... 71
5.1 Methodology ... 71
5.2 Testing process ... 72
5.2.1 Laboratory Test ... 72
5.2.2 Field Test ... 75
5.3 Results ... 77
Chapter 6 Recommendations and conclusions. ... 81
6.2 Conclusions ... 82
List of References ... 83
A. Appendixes ... a
A-1 Glossary ... a
A-2 RF Link Budget ... c
A-3 Configuration of RF Modules. ... e
A-3 Tables sources of Figure 4-25 & Figure 4-26 ... f
A-4 Alternative representation of Sun Path ... g
A-5. Solar Gis analysis for the location of the field test in York University. ... h
A-6. Project Drawings ... i
A-7. Cost of the project ... n
B. Annexes ... p
B.1 Components Datasheets ... p
B.1.1 Schematics of Arduino Mega ... p
B.1.2 ASC712 Datasheet (Relevant Information) ... q
B.1.3 Vishay Foil Resistors Datasheet (Relevant Information) ... r
B.1.4 Amplifier AD595 Datasheet (Relevant Information) ... s
B.1.5 Pyranometer Datasheet (Relevant Information) ... t
B.1.6 Meteorological Station (Relevant Information) ... u
FIGURES INDEX
Figure 1-1. The global installed photovoltaic capacity [2]... 1
Figure 1-2 Location of Project Las Nubes [9] ... 2
Figure 1-3 Iterative method in concurrent design ... 4
Figure 1-4. Overview of the solution ... 5
Figure 2-1. Solar cell model [14] ... 7
Figure 2-2 PV Technologies ... 8
Figure 2-3 A PV module general anatomy [16] ... 9
Figure 2-4 Characteristic Curve PV cell [21] ... 11
Figure 2-5. Conversion Efficiency in different PV technologies [22] ... 12
Figure 2-6 Spectral Response of the silicon solar cell before and after irradiation [24] ... 13
Figure 2-7 Spi-Sun Simulator Photovoltaic Module Testing [30] ... 17
Figure 2-8. Comparison between STC and NOTC PV module Performance [32] ... 18
Figure 2-9 Installation of PVPV at Kortright Center. ... 22
Figure 4-1 General Diagram of Solution ... 29
Figure 4-2 Ping mapping and dimensions for Arduino Mega 2560 Board [40] ... 32
Figure 4-3 Pin out diagram ACS 712 [42] ... 34
Figure 4-4. Temperature sensor location at PV module [39] ... 36
Figure 4-5 Schematic Diagram PT 01 ... 37
Figure 4-6 Pyranometer SP-214 Apogee Instruments [46] ... 38
Figure 4-7.Sensor DHT 22, general view and specifications [48] ... 40
Figure 4-8 Dimensions of APC 220-43 RF Module [49] ... 42
Figure 4-9 SD Card Slot Reading-Writing Modules [51] ... 43
Figure 4-10. Noise vs External Filter Capacitance ASC712 [42] ... 44
Figure 4-11 Current sensor, electrical configuration ... 45
Figure 4-12 Current Sensor Calibration ... 46
Figure 4-13 Voltage Sensor, electrical configuration ... 47
Figure 4-14. Voltage Sensor Calibration ... 48
Figure 4-15.Required amplification for thermocouple TP-01. ... 49
Figure 4-16 Functional Block Diagram ADS594 [53] ... 49
Figure 4-17Thermocouple and amplifier AD595, Electrical configuration ... 50
Figure 4-18 Pyranometer, electrical configuration ... 51
Figure 4-19. Block Diagram System ... 52
Figure 4-21Flow chart diagram for the microcontroller ... 56
Figure 4-22 Flow chart for the computer program. ... 58
Figure 4-23 Location PV Performance Verification Plant, obtained by SolarGIS ... 61
Figure 4-24 Global Horizontal Irradiation and air temperature estimated by SolarGIS ... 62
Figure 4-25 Global in plane irradiation estimated by SolarGIS ... 62
Figure 4-26. Tilt angle for PV panel [57]. ... 63
Figure 4-27. Sun Path Chart for the location of the project ... 64
Figure 4-28. Direct Radiation around the year with a tilt angle of 10°. ... 65
Figure 4-29 General View of the Structure ... 66
Figure 4-30 Finite Element Analysis for XR100 Rail ... 67
Figure 4-31 Finite Element Analysis for Rail Connector ... 68
Figure 4-32Finite Element Analysis for 3" Schedule 40 Pipe. ... 68
Figure 4-33. Finite Element Analysis in foundation ... 69
Figure 4-34 Final View ... 70
Figure 5-1. Breadboard connections for test the prototype ... 71
Figure 5-2 Final testing prototype ... 72
Figure 5-3. Laboratory Test ... 73
Figure 5-4. Field test location ... 75
Figure 5-5 Sky Image Capture Sun Eye 210 ... 76
Figure 5-6 Solar Access in Field Test ... 76
Figure 5-7. Outdoor Performance Verification with two solar panels DAY448MC ... 77
Figure 5-8 Correlation between panel temperature, environment and radiation. May 16th, 2015 ... 78
Figure 5-9 Output power and irradiation, May 16th, 2015. ... 78
Figure 5-10 Energy Yield. ... 79
TABLES INDEX
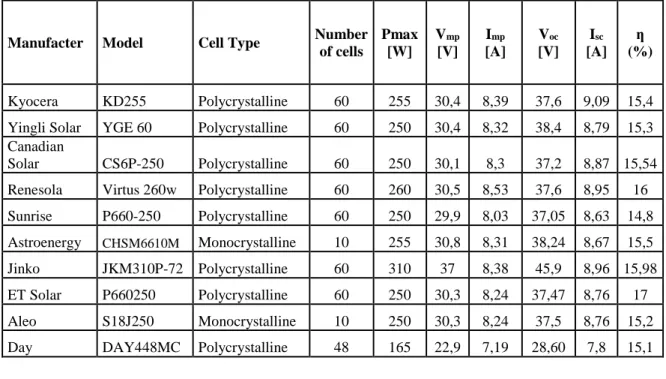
Table 3-1 Electrical parameters at SCT for PV modules available in Costa Rica ... 25
Table 3-2 Electrical parameters at NOCT for PV modules available in Costa Rica ... 25
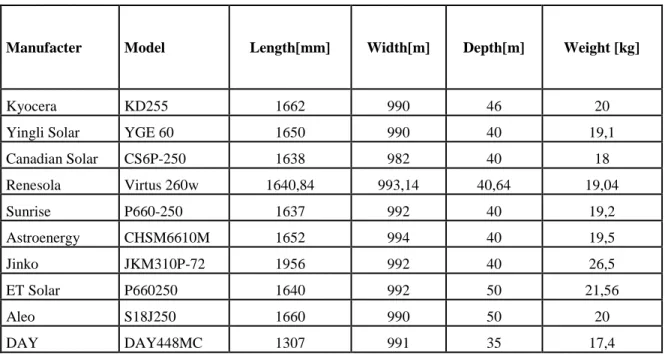
Table 3-3 Mechanical parameters for PV modules available in Costa Rica ... 26
Table 4-1 Principal feature of Arduino Mega 2560 Board [40] ... 31
Table 4-2 Main features of chip ACS712ELCRT-20A-T. [42] ... 33
Table 4-3 Main features High Precision Foil Resistor [44] ... 35
Table 4-4 Main feature PT-01 type K [45]... 36
Table 4-5. Main features Pyranometer SP-212 of Apogee Instruments [46] ... 38
Table 4-6 Electrical connections in microcontroller ... 54
Table 4-7 Electrical consumption in the monitoring system ... 55
Table 4-8 Mechanicals properties of XR100 Rail [60] ... 67
Chapter 1
Introduction
This chapter aims to give a general overview of the project, its context, the problem and how
it is going to be addressed to the main objectives.
1.1.Context of the project
During the last years, the energy sector has been influenced by new trends in its search for
alternative solutions in generation sources. [1] This search tries to improve the environmental
impact generated by this activity. Solar energy is one of those energy sources has grown
exponentially in recent years, as it is shown in Figure 1-1. And this is the energy source that
this project will be focus, with emphasis in photovoltaics energy.
Figure 1-1. The global installed photovoltaic capacity [2]
Costa Rica is not an exception in this upward growth. The most recent estimation, as a result
of the "Plan Piloto de Generación Distribuida ICE", indicates the capacity in Costa Rica
approaches to 11 MW [3]. In the next few years, solar energy has a lot of opportunities for
further increase, but depends on the approval of regulations [4]. At present, the most
important regulation in process is POASEN. [5]. To do a more professional work in this area,
it is necessary to create methods for generating a reliable information about the real behavior
To determine the PV performance, it is necessary to complement the datasheet information
obtained with the statement of electrical performance under Standard Test Conditions (STC)
[6]. STC determining V-I curve and electrical output characteristics under the next
conditions, which will be explained in next section (Irradiance 1000 W/m2, Air Mass 1.5
global and operation temperature of 25°C). This test provides the information that is found
on the manufacturer datasheets. The main problem of these measurements is that none
provided real information about the real energy yield of a PV module, because the data is
obtained in simulation laboratories. In addition, a PV module has no-lineal characteristics
that depends, in no-lineal form, on environmental variables like temperature and irradiation.
These variables in real conditions are not constant, as they are in the STC tests. [7].
A real outdoor measurement meets the requirements of the end user and helps them to
estimate the payback time of this investment. Also, helps to know which technology has
potentially the highest energy yield (kW/Wp), based in standard IEC 61724 and IEC 61853,
and predicts for how many years the module will produce energy.
For these reasons, the Faculty of Environmental Studies of York University in Toronto
Canada, under the coordination of Sustainable Energy Initiative [8] and Project Las Nubes
[9] want to development a Photovoltaics Performance Verification Plant (PVPV) at the
location of conservation area Las Nubes, in Santa Elena de Peréz Zeledón, Costa Rica. The
location of the project is illustrated in figure 1-2.
This proposal is inspired at the PVPV development at Kortright Center of Conservation
located at Vaughan, Ontario Canada, a 12 km from the university [10] [11]. This project is
under the program of Sustainable Technologies Evaluation Program. Since 2012, PVPV
works, among many other functions, in characterizing the behavior of 20 PV modules, which
are available in the local market.
It is also important to mention that the literature has a lot of sources about this kind of the
PV Performance, but all the data are located in latitudes away from the Tropical
Zone(23°N-23°S) and thus from Costa Rica. Costa Rica is located in a special zone on the Earth, where
the Sun irradiation arrives perpendicular to the surface. In addition, Costa Rica has a very
high irradiation ranging from 1700 to 2100 W/m2/year and a lot of opportunities to harness
the solar resource. [12]
To collect this data some system of monitoring is necessary. For this reason York University
wants to development this system. There is no research background in the development of
this monitoring system at York University. And this is the main topic of the present thesis.
The project of this thesis took place in the Sustainable Energy Initiative, located in York
University, Toronto Canada. Under the supervision of Jose Etcheverry PhD and Felipe
Montoya Greenback PhD with the support of Lassonde School of Engineering located at the
1.2.Problem Synthesis
It is required to develop a monitoring system for the Performance Verification Photovoltaics
Plant in project Las Nubes.
1.3.Solution Approach
The solution is intended to be found with the use of concurrent design methodology [13].
Figure 1.2 illustrates this concept.
Figure 1-3 Iterative method in concurrent design
For the implementation, it is important to understand that the final product can always be
improved until it meets all the requirements and needs. In this case, the problem to solve does
not a preliminary background or prototype in the university, which involves developing the
methodology of the searching solution from the beginning.
According to the requirements that, will be analyzed in the next section, it is necessary to
solve little problems and then join all the parts into a general solution following the process
Figure 1-4. Overview of the solution
According to the last figure, some sub-systems to be designed are:
Data Collection: The basis of the PV outdoor measurements is the acquisition of data
appropriate for further processing. This process involves the selection of the sensor according
to the nature and need to be sensed value.
Data Pre-processing: Later data acquisition process is necessary to order the information
received and prepare that for the next stage. In this step, the most important point is the
operation of a microcontroller.
Sending Data: Since measurements are made outside, where very robust equipment cannot
be placed, it is recommend to send the information to a data center, where the information
can be process and stored.
Computer System: In this point, the solution need to tabulate the information. It is important
to process the information according to the standards and desired results.
Data Visualization: Finally, the visualization of the process data is the key to further assess
1.4.Objectives
1.4.1. General Objective
Design a monitoring system for Photovoltaics Performance Verification Plant, to be installed
in project Las Nubes, which can obtain the necessary parameters for the evaluation of PV
modules.
1.4.2. Specific Objectives
a) Design an electronic system for acquisition, processing and display data needed to
study the performance of solar panels deployed in a Photovoltaics Performance
Verification Plant.
b) Assembly the subsystem in a testing model, for field testing.
c) Design the mechanical structure for mounting the solar panels to be measured.
d) Formulate a methodology for the implementation of the system in a Photovoltaics
Chapter 2
Literature Review
This chapter aims to show all the theoretical implications of this project also it serves as a
starting point for the conception of the solution. The fundamentals of PV modules are
introduced with the objective to having a better understanding of the characterization process
and also, the state of art in outdoor measurements for a PV performance verification plant.
2.1General Aspects about Solar Photovoltaic Energy
Solar Photovoltaics Energy has a long history in the development of its technology, since the
discovery of the photoelectric effect by Alexandre Becquerel in 1839. For this project, it is
necessary to explore the basics of this technology, focused on solar cells and modules, which
are the main part of a PV system.
2.1.1 Photovoltaics Fundaments
Photovoltaics (PV) is the technology that generates direct current (DC), electrical power
measurement in Watts (W) from semiconductors when they are illuminated by photons [14].
Solar cells are formed by semiconductors materials which have typical characteristics in the
electron structure in the valence band. When the cell is excited by light, in this case from the
Sun, the energy exceeds a bandgap energy and some electrons are free to move to the
conduction band. In this process, the solar cells produce electricity [2]. Figure 2-1 illustrates
the solar cell model.
Solar cells are the basic units on PV systems. A set of solar cells connected is called a PV
module. A PV module is the best known component of the PV systems. The variety of
fabrication technologies is large and has different sizes and electrical values according to the
manufacturer strategy and the application required. However it is possible to join up the
technologies in three main groups. Each group is categorized according to the materials and
junction techniques applied. Also, each group can be located in a historic line based on the
time of onset. For more details about each technology, refer to [2] [14] [15]. Figure 2-2 shows
a general schematic of this classification.
Figure 2-2 PV Technologies
Nevertheless, it is possible to define a general anatomy for a PV module. The PV modules
are made by connecting numerous cells in series, parallel or series/parallel configuration [16].
A general description is a model of layers, where traditional started with the back sheet, there
is the general support of the structure. Later, the PV cell is covered by an encapsulated sheet.
And finally, all the layers are covered by a glass layer, which protect all the materials inside.
A good selection of these components is necessary to obtain a good performance of a PV
Figure 2-3 A PV module general anatomy [16]
2.1.2 Solar Cells Parameters
Solar cells have electrical parameters that allow to describe the performance of the cell
operation. Characterization between technologies can be different. [17] However, the
following characteristics can be found in all the manufacturer datasheets. It is necessary to
explain, the following mathematical expressions are obtained for the ideal model.
Short circuit current density (Jsc): The short circuit current (Isc) is the current flowing in the external circuit when the solar cell is a short circuited. This parameter depend of the area
of the solar cell. For this reason, is commonly used the term short circuit current density, in
order to remove the dependence of the area [2]. The short circuit current density depends on
the photon flux density incent in the solar cell. Also, the Short Circuit current density is
related with the optical properties of the solar cell like absorption and reflection process. Jsc
can be expressed in the equation (2-1):
𝐽𝑠𝑐= 𝑞𝐺(𝐿𝑛+ 𝐿𝑝)
Where G is the generation rate and Ln and Lp are the electron and hole diffusion lengths
respectively. For crystalline silicon solar cells under and AM1 1,5 spectrum a maximum
possible current above 42,7 mA/cm2 [18].
Open Circuit Voltage (Voc): The open voltage circuit is the voltage at no current flows through the external circuit. There is the maximum voltage that a solar cell can deliver. The
equation (2-2) describes the Voc and it can be found by setting the net current equal to zero:
𝑉𝑜𝑐 =𝑘𝑇 𝑒 ln(
𝐽𝑠𝑐 𝐽0 + 1)
(2-2)
This equation shows that Voc depends of the photo-generated current density and the light
generated current. The Voc for commercial silicon high performance cells exceeds the 700
mV under the standard of AM 1.5. [18]. But normally this value is around 600mV.
Fill factor (FF): This parameter indicates the maximum power of solar cells. There is the ratio between the maximum power from the solar cell and the product of the Open circuit
voltage and short circuit current density. Equation (2-3) illustrates this relationship:
𝐹𝐹 =𝐽𝑚𝑝𝑉𝑚𝑝 𝐽𝑠𝑐𝑉𝑜𝑐
(2-3)
It is necessary to observe that product JmpVmpis the maximum power of the solar cell (Pmax).
Figure 2-4 shows a typical electrical curve for PV panels. In this curve is possible to see that
the relation between Isc and the Voc has a decrease in the maximum power point (Mpp)
because the values of Iscand Voc are not obtained in real operation with electrical load. For
this result, at Mpp it is possible to derivate to values Impp and Vmpp which are the maximum
power point current and voltage respectively. The most common control strategies for a PV
system is to try to keep the operation of the PV panel at this point. [19]
Fill factor equation demonstrates the importance of the ideality factor. There is the measure
of the junction quality and the type of recombination in a solar cell. Assuming that the
solar cell behaves as an ideal diode, equation (2-3) can be re-written as (2-4):
𝐹𝐹 =𝑉𝑜𝑐− ln(𝑉𝑜𝑐+ 0,72) 𝑉𝑜𝑐+ 1
(2-4)
With these parameters, it is possible to obtain the characteristic curve which describes the
behavior of solar cells. In this curve, it is possible to analyses the different losses and the
performance of the solar cell depending on the conditions which are obtained [20].Figure 2-4
shows a typical I-V curve.
Figure 2-4 Characteristic Curve PV cell [21]
Conversion efficiency (ƞ): This is also an important parameter in solar cells. Unlike the fill factor, this parameter compares the ratio between the maximal general power and the incident
power. For a standard of AM 1,5 the irradiance value is Pin = 1000 W/m2. The equation
(2-5) expresses this parameter, and it is common to multiply per 100 to express it in a percentage.
A comparison of the conversion efficiency is performed, regardless of the production
technology [7]. Most of the technologies efficiency lies in the range of 15% & 20%, but most
recent developments reach up to 45% as shown in figure 2-5.
Figure 2-5. Conversion Efficiency in different PV technologies [22]
2.1.3 External variables involved in PV generation
Like was discussed in the last section, PV technologies have a non-linear behavior and this
behaviour depends nonlinearly of environmental variables and this will be discussed in this
section. Also each photovoltaic technology responds in a different way under these
conditions [14, 17, 23]. On this point, it is not possible to ensure that one specific PV module
has the same performance always.
Spectral Response (SR (λ)): the short current circuit in a PV cell is directly proportional to the irradiation, although, all the irradiation is not constant and all the wavelengths contribute
to the short circuit current. In this way, this parameter can be defined like (2-6):
𝐼𝑠𝑐 = ∫ 𝑆𝑅𝑒𝑥𝑡(𝜆)𝑓(𝜆)𝑑𝜆
𝜆
The internal spectral response in a PV cell gives an indication of which sources of
recombination are affecting the cell performance. [14]. Figure 2-6 illustrates how the spectral
response it is not linear model and how it changes according to different wavelengths.
Figure 2-6 Spectral Response of the silicon solar cell before and after irradiation [24]
Also figure 2-6 shows two important things. The first one is how the spectral response
changes according to the different wavelengths present in line, and this relation is not linear.
The second one that is an important thing to see is the degradation in the solar cells. This
effect is important in the long-term. The dashed line is the curve after irradiation simulation
and indicates how a simple silicon solar cell losses the capacity to generate power. This
phenomena is explained with more detail on [2, 14, 17, 24, 25]
Temperature: in the past section, it was possible to see how the temperature is involved on the PV cell parameters. Isc and Voc are direct related with temperature in the module, as were
seen in equations (2-2), (2-3) and derived expressions. But there is also an equally large
number of correlations expressing the temperature dependence of the PV electrical efficiency (ƞ) [26]. For a current short circuit, an increase of the temperature represents an increase of
this value. On the other hand, an increase of temperature represents a decrease in open circuit
ƞ = ƞ𝑇𝑟𝑒𝑓[1 − 𝛽𝑟𝑒𝑓(𝑇𝑐 − 𝑇𝑟𝑒𝑓+ 𝛾 log 𝐺𝑇)
(2-7)
In which ƞ𝑇𝑟𝑒𝑓 is the module efficiency at the reference temperature, 𝑇𝑟𝑒𝑓 and standard
radiation flux (1000 W/m2); 𝛽
𝑟𝑒𝑓 is the temperature coefficient and 𝛾 is the solar radiation
coefficient. These values are given by the manufacturer.
Another important value of PV cells is the Nominal Operating Cell Temperature (NOCT),
which represents the temperature of the module in more real conditions (irradiance: 800
W/m2, Air Temperature: 20°C, Wind velocity: 1 m/s). This value is obtained as the
temperature reached by open circuit cells under the last conditions [2].
Also, this effect can be explained in a thermodynamic point of view [2]. In this point of view,
the solar cell is modelling like a heat engine and with this model it is possible to obtain a
good approximation for losses by thermal dissipation. But in this analysis, the Isc and Voc can
be written as a function of the temperature in equation (2-8).
𝐼𝑠𝑐 = 𝐺𝑇
It is necessary to mention that the mounting system has an important role in real applications
to try to minimize this effect. In this case, the designer has to consider this losses for a better
performance in the real applications [26, 27].
In this way, according the National Renewable Energy Laboratories (NREL) of United States
of America[28], it is established a set of rules for the coefficient correction of Performance
Ratio. The Performance ratio will be explain in next sections. The coefficient correction of
𝑌𝑓𝑐𝑜𝑟𝑟 = 𝐸
The summations are over a defined period of time (days, weeks, months, years)
𝑌𝑓𝑐𝑜𝑟𝑟 = corrected performance ratio (unitless)
EN = measured electrical generation (kW)
P0= summation of installed modules power rating from flash test data (kW)
GPOA = measured plane of array (POA) irradiance (kW/m2)
i = a given point in time
GSTC = irradiance at standard test conditions (STC) (1,000 W/m2)
Tcell = cell temperature computed from measured meteorological data (°C)
Tcell_typ_avg = average cell temperature computed from one year of weather data
using the project weather file (°C)
δ = temperature coefficient for power (%/°C, negative in sign) that corresponds to the
installed modules.
Equation (2-9) is very useful in the analysis of the results of test the PV panels. This
coefficient can give a real idea of the behavior of the PV panel production. In this line, it is
important to take account in all the test that can be doing to check the performance. These
2.2Performance Measures for Photovoltaics Modules
For the causes than affect the operation of PV modules is necessary to determine the real
efficiency of PV modules. Because this parameter is very important to make decisions in
common applications, taking into account the balance between the economic investment and
how much energy can be produced by a system. Also, due to the large number of existing
technologies it is a good way to characterize all the technologies under the same analysis.
In this section, the different forms to measure the parameters of PV modules will be
discussed. Basically, it can be divided into two main branches: indoor and outdoor measures.
It is important to mention, that the variety of the measure depends of the nature of the study
desired.
2.2.1 Standard Test Conditions (STC)
Standard Test Conditions (STC) is a first approximation to the performance of a PV module.
This is the most common test in the PV market. All the commercial PV panels have to be this
standard with the results shown in the datasheet and the tag behind the modules by the
manufacturer [29]
STC approaches the PV module performance to normal conditions under laboratory
simulator, which can produce similar environmental conditions. In this case, the operating
temperature is 25°C and the illumination is provided in a short flash equivalent to 1 sun
intensity at 1000 W/m2, and an air mass of 1,5 is assumed. Under these conditions, one
proceeds to measure the current-voltage characteristic of an electrical load. Figure 2-7 shows
Figure 2-7 Spi-Sun Simulator Photovoltaic Module Testing [30]
STC is developed according to the standard IEC 60904-1: Photovoltaics devices-Part 1:
Measurements of photovoltaic current-voltage characteristics for current-voltage
characterization, IEC 61215: Crystalline silicon terrestrial photovoltaic (PV)
modules-Design qualification and type approval and IEC 61646: Thin-film terrestrial photovoltaic
(PV) modules for a module performance at STCand other standards if a more detailed test is
required. Also, the majority of the reports are prepared according with the standard ISO
17025.
Even though this test is world-renowned, and all the manufacturers provide this information,
STC is a simulation under ideal conditions. Real conditions could be different for this
conditions and these will be reflected in indicators like effective sun hours. [23, 29]. For this
reason recent standards find to describe in best way the true performance of the PV modules
under real conditions. In addition, these check points change according to the geographical
location of the project. The next part presents this kind of testing.
2.2.2 Normal Operation Cell Temperature (NOCT) Test
As was mentioned in the previous section, the STC represented the ideal case. But in the real
NOTC is designed for finding the expected operating temperature of the PV module under
more real conditions. For this test, the following parameters are used: Irradiance on cell
surface: 800 W/m2, Air Temperature: 20°C, Wind Velocity: 1 m/s and mounting: open back
side. Also, the manufacturers of PV modules provide this information in the datasheet of the
product.
As was discussed in section 2.1.3, it is possible to note a remarkable difference between the
performance of a PV module under NOTC conditions and STC. This difference is illustrated
in Figure 2-8.
Figure 2-8. Comparison between STC and NOTC PV module Performance [32]
The best performance of PV panel is better for values low values of NOCT. A lower NOCT
of a PV module will be a better response to the different values of irradiation. Otherwise with
larger value [33].The best module operation point at a NOTC of 33°C, the worst at 57°C and
the typical module at 48°C respectively [18]. An approximate mathematical expression for
calculating the cell temperature in all moments is given by (2-10).
𝑇𝑐𝑒𝑙𝑙 = 𝑇𝑎𝑖𝑟+𝑁𝑂𝑇𝐶 − 20 800 ∗ 𝐺𝑀
Where Gm is the solar irradiance and Tair is the air temperature.
It is important to mention the role that the racking system can have help on the efficiency of
a PV system. For example, in a roof integrated mounting system, a rear surface work infinite
rear thermal resistance because it cannot exchange heating with the environment. For this
reason, another similar value called Installed Nominal Operating Conditions Temperature
(INOCT) is defined, and includes the effect of the mounting configuration. This value is
determined experimentally and the results can be found in the literature [2, 18, 29].
2.2.3 Outdoor evaluated performance parameters
Although the tests mentioned above are internationally recognized and used, they may not
be sufficient for a true characterization of a PV module. The real energy yield is difficult to
predict just with datasheet declarations, which are obtained in laboratory tests. In summary,
the datasheet declaration includes open circuit voltage Voc, short circuit current Isc, MPP
voltage Vmpp, MPP current Impp, maximum power Pmpp, efficiency ƞ and temperature
coefficients [23].
In fact, none of this information really meets the requirements for the real behavior of a PV
system in some specifically geographical location. This real behavior it is useful for the end
user in order to determine some economics aspects about the implementation of one of these
systems.
For this reason, there is another kind of measurement, which has a real performance analysis
of a PV module in the field. There are called outdoor measurements. This test evaluates three
principal parameters: the final energy yield, the reference yield and the performance ratio
(PR). The standard IEC 61724 [34] defines these three parameters. A detailed definition is
found in [35] and these definitions are presented in the following lines.
Final energy yield (Yf): is the net energy output E divided by the nameplate d.c power P0 of the installed PV array. It represents the number of hours that the PV array would need to
operate at its rated power to provide the same energy. The units are hours or kWh/kW, with
parameter. For this reason, the energy yield is used for comparing the energy produced for a
different sizes. The final energy yield is given by equation (2-11)
𝑌𝑓 = 𝐸 𝑃0
(2-11) Reference yield (Yr): is the total in plane irradiance H divided by the PV´s reference irradiance G under STC (1000W/m2). This reference yield defines the solar radiation resource
for the PV system. It is a function of the location, orientation of the array and time-time
weather variability. The equation (2-12) describes this parameter and its unit is hours.
𝑌𝑟= 𝐻 𝐺
(2-12) Performance Ratio (PR): is defined as the ratio between Yf and Yr, as expressed in (2-13). This parameter is used as an useful way to quantify the overall effect of losses on the rated
output due to PV module temperature, spectrum, module mismatch and other loses such as
optical reflection, soiling and downtime failures.
𝑃𝑅 =𝑌𝑓 𝑌𝑟
(2-13)
And alternative way to obtain the performance ratio is defined with a new parameter, the
outdoor efficiency(ƞoutdoor) [35] that is defined by equation (2-13).
ƞ𝑜𝑢𝑡𝑑𝑜𝑜𝑟 = 𝐸 𝐻 ∗ 𝐴
(2-13)
Where E is the energy output and H is the total plane irradiation (kW/m2) and A (m2) is the
area of the PV array. With this expression it is possible to calculate the performance ratio
𝑃𝑅 = 𝐸 𝐻 ∗ 𝐴 ∗ ƞ𝑆𝑇𝐶
(2-14) ƞ𝑆𝑇𝐶 is the STC efficiency present in datasheet.
Performance ratio values are typically reported on a monthly or yearly basis. Smaller
intervals, such as weekly or daily, may be useful for identifying some problems related with
components failures. Yearly values may indicate the degradation of the PV module,
represented by loses in energy yield in a more efficient way that accelerated ageing test. [36]
The International Electrotechnical Commission (IEC), in the Technical Committee 82
Working Group 2 has been working around fifteen years to create an appropriate power and
energy standard (IEC 61853). This standard is composed by four parts describe by [37].
IEC 61853-1Irradiance and temperature performance measurements and power rating,
which describes requirements of evaluating PV module performance in term of power (watts)
rating over a range of irradiances and temperatures.
IEC 61853-2 Spectral response, incidence angle and module operating temperature
measurements, which describes test procedures for measuring the effect of varying angle of
incidence and sunlight spectra as well as the estimation of module temperature from
irradiance, ambient temperature and wind speed.
IEC 61853-3 Energy rating of PV modules, which describes the calculations for module
energy (watts-hours) ratings.
IEC 61853-4 Standard days, which describes the standard time periods and weather
conditions that can be used for the energy rating calculations.
2.2.4 Photovoltaic Performance Verification Program (PVPV)
Now, this section will discussed the job realized by the research group in Ontario, Canada,
called The Sustainable Technologies Evaluation Program (STEP) at Toronto and Region
analytical tools needed to support broader implementation of sustainable technologies and
practices [11]. Its mains objectives are:
Monitor and evaluate clean water, air and energy technologies;
Assess barriers and opportunities to implementing technologies;
Develop tools, guidelines and policies; and
Promote broader use of effective technologies through research, education and
advocacy.
STEP has a special program called the Photovoltaic Performance Verification Program
(PVPV) that is the premier photovoltaic testing facility and showcase for Ontario clean
energy manufacturing, technology and innovation. [38]. PVPV works on analyze the
performance of Ontario-made PV modules, especially in domestic content modules allowing
the user to compare the different technologies, thus helping out to make decisions. Figure
2-9 illustrates the installation of this program.
2.3Conclusions
Photovoltaics energy has a large market with a diversity of different technologies available.
For this reason, the characterization of these modules is important in the global market,
helping to make decisions in economic issues. The PV technologies can be divided into three
principal branches according to the material and fabrication processes.
Independent of the PV technology, it is possible to detail the behavior through simple
parameters. The short circuit current is the current in the electrical load when the PV cell is
short circuited and is the maximum current obtained by this cell. The open circuit voltage is
the voltage in the solar cell when the electrical load is not flow current and this value is the
maximum voltage that the panel can give. But these values are not found together in real
conditions and for this reason, it is possible to find two new values of current and voltage
located at MPP from the I-V curve of the solar cell. With these values the ratio of generation
for a PV cell can be defined, called fill factor. Another important parameter is the conversion
efficiency, which takes into account the irradiation of the cell and the power generated.
To measure this parameter, there are a lot of methodologies. The most famous is called the
STC and it is the test from which the manufacturers obtain the information printed on
datasheets. Due to the environmental conditions on this test it is not possible to ensure the
information is for real operating conditions. Because of this, another test (NOTC) has also
been developed to bring more detailed information of the performance of PV Panels.
However, these tests are taken in a special laboratories.
The outdoor measurements give a real value of the behavior of PV modules under standards
IEC 61724 and IEC 61853. Three parameters are obtained with this test: energy yield,
reference yield and performance ratio. A lot of information can be obtained from the
literature and these are in real conditions. But it is not possible to find information about
Costa Rica. For this reason, the design for a monitoring system for a PV performance in
project Las Nubes would allow a start with these kind of studies. The results from these
Chapter 3
Requirements
There are several design characteristics that need to be addressed in order to develop a
monitoring device that can measure the principal parameters of PV modules. An important
aspect of these requirements is the fulfillment of international standards (National Electrical
Code NEC, IEC 61724, IEC 61853 and others) aiming the device can used in real life. This
monitoring system is focused on the outdoor measurements without tracking to obtain the
result of the performance ratio [39].
Depending on the necessities of the project, it will divided in two main areas. First the design
of the monitoring system and second, the design of structure for mounting the solar panels.
For the first area, the deliverable will be a functional prototype and for the second area the
deliverable is the set of plans of the structure.
The requirements are divided into two main groups: functional requirements that indicates
what the prototype has to do and non-functional requirements, which indicates how the
prototype has to be.
3.1General characterization of the requirements
For energy yield measurement, it is necessary to monitoring the power generated by the solar
panels. Basically it is important to know the current and the voltage of each panel. For the
proposal measurement, the current and voltage are to be measured at electrical output. It
means, the measurements are in Direct Current. (DC)
To find the maximum values of the current and voltage to be measured, one needs to know
first which panels are to be measured. For this reason, it was necessary to know the panels
available in the Costa Rican market. Taking into account, the Photovoltaic Performance
Verification Plant proceeds to analyze the solar modules available of Costa Rica in a first
step.
To get this data, a survey was conducted with the companies that distributes this kind of
companies and for some companies the information was required by email. Then, the
electrical parameters are obtained directly from datasheets. The last model in the tables are
not available in the Costa Rican market, but will be used in to test the prototype. Tables 3.1,
3.2 and 3.3 shows the principal characteristics obtain for this survey.
Table 3-1 Electrical parameters at SCT for PV modules available in Costa Rica
Manufacter Model Cell Type Number
of cells
Table 3-2 Electrical parameters at NOCT for PV modules available in Costa Rica
Table 3-3 Mechanical parameters for PV modules available in Costa Rica
Manufacter Model Length[mm] Width[m] Depth[m] Weight [kg]
Kyocera KD255 1662 990 46 20
The monitoring system is the most important part of the present design and for this system is
necessary to take the next requirements into account
3.2.1 Functional requirements
FR1. Current Sensing
According to table 3.1, the maximum current to measure is 9,09A, taking the parameter of
the Short circuit Current of module Kyocera (KD255) as a reference.
FR2. Voltage Sensing
According to table 3.1, the maximum voltage to measure is 37V. Taking the parameter of the
FR3. Module Temperature Sensing
According to table 3.2, the maximum module temperature to measure is 47°C. Taking the
information of module Astroenergy (CHSM6610M) as parameter. It is also important to
mention that the sensor has to be added to the panel for efficient measurement.
FR4. Environmental Conditions Sensing
According to IEC 61724 for optimal measurement, it is necessary to obtain the data of the
environmental conditions like: temperature, wind speed and humidity.
FR5 Irradiance Conditions Sensing
According to IEC 61724, for optimal measurement, it is necessary to obtain the data of the
irradiance in solar modules. This sensor should have the same angle as the PV array.
FR 6. Data acquisition time
According to IEC 61724 for and optimal measurement it is necessary to obtain the data for
the array each minute like maximum sample time.
FR 7. Data transmission
The system should have the capacity to send the data to a bigger computational data system
for storage.
3.2.2 Non-functional requirements
NFR 1 Safety
As a system is in direct contact with the human operator, it is necessary to guarantee the
system may not endanger human life.
NFR 2 Autonomous Electrical Supply
As the system works in field, a way should be developed to bring autonomous electrical
NFR 3. Hardware Environmental Protection
As the system works in field, the system must be protected from environmental conditions.
3.3Mounting structure
3.3.1 Functional requirements
FR 1. Area capacity
The structure must have enough area to place all the panels described in Table 3-1.
FR 1 Load capacity
The structure has the capacity to support without failure, a minimum of three for each panel
from Table 3-1.
FR 2 Grounding Capacity
The material structure must have the capacity to be a good grounding material, in accordance
with NEC
3.3.2 Non-functional requirements
NFR 1. Safety
As a system is in direct contact with the human operator, it is necessary to guarantee the
system may not endanger human life. A good selection of the Safety Factor is necessary in
Chapter 4
Design
The chapter presents the design process for giving a solution to the problem exposed. Also,
it shows the important considerations regarding the study and selection of the sensors, the
controller, the transmission data system and the design for the software used in this process.
In the same way, this chapter shows the design process for the structure for mounting the
Photovoltaic Performance Verification Plant.
4.1General description: Monitoring System
Following the requirements in chapter 3 and the general description of the project, it is
possible to create a schematic with the project proposal. One of the objectives of this
schematic is the visualization of the comprehensive solution. Figure 4-1 illustrates the general
solution.
Figure 4-1 General Diagram of Solution
According to the requirements of the Las Nubes Project, in this first stage of the Photovoltaic
test will be the energy yield measurement. For this reason the equipment and the procedures
4.1.1 Data Transmission
For the data transmission it is necessary to define the real application and some
considerations about the nature of the place of the measure. There is no location yet for the
Photovoltaic Verification Plant, and the project Las Nubes has a lot of open space. For this
reason it was decided that the communication is wireless. And in this way to collect data in
the field and the send this information to a central PC.
For this proposal, the selection of RF modules will be implemented. The principal advantages
the have RF is broader coverage and has the ability to connect a large number of devices. For
this reason can be possible to create a network sensor, which the measurements of different
PV modules. In next sections will resume this topic.
4.1.2 Data Storage
For the implementation is necessary to storage the data in computer system with increased
capacity of storage, since it is required to obtain data per month or years. For this stage of the
prototype, this storage system will be a Laptop. The standard IEC 61724, in section 6,
provides information about the Data Format. This format is in columns, for this reason an
appropriate software to obtain data is EXCEL 2013®. This is a common software that can
be found on almost any computer.
The interface process between EXCEL and the communication with RF modules will be
realized with Visual Basic 2013® incorporated with Excel. In next section, will work on the
4.2Electronic Equipment selection
This section is related with the process and the detailed of the different equipment for the
creation of the prototype.
4.2.1 Controller
The controller was chosen, both to retrieve the signals from the sensors and have the capacity
to process the information and then send to a bigger computational system. For each PV
module, it is necessary 3 analog inputs (module temperature sensor, current sensor and
voltage sensor). And also for this first prototype, has to be the capacity to read the 4 more
signals (environmental temperature, environmental humidity, wind speed, sun irradiation).
In total was necessary 4 analog inputs to obtain data. In addition the controller, must be
capable of communication, using the selected module.
The selected controller, for this first prototype, was AT mega2560integrated in an Arduino
Mega 2560 Board. Table 4.1 presents the main characteristics of this board.
Table 4-1 Principal feature of Arduino Mega 2560 Board [40]
Feature Description
Microcontroller ATmega2560
Operating Voltage 5V
Input Voltage (recommended) 7-12V Input Voltage (limits) 6-20V
Digital I/O Pins 54 (of which 15 provide PWM output)
Analog Input Pins 16
DC Current per I/O Pin 40 mA DC Current for 3.3V Pin 50 mA
Flash Memory 256 KB of which 8 KB used by bootloader
SRAM 8 KB
EEPROM 4 KB
Figure 4-2 Ping mapping and dimensions for Arduino Mega 2560 Board [40]
4.2.2 Current Sensor
The current sensing is one of the principal measurements in the system. According to FR1
for monitoring system, the maximum current to measure is 9,09A. This value is taken of the
comparison of the different datasheet of PV modules available in the market of Costa Rica.
There are a different form to measure current, which will be described below:
Direct form: That consist in passing an electrical current into a shunt resistance. It is typical to measure the voltage across the resistance and obtain the value, trough Ohm Law. (4-1)
𝐼 =𝑉 𝑅
(4-1)
An advantages of this method have is easy to interpret, it is not necessary an external power
requirement. In the other hand, this kind of measure has the disadvantages of have not
electrical isolation, presenting noise, general amplification is required and presents insertion
Indirect Form: For DC current, the other measure method is with a Hall Effect sensor current. This sensor work with a magnetic field that device convert into a voltage output,
proportional to the normal magnetic field. This technology are divide into two technologies
open loop and close loop. This two technologies are different. More information is found in
[41].
The Hall Effect sensor has as advantages the lost cost, provides electrical insolation and is
very reliable. On the other hand, has the disadvantages of difficult to understand, requires
and external supply and outputs signals for zero current flow.
For this prototype, the sensor selected is the Hall Effect sensor, the integrated circuit ACS712
with part number ACS712ELCTR-20A-T of the manufacturer Allegro Microsystems. This is
a Hall Effect-Based Linear Current Sensor IC with 2.1 kVRMS Isolation and a
Low-Resistance Current Conductor. The output of the device has a positive slope (>VIout(Q)) when
an increasing current flows through the primary cooper path. The principal features of this
chip are presented in Table 4.2
Table 4-2 Main features of chip ACS712ELCRT-20A-T. [42]
Feature Description Primary conductor Resistance 1,2 MΩ
Rise time 3,5 µs
Frequency Bandwidth 80 kHz
Nonlinearity 1,5 %
Zero Current Output Voltage Vcc x 0,5
This sensor fulfill with the requirements of current. As it shows on table 4-2, the optimized
range is for -20A to 20A. According to Table 3-1 the maximum current to measure is 9,09
module and prevent some damages, per overload in the system. Figure 4-3 shows the Pin-out
diagram.
Figure 4-3 Pin out diagram ACS 712 [42]
4.2.3 Voltage Sensor
Another important thing in this measure, is the voltage. This voltage, according to FR 2, has
a maximum value of 37 V in direct current. For this reason the simplest form to measure this
parameter is in a direct way. But, the voltage value will damaged the controller. For this
reason is necessary the implementation of interface, a voltage divider. This voltage divider
provides a proportional value according the input value. Equation 4-2 gives this relation.
𝑉𝑜𝑢𝑡𝑝𝑢𝑡 = 𝑅1
𝑅1+ 𝑅2𝑉𝑖𝑛𝑝𝑢𝑡
(4-2)
This voltage divider should be relatively small to the channel impedance, but it is necessary
to this impedance will be the most higher possible, to improve the signal-to-noise [43].
and output of approximately 10 kΩ or less. This value provides that in actual sample, the
input resistance is temporarily a lot lower as the sampling capacitor is charged up, making a
better measure. For this reason the resistance selected for this proposal for R2 is 10kΩ and
supposed a maximum input of 55 V, with equation 4-2, the resistance for R1 is 1kΩ.
The resistances selected for this proposal are the High Precision Foil Resistor with TCR S
series of Vishay brand. These resistances are develop with Bulk Metal Foil, the principals
features are described in Table 4.3
Table 4-3 Main features High Precision Foil Resistor [44]
Feature Description
Power Rating 1 W
Resistance Tolerance 0,005% Electrostatic discharge 25 kV
Rise time 1 ns
Current noise 0,010µVrms
Voltage coefficient < 0.1 ppm/V
4.2.4 Module Temperature Sensor
According to IEC 60904-1 it is necessary to measure the temperature of the module according
to Figure 4-4. It is necessary to put the three sensors, obtain data and calculate the average
value for special temperature test. For energy yield test, with one sensor located in the middle
Figure 4-4. Temperature sensor location at PV module [39]
The sensor selected for this proposal is the temperature sensor TP-01 type K. The main
features are described in table 4-4.
Table 4-4Main feature PT-01 type K [45]
Feature Description
Coefficient 38,5Ω for 100°C
Capacity -200 to +350
Electrical Insolation 50 MΩ
Precision 0,4%
Output range 0-50mV
Response time 50 ms
Figure 4-5 Schematic Diagram PT 01
4.2.5 Environmental conditions sensor
It is important to mention, for a Performance Verification Analysis in outdoor measurements,
is necessary to take into account the environmental conditions. Focus on temperature, relative
humidity, irradiance in the same plane of the irradiance, irradiance in horizontal plane, wind
and direction of the speed. This features can do it a comparison point in the different latitudes.
It is not the same to measurement in the Nordic Latitudes than in the Tropical Zone.
Thinking about possible growth of Las Nubes Project as Research Center, the weather station
should not be exclusive of the Photovoltaics Performance Verification Plant, but must also
serve other studies required. However, it is necessary a sensor for the PV array, the irradiance
in the same plane. In the next paragraphs be described both equipment.
Irradiance in the same plane
According to the standard IEC 61853-1, it is necessary to take data of the irradiance of the
same plane of the PV array. This measurement it is necessary to do comparison of the real
efficiency of a PV module. The sensor selected for this measurement is the pyranometer
Table 4-5. Main features Pyranometer SP-214 of Apogee Instruments [46]
Feature Description
Cosine Directional Response at 75° ±5%
Absolute Accuracy ±1%
Spectral Range 360 to 1120nm
Output Range 0 to 5V
Sensitivity 2.0mV per W/m2
Calibration Factor 0.5W/m2 per mV
Power Source required 5V
Response time 1ms
Temperature Response ±0,04%/°C
Operating temperatures -40 to 70°C
Dimensions 23,50x23,50x28,mm
Figure 4-6 illustrates the pyranometer SP-214. It is possible to see this instrument is an easy
install device. And it counts with certifications ISO and World Meteorological Organization
(WMO).
Weather station
Las Nubes Project pretends to convert, in collaboration with the Sustainable Energy
Initiative, in a research center focus on renewable energy. For this reason, it is necessary to
take into account an accuracy weather station. For this project is propose to use the weather
station Wireless Vantage Pro2 6163 including UV & Solar Radiation of the company
DAVIS.
There is a solar power high accuracy weather station than allows to measure rainfall,
temperature, humidity, wind speed and direction, UV and solar radiation. All of this things
are checked under the standard and quality observations for use by National Oceanic and
Atmospheric Administration and National Institute Standard and Technology (NIST).
Among the main features that has, it is the wireless communication. This is important because
it will be installed in a conservation center, for this reason it is necessary not to be invasive
installation. In the same way, this weather station is powered by a solar panel and has a
battery backup system. Main features of this weather station are described in Annex B1.
Costa Rica has an appropriate conditions for solar production. Unlike the countries with
largest number of photovoltaics, Costa Rica has a better conditions than other latitudes during
the year, the temperature is relatively constant as the solar irradiation. In addition, Costa Rica
has not dramatically changes in seasons
However, for a testing purposes, it is not possible to buy this weather station. But, to collect
meteorological data was used the sensor DHT22 of Aosong Electronics for measure the
environmental temperature and relative humidity. This is a low cost sensor that meets with
the temporally requirements. Other meteorological dates are taken of Meteorological Service
of Canada (MSC) [47] for the prototype testing period. The main features are presented in
Table 4-6 Main features sensor DHT 22 [48]
Feature Description
Power Supply 3.3V-6V
Output signal Digital Signal Via Single Bus
Sensing element Polymer humidity capacitor & DS18B20 for detecting temperature
Measuring range Humidity 0-100%RH
Temperature -40 to 125°C
Accuracy Humidity+-2%
Temperature+-0,2°C
Resolution Humidity 0,1%
Temperature 0,2°C
Sensing Period Average 2s
Figure 4-7 shows a general representation of the sensor and dimensions in mm.
4.2.6 Communications modules
The module select for the communication process is APC Series Transparent Transceiver Module APC 220-43 of the manufacturer APPCON Technologies. It is a cost-effective and easy applied module that not only can transmit transparent data with large data buffer zone,
but also can provide more than 100 channels. Also has a communication ratio of 1000m at
2400bps in light sight, which meets the needs of the project. The mean features are presented
in Table 4-7
.
Table 4-7. Main features APC220-43 RF Module [49]
Feature Description
Communication Distance (2400bps) 1000 meters
Output power 20mW
Data buffer Exceed 256 bytes
Supply Voltage 3.5-5.5V
Transmit current 42mA
Receiving Current 28mA
Sleeping current 5µA
One of the most important characteristics of this modules are the modularity and the compact
![Figure 1-2 Location of Project Las Nubes [9]](https://thumb-us.123doks.com/thumbv2/123dok_es/3743842.643389/15.918.255.665.723.998/figure-location-project-las-nubes.webp)

![Figure 2-5. Conversion Efficiency in different PV technologies [22]](https://thumb-us.123doks.com/thumbv2/123dok_es/3743842.643389/25.918.189.733.217.530/figure-conversion-efficiency-in-different-pv-technologies.webp)
![Figure 2-6 Spectral Response of the silicon solar cell before and after irradiation [24]](https://thumb-us.123doks.com/thumbv2/123dok_es/3743842.643389/26.918.274.672.241.539/figure-spectral-response-silicon-solar-cell-irradiation.webp)
![Figure 2-7 Spi-Sun Simulator Photovoltaic Module Testing [30]](https://thumb-us.123doks.com/thumbv2/123dok_es/3743842.643389/30.918.265.652.122.398/figure-spi-sun-simulator-photovoltaic-module-testing.webp)

![Figure 4-2 Ping mapping and dimensions for Arduino Mega 2560 Board [40]](https://thumb-us.123doks.com/thumbv2/123dok_es/3743842.643389/45.918.198.721.100.405/figure-ping-mapping-dimensions-arduino-mega-board.webp)

