Sourcing Strategies, Supplier Buyer Relationships, and Performance Outcomes: A Transaction Cost Economics and Social Network Theory Approach Edición Única
188
0
0
Texto completo
(2) Copyright © by Sergio Guillermo Gómez Corripio 2006.
(3) SOURCING STRATEGIES, SUPPLIER-BUYER RELATIONSHIPS, AND PERFORMANCE OUTCOMES: A TRANSACTION COST ECONOMICS AND SOCIAL NETWORK THEORY APPROACH. by Sergio Gómez Corripio. Dissertation. Presented to the Faculty of the Graduate School of Business Administration and Leadership (EGADE) of the Institute Tecnológico y de Estudios Superiores de Monterrey. in Partial Fulfillment of the Requirements for the Degree of. Doctor of Philosophy in Management. Institute Tecnológico y de Estudios Superiores de Monterrey August 2006.
(4) SOURCING STRATEGIES, SUPPLIER-BUYER RELATIONSHIPS, AND PERFORMANCE OUTCOMES: A TRANSACTION COST ECONOMICS AND SOCIAL NETWORK THEORY APPROACH. APPROVED BY THE MEMBERS OF THE DISSERTATION COMMITTEE. Fernando Mata Carrasco, Ph.D. (Chair) Associate Dean for Academic Affairs EGADE, ITESM Campus Monterrey. Sukran Kadipasaoglu, Ph.D. Director Supply Chain Center C.T. Bauer College of Business University of Houston. Alejandro Ibarra Yúne., Ph.D. Professor of Economics and Public Policy EGADE, ITESM Campus Monterrey. DIRECTOR OF THE DOCTORAL PROGRAM. Alejandro Ibarra Yúnez, Ph.D. Professor of Economics and Public Policy EGADE, ITESM Campus Monterrey.
(5) To my wife Bibiana, for her endless belief and support in what has sometimes seemed the direst of straits, when every silver lining had a dark cloud and when the storm looked as if it would never move. Thank you, we have crossed the final line together. Love is the strongest anchor..
(6) ACKNOWLEDGMENTS. I am deeply grateful to my parents Sergio (+) and Ofelia and my sister Ofelia, for their continuous support during my doctoral studies. Despite passing to our toughest moment as a family, you never stop pushing me to persevere on this dream. Dad, wherever you are I am sure you are happy with this accomplishment; you were always part of this dream.. I wish to thank my advisors Drs. Sukran, Fernando, and Alejandro, for their constant guidance and encouragement during the development of this research project.. I am also thankful to all the participants in the survey, and to ITESM and CONACYT for their financial support..
(7) SOURCEVG STRATEGIES, SUPPLIER-BUYER RELATIONSHIPS, AND PERFORMANCE OUTCOMES: A TRANSACTION COST ECONOMICS AND SOCIAL NETWORK THEORY APPROACH. Sergio Gómez Corripio Graduate School of Business Administration and Leadership Institute Tecnol6gico y de Estudios Superiores de Monterrey Doctoral Program in Management Main Advisor: Fernando Mata Carrasco, Ph.D.. Abstract of Dissertation. This research investigates the impact of sourcing strategies on sourcing performance based on transaction cost economics and social network theory. The analysis considers the sourcing strategies use to buy the three inputs that represent the highest percentage of total purchasing expenses of the firm. The strategies studied were: sole sourcing, multiple sourcing with a preferred supplier, mix sourcing (sole source for some inputs and multiple source with a preferred supplier for others), and multiple sourcing with equally-split suppliers. Sourcing performance was measured by the following outcomes: input price, input quality level, on-time delivery, complete-order delivery, order fulfillment lead time, and supplier responsiveness. Data were collected from a sample of 95 Mexican manufacturing firms and analyzed using factor analysis, cluster analysis, and analysis of variance. Results show a preference towards a reduced supplier base (i.e., popularity of sole sourcing and multiple sourcing with a preferred supplier). Sole sourcing was the best performer in terms of input price, input quality. vi.
(8) level, on-time delivery, complete-order delivery, and order fulfillment lead time. However, it was only significantly better in terms of complete-order delivery. Multiple sourcing with equally-split suppliers was the best performer in terms of supplier responsiveness. However, no significant difference was found with respect to the other strategies. A relevant contribution was to discover that mix sourcing was not as attractive as theory states, therefore filling the gap of empirical studies that test the impact of a mix sourcing strategy on particular performance outcomes. With the exception of one firm, all manufacturers reported buying only very low and low complexity inputs (i.e., commodity-type). No significant moderating effect of input nature was found in the relationships between sourcing strategy and sourcing performance.. vii.
(9) TABLE OF CONTENTS. Chapter 1: Introduction and Research Objective. 1. 1.1 Introduction. 1. 1.2 Research Objective. 3. Chapter 2: Literature Review. 5. 2.1 Sole Sourcingand Multiple Sourcing. 5. 2.2 Sourcing Strategies, Embedded Relationships and Arm's-Length Ties. 10. 2.3 Sourcing Strategies and Performance Measures. 11. 2.4 Sourcing Strategies and Input Nature. 13. Chapter 3: Theoretical Framework. 15. 3.1 Transaction Cost Economics. 15. 3.2 Social Network Theory. 16. 3.3 Linking Sole Sourcing and Multiple Sourcing Strategies to Theoretical Framework. 17. Chapter 4: Theoretical Model, Variables & Hypotheses. 18. 4.1 Theoretical Model. 18. 4.2 Variables and Operational Definitions. 19. 4.3 Research Hypotheses. 20. 4.3.1 Sole Sourcing Strategies. 20. 4.3.2 Multiple Sourcing Strategies. 22. 4.3.3 Mix of Sole and Multiple Sourcing Strategies. 23. viii.
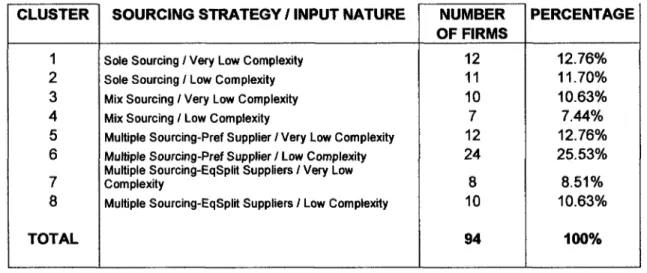
(10) TABLE OF CONTENTS -Continued. 4.3.4 Proposed Hypotheses. 24. Chapter 5: Research Methodology. 26. 5.1 Data Collection. 26. 5.2 Data Analysis. 31. 5.2.1 Factor Analysis. 31. 5.2.2 Cluster Analysis. 33. 5.2.3 ANOVA. 34. Chapter 6: Results. 36. 6.1 Demographics of Respondents. 36. 6.1.1 Judgment Sample Respondents. 36. 6.1.2 Simple Random Sample Respondents. 36. 6.2 Factor Analysis. 39. 6.3 Cluster Analysis. 43. 6.4 ANOVA. 48. 6.4.1 Effect of Sourcing Strategies on Sourcing Performance. 48. 6.4.2 Effect of Sourcing Strategies on Firm Performance. 56. 6.4.3 Sourcing Strategies and Supplier-Buyer Relationship. 63. 6.4.4 Input Nature and Sourcing Performance. 73. 6.4.5 Input Nature and Firm Performance. 75. 6.4.6 Input Nature and Supplier-Buyer Relationship. 77. 6.4.7 Moderating Effect of Input Nature. 79. ix.
(11) TABLE OF CONTENTS - Continued. 6.5 InputNature and Sourcing Strategy Selection. Chapter 7: Discussion of Results. 103. 105. 7.1 General Findings. 105. 7.2 Effect of Sourcing Strategies on Sourcing Performance. 113. 7.2.1 Effect on Input Price. 114. 7.2.2 Effect on Input Quality Level. 119. 7.2.3 Effect on On-Time Delivery. 123. 7.2.4 Effect on Complete-Order Delivery. 128. 7.2.5 Effect on Order Fulfillment Lead Time. 132. 7.2.6 Effect on Supplier Responsiveness. 134. 7.3 Moderating Effect of Input Nature. 136. Chapter 8: Limitations and Future Research. 142. Chapter 9: Conclusions. 149. Appendix A: Focus Group Protocol. 151. Appendix B: Q-Sort Procedure. 153. Appendix C: Questionnaire. 154. References. 161. Biographical Sketch. 170. x.
(12) LIST OF FIGURES. Figure # 1.- Transaction-Relationship-Ownership Continuum. 12. Figure # 2 .- Theoretical Model. 18. Figure # 3.- Scree Plot. 42. Figure # 4.- Input Price Mean Values for Sourcing Strategies. 51. Figure # 5.- Input Quality Level Mean Values for Sourcing Strategies. 51. Figure # 6.- On-Time Delivery Mean Values for Sourcing Strategies. 52. Figure # 7.- Complete-Order Delivery Mean Values for Sourcing Strategies. 52. Figure # 8.- Order Fulfillment Lead Time Mean Values for Sourcing Strategies ....53 Figure # 9.- Supplier Responsiveness Mean Values for Sourcing Strategies. 53. Figure # 10.- ROA a Mean Values for Sourcing Strategies. 58. Figure # 11.- Market Share a Mean Values for Sourcing Strategies. 58. Figure # 12.- Profit Margin a Mean Values for Sourcing Strategies. 59. Figure # 13.- ROA b Mean Values for Sourcing Strategies. 59. Figure # 14.- Market Share b Mean Values for Sourcing Strategies. 60. Figure # 15.- Profit Margin b Mean Values for Sourcing Strategies. 60. Figure # 16.- Trust Mean Values for Sourcing Strategies. 65. Figure # 17.- Information Sharing Mean Values for Sourcing Strategies. 66. Figure # 18.- Information Technology Mean Values for Sourcing Strategies. 66. Figure # 19.- Problem-solving Approach Mean Values for Sourcing Strategies. 67. Figure # 20.- Buyer-specific solutions Mean Values for Sourcing Strategies. 67. Figure # 21.- Co-investment Mean Values for Sourcing Strategies. 68. xi.
(13) LIST OF FIGURES - Continued. Figure # 22.- Site Specificity Mean Values for Sourcing Strategies. 68. Figure # 23.- Long/Short Relationships Mean Values for Sourcing Strategies. 69. Figure # 24.- Opportunism Risk Mean Values for Sourcing Strategies. 69. Figure # 25.- Switching Behavior Mean Values for Sourcing Strategies. 70. xii.
(14) LIST OF TABLES. Table # 1 . - Linking Sourcing Strategies to Theoretical Framework. 17. Table # 2 .- Industry Distribution for Respondents and Non-respondents. 31. Table # 3.- Judgment Sample Respondents' Demographics. 37. Table # 4.- Random Sample Respondents' Position Distribution. 37. Table # 5.- Random Sample Firm Size Distribution. 38. Table # 6.- Random Sample Industry Distribution. 38. Table # 7.- Extraction Communalities. 41. Table # 8.- Total Variance Explained. 41. Table # 9.- Factor Loadings & Reliability Coefficients. 44. Table # 10.- Sourcing Strategy Clusters. 45. Table # 1 1 . - Industry and Firm Size Distribution of Sourcing Strategy Clusters. 46. Table # 12 .- Input Nature Clusters. 47. Table # 13.- Industry and Firm Size Distribution of Input Nature Clusters. 47. Table # 14.- Sourcing Strategy / Input Nature Clusters. 48. Table # 15.- Descriptive Statistics for Sourcing Strategies and Sourcing Performance Analysis. 50. Table # 16.- ANOVA for Sourcing Strategies and Sourcing Performance. 54. Table # 17.- Contrast Tests for Sourcing Strategies and Sourcing Performance. 55. Table # 18.- Descriptive Statistics for Sourcing Strategies and Firm Performance Analysis. 57. Table # 19.- ANOVA for Sourcing Strategies and Firm Performance. 61. Table # 20.- Contrast Tests for Sourcing Strategies and Sourcing Performance. 62. xiii.
(15) LIST OF TABLES - Continued. Table # 2 1 . - Descriptive Statistics for Sourcing Strategies and Supplier-Buyer Relationship Analysis. 64. Table # 22.- ANOVA for Sourcing Strategies and Supplier-Buyer Relationship. 71. Table # 23.- Contrast Tests for Sourcing Strategies and Supplier-Buyer Relationship. 72. Table # 24.- Descriptive Statistics for Input Nature and Sourcing Performance Analysis. 74. Table # 25.- ANOVA for Input Nature and Sourcing Performance. 75. Table # 26.- Descriptive Statistics for Input Nature and Firm Performance Analysis. 76. Table # 27.- ANOVA for Input Nature and Firm Performance. 76. Table # 28.- Descriptive Statistics for Input Nature and Supplier-Buyer Relationship Analysis. 78. Table # 29.- ANOVA for Input Nature and Supplier-Buyer Relationship. 79. Table # 30.- Descriptive Statistics for Input Nature and Sourcing Performance Analysis for Sole Sourcing. 80. Table # 31.- ANOVA for Input Nature and Sourcing Performance for Sole Sourcing. 81. Table # 32.- Descriptive Statistics for Input Nature and Firm Performance Analysis for Sole Sourcing. 82. Table # 33.- ANOVA for Input Nature and Firm Performance for Sole Sourcing.... 82. xiv.
(16) LIST OF TABLES - Continued. Table # 34.- Descriptive Statistics for Input Nature and Supplier-Buyer Relationship Analysis for Sole Sourcing. 83. Table # 35.- ANOVA for Input Nature and Supplier-Buyer Relationship for Sole Sourcing. 84. Table # 36.- Descriptive Statistics for Input Nature and Sourcing Performance Analysis for Mix Sourcing. 85. Table # 37.- ANOVA for Input Nature and Sourcing Performance for Mix Sourcing. 86. Table # 38.- Descriptive Statistics for Input Nature and Firm Performance Analysis for Mix Sourcing. 87. Table # 39.- ANOVA for Input Nature and Firm Performance for Mix Sourcing ....87 Table # 40.- Descriptive Statistics for Input Nature and Supplier-Buyer Relationship Analysis for Mix Sourcing. 88. Table # 41.- ANOVA for Input Nature and Supplier-Buyer Relationship for Mix Sourcing. 89. Table # 42.- Descriptive Statistics for Input Nature and Sourcing Performance Analysis for Multiple Sourcing- PS. 90. Table # 43.- ANOVA for Input Nature and Sourcing Performance for Multiple Sourcing-PS. 90. Table # 44.- Descriptive Statistics for Input Nature and Firm Performance Analysis for Multiple Sourcing- PS. 91. xv.
(17) LIST OF TABLES - Continued. Table # 45.- ANOVA for Input Nature and Firm Performance for Multiple Sourcing-PS. 92. Table # 46.- Descriptive Statistics for Input Nature and Supplier-Buyer Relationship Analysis for Multiple Sourcing-PS. 93. Table # 47.- ANOVA for Input Nature and Supplier-Buyer Relationship for Multiple Sourcing-PS. 94. Table # 48.- Descriptive Statistics for Input Nature and Sourcing Performance Analysis for Multiple Sourcing - ESS. 95. Table # 49.- ANOVA for Input Nature and Sourcing Performance for Multiple Sourcing-ESS. 95. Table # 50.- Descriptive Statistics for Input Nature and Firm Performance Analysis for Multiple Sourcing- ESS. 96. Table #51.- ANOVA for Input Nature and Firm Performance for Multiple Sourcing-ESS. 97. Table # 52.- Descriptive Statistics for Input Nature and Supplier-Buyer Relationship Analysis for Multiple Sourcing-ESS. 98. Table # 53.- ANOVA for Input Nature and Supplier-Buyer Relationship for Multiple Sourcing - ESS. 99. Table # 54.- Descriptive Statistics for Input Nature Effect on Sourcing Strategies and Sourcing Performance Analysis. 100. Table # 55.- ANOVA for Input Nature Effect on Sourcing Strategies and Sourcing Performance. 101. xvi.
(18) LIST OF TABLES - Continued. Table # 56.- Contrast Tests for Input Nature Effect on Sourcing Strategies and Sourcing Performance. 102. Table # 57.- Input Nature and Sourcing Strategy Selection. 104. Table # 58.- Results of Hypotheses HI Testing. 114. Table # 59.- Results of Hypotheses H2 Testing. 136. xvii.
(19) Chapter 1 Introduction and Research Objective. 1.1 Introduction Manufacturing firms require buying inputs in order to make their selling product. As organizations seek to provide products to customers cheaper and faster than the competition, managers have come to realize that they must establish and work with a costeffective and responsive network of suppliers in order to succeed (Dahel, 2003).This requires the design and implementation of effective sourcing strategies. A sourcing strategy is defined as an arrangement to buy an input/component from a supplier base (cf. Kotabe & Zhao, 2002; Zeng, 2000). A buyer can choose a sole sourcing strategy (buying an input from only one supplier), or a multiple sourcing strategy (buying an input from more than one supplier). It may also be possible that the buyer decides to make the item in-house (backward vertical integration). This possibility is out of the scope of this study, since the assumption here is that the buying firm has no option but to buy. The type of sourcing strategy chosen by the buyer defines the nature of the relationship with the supplier. At one extreme, dealing with one supplier (sole sourcing) implies embedded relationships. Embeddedness refers to the process by which social relations shape economic action (Uzzi, 1997; Granovetter, 1985). These kind of supplierbuyer relationships are characterized by long-term contracts and high levels of trust and cooperation. At the other extreme, multiple sourcing implies arm's-length ties. This kind of. 1.
(20) relationships is characterized by impersonal relations, short-term contracts, and is mainly limited to the exchange of data on price, quality, stock availability, and lead times. Each type of sourcing strategy has its own advocates. Some researchers and practitioners strongly promote the reduction of the supplier base and the development of closer relationships with suppliers. Multiple sourcing promoters recommend using arm'slength ties with suppliers and put them into competition against one another to assure low prices and high quality. However, as businesses move toward either sole sourcing or multiple sourcing, they may find those relationships to be costly and the relationships may not produce the promised benefits. That is, either sourcing strategy sometimes facilitates and at other times obstructs exchange (e.g., depending on the nature of the purchased input or the market power of the buyer). So it is probable that when buying multiple inputs, other things being equal, firms may benefit more from a mix of sole and multiple sourcing, rather than either tending towards all sole sourcing or all multiple sourcing. To analyze these issues, we consider the following sourcing performance measures: input price, input quality level, on-time delivery, complete-order delivery, order fulfillment lead time, and supplier responsiveness. The focus is on multiple-input sourcing at the supplier-manufacturer level of the supply chain. The manufacturing firm represents the buyer's role. The unit of analysis is the manufacturing firm. Yin (1994) mentions that the unit of analysis should be similar to those previously studied in the related research. In this manner, the literature review provides a guide for defining the unit of analysis (e.g., Carr & Pearson, 2002). This work is based on a comprehensive theoretical framework that includes transaction cost economics and social network theory.. 2.
(21) The selection of suppliers and the determination of order quantities to be placed with those suppliers are strategic purchasing decisions that commit significant resources and impact the firm's performance (Burton, 1988). A typical industrial buyer spends more than half of every sales dollar on purchased products (Degraeve & Roodhooft, 1999; as cited in Janda & Seshadri, 2001). This significance of the sourcing process makes it relevant for buying firms to understand which sourcing strategy is more effective. As a result, the issue proposed in this work becomes an important subject of investigation. 1.2 Research Objective The purpose of this research is to determine the impact of sourcing strategies on the following sourcing performance outcomes: input price, input quality level, on-time delivery, complete-order delivery, order fulfillment lead time, supplier responsiveness. The focus is on multiple-input sourcing at the supplier-manufacturer level of the supply chain. Of particular importance is the analysis of a mix of sole and multiple sourcing, as well as an analysis of the moderating effect of input nature on the relationship between sourcing strategy and sourcing performance. Within this context, this work can serve three purposes. The first purpose would be that results contribute to a better understanding of the sourcing process in an emerging economy such as Mexico. The second is to provide guidelines to manufacturing firms in the design and implementation of their own sourcing strategies. The third is to provide focus for future research within this area of knowledge. This dissertation is organized as follows. The literature review is presented on chapter two. A description of the theoretical framework is presented on chapter three. The. 3.
(22) theoretical model, the variables considered, and the proposed hypotheses are presented on chapter four. Chapter five explains the research methodology. Chapter six presents the results. Results are discussed on chapter seven. Chapter eight presents study limitations and avenues for future research. Conclusions are presented on chapter nine.. 4.
(23) Chapter 2 Literature Review. There is a substantial literature related with the topic of sourcing strategies, particularly from the fields of operations management, operations research and economics. In order to properly approach this topic, the literature review is organized as follows. Section 2.1 covers the main works that deal with the issues of sole sourcing and multiple sourcing. Section 2.2 deals with sourcing strategies, embedded relationships and arm'slength ties. Section 2.3 covers the issue of sourcing strategies and performance measures. Section 2.4 covers the issue of sourcing strategies and input nature. 2.1 Sole Sourcing and Multiple Sourcing Sole sourcing refers to the strategy where the buyer allocates all the requirements of an input to a single supplier (cf. Elmaghraby, 2000). Multiple sourcing refers to the strategy where the buyer allocates the requirements of an input to more than one supplier (cf. Zeng, 2000). The literature shows that two main views have predominated on the subject of an optimal (i.e. minimum cost) sourcing strategy: one by quality and just-in time promoters, who focus on the cost of achieving quality and timely delivery (e.g., Deming, 1986), and the other by strategy followers, who focus on purchasing costs (e.g., Porter, 1985). Deming (1986) promotes the benefits of sole sourcing, arguing that sole sourcing minimizes the total transaction costs a buyer incurs when quality is of major importance to the buyer and its customers. By dedicating time and resources into establishing one strong and lasting. 5.
(24) relationship, a buyer is able to cut down on costs by avoiding downtime, rework and excessive administration, and increase quality by establishing a relationship that is responsive to the buyer's needs and demands. Porter (1985), on the other hand, claims that total purchasing costs will be minimized by introducing and maintaining competition in the process. This can only be done if the buyer procures from multiple sources. The threat of losing business to another supplier will provide suppliers with the incentive to deliver products of high quality at a low cost. Despite that each sourcing strategy has its own advocates empirical research shows a trend towards sole sourcing. Approaches like total quality management and just-in-time, and concepts like supply chain management and extended enterprise, have motivated the preference towards sole sourcing (Simchi-Levi, Kaminski, & Simchi-Levi, 2003; Richardson & Roumasset, 1995; Zeng, 2000). Richardson and Roumasset (1995) report that "many companies are implementing sole sourcing for major components," and add that GM's Saturn is 100% sole sourced. The 1999 Purchasing magazine survey of procurement professionals indicate that 74% are in favor of sole sourcing (Janda & Seshadri, 2001). Goffin, Szwejczewski, and New (1997) found empirical evidence in UK manufacturing firms, of the trend to reduce the supplier base. The authors also report that, by doing a multiple case study research, they found that a key reason for supplier base reduction is to free time to manage the remaining suppliers more effectively. Szwejczewski, Goffin, Lemke, Pfeiffer, & Lohmiiller (2001) found that German manufacturers expect a reduction of their supplier base. Von Corswant and Fredriksson (2002) based on a survey of car. 6.
(25) manufacturers and first tier suppliers, show that both parties are reducing their supply bases. In terms of quantitative models, the literature can be classified into four categories: a) single selection period/sole sourcing; b) single selection period/multiple sourcing; c) multiple selection periods/sole sourcing; and d) multiple selection periods/multiple sourcing (cf. Elmaghraby, 2000). a) Single Selection Period, Sole Sourcing The single selection period / single supplier model is the most developed and well understood in the area of sourcing arrangements (Elmaghraby, 2000). This category covers auctions and franchise biddings. This means that learning by doing, trust aspects, or sunk investments do not matter, and price is the key consideration in the first case, while a constant assured flow of revenues is the main consideration in the second. Most of the literature on auctions assumes asymmetric information between buyer and bidders. It is typical in this situation, that the buyer pays some information rent to the bidders to induce them to reveal their true cost types (e.g., Myerson, 1981). For a comprehensive review of the auction literature see Klemperer (1999). Franchise bidding literature is concerned with situations where the buyer is interested in selecting a single supplier (via a single selection stage), usually because of the presence of large economies of scale. Representative papers consider a model where the buyer is risk-neutral, suppliers' costs are private information, and suppliers pay a franchise fee that can be a simple scheme, but can also be rather complex (e.g., Riordan & Sappington, 1987).. 7.
(26) b) Single Selection Period, Multiple Sourcing Basically, this category includes models that consider: a) quantity allocation between two suppliers, b) the decision to choose either a sole source or a multiple source. The objective function maximizes the buyer's profit or minimizes the buyer's procurement costs. Representative examples of the models developed in this category are briefly presented. Horowitz (1986) model two suppliers and shows that one supplier's price is known with certainty and the other is uncertain; quantity allocation between suppliers will depend on risk aversion of the buyer. Models have been created that compare sole source contracts and split award contracts, under symmetric information (e.g., Anton & Yao, 1989) and asymmetric information (e.g., Anton & Yao, 1992). Sole sourcing vs. multiple sourcing under asymmetric information has also been modeled, when purchasing quantity is either exogenously determined or endogenously determined by submitted bids (e.g., Dasgupta & Spulber, 1989, 1990). Decision of supplier to submit a bid based on his opportunity cost, under asymmetric information (e.g., Seshadri, Chatterjee, & Lilien, 1991; Greer & Liao, 1986). Models where a buyer considers auctioning product rights to single supplier, two suppliers, or producing the good itself, under asymmetric information (e.g., Dana & Spier, 1994; McGuire & Riordan, 1995). Sole sourcing with incentive contract vs. dual sourcing with cost plus contest arrangement, under the assumption that suppliers can influence production costs by undertaking costly effort (e.g., Seshadri, 1995). c) Multiple Selection Periods, Sole Sourcing This category includes models that consider competition into the procurement process in more than one period, to choose one supplier. Most of them deal with the issue. 8.
(27) of "educational buys." This concept refers to the situation when a buyer wishes to procure an input where the technology for production does not exist in full or the supply base is limited. The models consider the selection of a sole source on the first period to develop the technology. The technology belongs to the buyer, who may choose to transfer it to another supplier for production in the second period. Since technology is not completely transferable, switching costs exist. The objective function minimizes procurement costs or maximizes buyer's profit or social welfare. Some relevant papers are Rob (1986), Stole (1994), Laffont & Tirole (1993), Riordan & Sappington (1989). d) Multiple Selection Periods, Multiple Sourcing This category deals with the issue of selecting suppliers in two periods. In each period, the buyer decides to procure from one or various suppliers, depending on the particular model. The following are examples of relevant papers. Models that consider dual sourcing in repeated procurement competitions, with possibility of suppliers "buying-in" their future gains in period two, and the possibility of entry costs (e.g., Klotz & Chatterjee, 1995). Richardson and Roumasset (1995) propose a model based on agency cost theory to compare sole sourcing vs. multiple sourcing. Their model assumes information symmetry and presence of switching costs for sole sourcing. Dahel (2003) develops a model to determine the number of suppliers to use and the order quantities to allocate to each supplier, in a multiple-product, multiple-supplier competitive sourcing environment. The model, however, does not consider information asymmetry, supplier bargaining power, and/or risk aversion. Several authors have proposed models that deal with the relationship between asset specificity and shifts in bargaining power in sole and multiple sourcing (e.g.,. 9.
(28) Erkal, 2003; Andrabi, Ghatak, & Khwaja, 2002; Bensaou & Anderson, 1999; Kranton & Minehart, 2000). 2.2 Sourcing Strategies, Embedded Relationships and Arm's-Length Ties The nature of the supplier-buyer relationship is defined by the particular sourcing strategy. Under sole sourcing, the buyer chooses to establish a relation with only one supplier. The supplier is selected based on particular attributes like input price, quality, timely delivery, and production capacity (Weber, Current, & Benton, 1991; Dickson, 1966). However, third party referrals and previous personal relations have been found also to be an important selection criterion (Uzzi, 1996). Additionally, this strategy often implies idiosyncratic investments by the parties (cf. Janda & Seshadri, 2001; Bensaou & Anderson, 1999; Lonsdale, 2001), which serve as "anchors" and promote commitment to the relationship. The eventual generation of trust between the parties will maintain an ongoing and exclusive embedded relationship between them (Uzzi, 1996). Embedded relationships or relationally governed relationships, are characterized by a mutually agreed upon governance structure where market forces do not play a central role in determining relationship parameters (Rinehart, Eckert, Handfield, Page, & Atkin, 2004; Uzzi & Lancaster, 2004); instead social relations are the predominant force in these agreements (Uzzi, 1996). Under multiple sourcing, the buyer is assumed to have established ties with more than one supplier. This strategy places the emphasis on achieving the lowest possible input price for a specified quality level (cf. Zeng, 2000). This is achieved by promoting an intense competition among the suppliers. The consequences of this strategy include a large. 10.
(29) base of suppliers, very short duration contracts, and no idiosyncratic investments (Zeng, 2000; Elmaghraby, 2000). The buyer can costlessly switch from one supplier to another (Elmaghraby, 2000; Richardson & Roumasset, 1995), leading to arm's-length ties. Arm'slength ties or market governed relationships are those that generally rely on competitive market forces when determining the specifics of the transaction (Rinehart et al., 2004). These relationships are characterized by traditional transaction practices including low information exchange and standard bidding procedures on an order-by-order basis (Rinehart et al., 2004; Uzzi, 1996). It is common to model the factors that distinguish supplier-buyer relationships using a continuum that compares and contrasts the types of inter-organizational relationships (e.g., Golicic, S., Foggin, J., & Mentzer, J., 2003).. As shown in Figure # 1, these. contractual relations can go from complete ownership systems (vertical integration) on one end to market governed transactions (arm's-length ties) at the other end, with relationally governed systems in the middle (embedded relationships). 2.3 Sourcing Strategies and Performance Measures The relationship between sourcing strategies and sourcing performance has been addressed by several authors, but only within a single-input sourcing context. Sourcing performance has been measured by the ratio of purchasing operating expense to sales revenue (e.g., Seaman, Boyle, & Krause, 1992; as cited in Janda & Seshadri, 2001), input price (e.g., Porter, 1985; Dahel, 2003; Zeng, 2000), quality costs (e.g., Deming, 1986; Dahel, 2003; Zeng, 2000), agency costs (e.g., Richardson & Roumasset, 1995), and on-time delivery (e.g., Deming, 1986; Dahel, 2003; Zeng, 2000). The supply chain operations reference. 11.
(30) model (SCOR), developed by the Supply Chain Council, provides some useful performance measures for the sourcing process. Examples of this metrics are on-time delivery, order fulfillment lead time, fill rate, and supply chain responsiveness (Huan, Sheoran, & Wang, 2004).. Figure # 1.- Transaction-Relationship-Ownership Continuum. General Concepts. Market Governed Situations. Academic Concepts. Conventional Channels. Business Single Applications: Transaction Tradicional Situations Concepts Business Applications: Hybrid Applications. Multiple Transaction Situations. Relationally Governed Situations Administered and Contractual Systems Franchise Systems. Ownership Governed Situations. Partnerships and Alliances. Joint Ventures. Vertical Integration Systems Corporate Systems. Rinehart et al. (2004). The impact of sourcing strategies on the buying firm's performance has also been studied. This has been motivated by several estimates: for a typical industrial buyer, a one percentage-point saving in purchasing costs can improve the margin on sales by half a point (Janda & Seshadri, 2001); between 50 and 70 percent of a manufacturing company's potential value is in purchased items (Zeng, 2000). The buying firm's performance has been measured by profits (e.g., Richardson & Roumasset, 1995; Carr & Pearson, 2002;. 12.
(31) Krishnaswami & Subramaniam, forthcoming), return on assets (e.g., Kannan & Tan, 2002; Ellram, Zsidisin, Siferd, & Stanly, 2002), and market share (e.g., Kannan & Tan, 2002; Ellram et al., 2002; Carr & Pearson, 2002). Research results indicate, that the impact of a sourcing strategy on firm's performance is industry dependent (Ellram et al., 2002). The focus of much of the research has been the study of sole sourcing and its embedded relationships. This strategy has grown in number and importance within the realm of business-to-business transactions (Rinehart et al, 2004; Golicic et al., 2003; Cannon & Perreault, 1999). However, sole sourcing with embedded relationships sometimes results more costly than multiple sourcing with arm's-length ties (cf. Richardson & Roumasset, 1995; Uzzi, 1996). Considering multiple-input sourcing, some authors suggest the use of a mix strategy (e.g., Ritzman & Krajewski, 2003; Pyke & Johnson, 2002) as a valuable alternative. That is, other things being equal, firms may benefit more from a mix of sole and multiple sourcing, rather than either tending towards all sole sourcing or all multiple sourcing. However, there is a lack of empirical studies that test the impact of a mix sourcing strategy on particular performance outcomes. 2.4 Sourcing Strategies and Input Nature The nature of the purchased input is known to affect the decision to choose a particular sourcing strategy (Quayle, 2002; Tullous & Utecht, 1992). Ansari and Heckel (1987; as cited in Zeng, 2000) based on their empirical investigations in a few leading companies, suggest that A-products classified by ABC-inventory analysis be purchased by a single source. Hill (1972; 1973; as cited in Xideas & Moschuris, 1998) first proposed the. 13.
(32) complexity of the product as an important dimension and stressed its effect on the composition of the buying center. High complexity or buyer-specific inputs that are of strategic importance for the buyer, tend to benefit from a sole sourcing strategy; low complexity or commodity-type of inputs, benefit from a multiple sourcing strategy (cf. Pyke & Johnson, 2002; Bensaou & Anderson, 1999; Quayle, 2002; Tullous & Utecht, 1992). Campbell (1985; as cited in Xideas & Moschuris, 1998) built a supplier-buyer interaction model incorporating as a key dimension product complexity, and assumed that the higher the product complexity the higher the degree of interdependence between buyer and supplier. According to Quayle (2002), other variables that influence the decision to choose between sole or multiple sourcing are: buyer's organizational culture and policy, geography, quality, trust, protection of supply source, price competition, and possibly buyer inertia. Treleven and Schweikhart (1988) describe various types of sourcing arrangements and risk/benefits of each with respect to five buyer concerns: disruption of supply, price escalation, inventory and scheduling, technology access, and quality. The most frequently cited reason behind adopting a particular sourcing strategy is the reduction of uncertainty within one of those concerns. Min and Galle (1991; as cited in Quayle, 2002) mention that product and supplier information used by buyers to choose a source of supply influences their preferences of sourcing strategy.. 14.
(33) Chapter 3 Theoretical Framework. To analyze the impact of sourcing strategies on several sourcing performance outcomes, we combine transaction cost economics and social network theory. The combination of economic and sociological theories has been used by several authors (e.g., Ouchi, 1980; Gulati, 1995; Becerra & Gupta, 1999; Young-Ybarra & Wiersema, 1999). This approach improves the descriptive and explanatory power of theories (Becerra & Gupta, 1999). 3.1 Transaction Cost Economics Transaction cost economics (TCE) addresses the proposition that firms have the main purpose of economizing on transaction costs (Williamson, 1985). Transaction costs include the costs of negotiating, monitoring, and enforcing a contract (Hill, 1990). This theory rests on the behavioral assumptions of bounded rationality (limits on cognitive competence) and opportunism (self-interest seeking with guile) (Williamson, 1985). Rather than characterize the firm as a production function, TCE maintains that the firm is more usefully regarded as a governance structure (Williamson, 1985). Specific institutional arrangements emerge in response to various transactional considerations in order to minimize the total cost of making transactions. Transactions can range from arm's-length ties to vertical integration. The specific set of institutional arrangements chosen would represent the governance structure that minimizes the total cost of consummating the transactions of interest (Williamson, 1985). It is well established that the existence of assets. 15.
(34) specific to a relationship influences the choice of governance structure, including the use of contractual safeguards (Bensaou & Anderson, 1999). Williamson (1985) studied the concept of asset specificity and defines it as "durable investments that are undertaken in support of particular transactions". According to Joskow (1993), the cumulative evidence supports the proposition that the governance of contractual relations varies systematically with the degree of asset specificity. Thus arm's-length ties are preponderantly used to mediate nonspecific transactions; embedded relationships appear as asset specificity builds up. The investment in specific assets by the parties involved serves to create credible commitments and attenuates opportunism (Bensaou & Anderson, 1999). It also affects bargaining power between the parties (Lonsdale, 2001). 3.2 Social Network Theory Social network theory (SNT) is based on the concept of "embeddedness". Embeddedness refers to the process by which social relations shape economic action (Uzzi, 1997; Granovetter, 1985). This theory argues that buyers and suppliers engaged in embedded relationships, satisfy rather than maximize on price (Uzzi, 1997). The parties shift their focus from the narrow economically rational goal of winning immediate gain and exploiting dependency, to cultivating long-term and cooperative relations. (Uzzi, 1997; Uzzi & Lancaster, 2004). Embedded relationships have three features: trust, fine-grained information transfer, and joint problem-solving arrangements (Uzzi, 1996). Trust helps reduce transactional uncertainty and creates opportunities for the exchange of goods and services that are difficult to price or enforce contractually (Uzzi, 1996). It also promotes inter-organizational cooperation (Ring & Van de Ven, 1994; as cited in Becerra & Gupta,. 16.
(35) 1999). Information exchange in embedded relationships includes strategic and tacit knowhow, and is considered more proprietary and more holistic than the information exchange at arm's-length ties (Uzzi, 1996; Uzzi, 1997). Embedded relationships entail joint problemsolving arrangements that enable firms to work through problems and to accelerate learning and problem correction (Uzzi, 1996). 3.3 Linking Sole Sourcing and Multiple Sourcing Strategies to Theoretical Framework Table # 1 shows how the characteristics of each sourcing strategy are linked to the theories applied in this work.. Table # 1.- Linking Sourcing Strategies to Theoretical Framework Sole Sourcing. Multiple Sourcing. High relevance of trust (SNT). Low relevance of trust (SNT). Cooperation and reciprocity (SNT). Self interested behavior (SNT). Satisfy on price (SNT). Push for lowest price possible (SNT). Fine-grained information exchange (SNT). Price & Quality information exchange (SNT). Problem-solving approach (SNT). Exit when problems arise (SNT). High asset specificity (TCE). Low asset specificity (TCE). High switching costs (TCE). Low switching costs (TCE). Hostage situation (TCE). No hostage situation (TCE). Long-term relationships (SNT). Short-term relationships (SNT). Opportunism risk (TCE). Low opportunism risk (TCE). High capacity for buyer's specific solutions (TCE/SNT). Low capacity for buyer's specific solutions (TCE/SNT). * TCE = Transaction Cost Economics; SNT = Social Network Theory. 17.
(36) Chapter 4 Theoretical Model, Variables, and Hypotheses. This section presents the theoretical model, the variables considered for the study, and the proposed hypotheses. 4.1 Theoretical Model The relationship between sourcing strategy, sourcing performance, and input nature is represented as a model in Figure # 2.. Figure # 2.- Theoretical Model. Input Nature. Sourcing Performance. Sourcing Strategy. Input price • Input quality level • On-time delivery 1 Complete-order delivery 1 Order fulfillment lead time • Supplier responsiveness. • Sole Sourcing • Mix Sourcing 1. High Complexity / Buyer-specific Low Complexity / Commodity. Multiple Sourcing. 18.
(37) 4.2 Variables and Operational Definitions As shown in the model on figure 2, sourcing strategy is the independent variable. It is defined as the arrangement to buy an input from a supplier base (cf. Kotabe & Zhao, 2002; Zeng, 2000). It takes into account the number of suppliers used to source an input (i.e., using a sole supplier or multiple suppliers) and the quantity allocated to each supplier (i.e., assigning most of the input requirements to a preferred supplier or equally dividing the input requirements between the selected suppliers). When buying multiple inputs, the following sourcing strategies are considered: sole sourcing for each input, mix sourcing (i.e., sole source some inputs and multiple source other inputs), multiple sourcing with a preferred supplier for each input, and multiple sourcing with equally-split suppliers for each input. In this case, the analysis considers only the sourcing strategies used to buy the three most important inputs; that is, those that represent the highest percentage of purchasing expense. A nominal scale is used to operationalize this variable (see item B on the questionnaire in Appendix C). The following sourcing performance measures are considered: Input price, input quality level, on-time delivery, complete-order delivery, order fulfillment lead time, and supplier responsiveness. These measures, as shown in the model on figure 2, are all dependent variables. Input price is defined as the monetary value of the input (cf. Uzzi & Lancaster, 2004). Input quality level is defined as the percentage of defect-free items delivered by the supplier (cf. Ritzman & Krajewski, 2003). On-time delivery is defined as the percentage of orders delivered on the specified date (cf. Simchi-Levi et al., 2003; Ritzman & Krajewski, 2003). Complete-order delivery is defined as the percentage of. 19.
(38) orders delivered with the correct quantity of units (cf. Huan et al., 2004; Simchi-Levi et al., 2003; Ritzman & Krajewski, 2003). Order fulfillment lead time is defined as the number of days between order placement and delivery (cf. Huan et al., 2004; Simchi-Levi et al., 2003; Ritzman & Krajewski, 2003). Supplier responsiveness is defined as the number of days it takes a supplier to respond to emergencies, problems, and/or unexpected customer demand changes (cf. Geary & Zonnenberg, 2000). Sourcing performance outcomes are ordinal variables measured by 5-point Likert scales (see items Dl to D18 on the questionnaire in Appendix C). Input nature, as shown in the model on figure 2, behaves as a moderating variable between sourcing strategy and each of the sourcing performance outcomes. It is defined as the basic character of the items (i.e. high complexity/buyer-specific products or a low complexity/commodity products; cf. Tullous & Utecht, 1992). Only the nature of the three most important inputs is considered. This is an ordinal variable measured by a 5-point Likert scale (see item Cl on the questionnaire in Appendix C). 4.3 Research Hypotheses 4.3.1 Sole Sourcing Strategies This first argument is developed in reference to sole sourcing strategies. Sole sourcing relies on embedded relationships. On this type of sourcing strategy, the buyer establishes a strong and long term relationship with a single supplier. Trust is a binding component in sole sourcing enabling cooperation and thick information sharing. Buyers and suppliers invest in assets specific to the transaction, therefore developing a strong commitment to work together. These specialized assets have the capacity to generate. 20.
(39) enormous added value for the buyer, both in terms of product differentiation and cost savings. This creates a high-incentive environment towards problem-solving approaches, and development of buyer'-specific solutions. Sole sourcing leads to low supplier managing costs and low search costs of new suppliers. This sourcing strategy is better suited for highcomplexity and buyer-specific inputs. However, if sole sourcing is considered as the only strategy when buying multiple inputs, the problems associated with this approach will undermine sourcing performance. This is especially relevant when some of the inputs been purchased are standardized products. Also, the high-trust environment of sole sourcing, presents enhanced chance for opportunism. The more complete the trust, the greater the potential gain from opportunism. So even though opportunistic behavior is infrequent in embedded relationships, it does occur. Williamson (1985) did not claim that all actors will behave opportunistically; he merely suggested that the probability of opportunism occurring increases as asset specificity increases. And due to bounded rationality and uncertainty, it is difficult to distinguish actors who will cooperate and trust from those who will behave opportunistically. Also, making substantial investments in a relationship with a sole source increases the buyer's dependence on the supplier. Switching costs are high, and the buyer's ability to threaten the supplier with a loss of business is reduced. Without competitive pressure the supplier has the opportunity to hold up the buyer with increased prices, lower quality, and generally lower performance. Indeed, the supplier can literally stop the buyer's factory, and can even do so without any malice. Equipment breakdowns, factory fires, material disruptions, among many other problems can affect the supplier. So,. 21.
(40) sole sourcing makes the buyer vulnerable. Even when there is no opportunism, there is dependence, making it difficult for the buyer to disengage as circumstances change. Thus, this argument leads to the expectation that sole sourcing has an impact on sourcing performance outcomes. Moreover, the nature of the input affects the relationship between sole sourcing and a particular sourcing performance outcome. 4.3.2 Multiple Sourcing Strategies The second argument is developed in reference to multiple sourcing strategies. Multiple sourcing relies on arm's-length ties. On this kind of sourcing strategy, buyers push for the lowest input price possible by competing suppliers against each other. Business relations with suppliers are usually short term, involving no commitment by either party besides the transaction. There is a lower risk of supply disruption for the buyer, since relations are established with multiple suppliers; therefore, the buyer is less dependent on a particular supplier. Buyers and suppliers rarely invest in assets specific to the transaction, and therefore buyers can switch suppliers at low cost. If problems arise in the transaction, buyers are expected to exit, since there are low incentives for problem-solving approaches in the relationship. In general, the writing of comprehensive contracts is easier with these strategies, as compared to sole sourcing. These characteristics are advantageous under certain circumstances. One of these circumstances is the sourcing of low complexity and commodity-type of products. However, considering multiple sourcing as the only strategy when buying multiple inputs, can lead to performance problems for the buyer. This is especially relevant when some of the inputs been purchased are high-complexity and buyerspecific products. With multiple sourcing strategies, buyers can incur higher costs due to. 22.
(41) managing different suppliers. There is a higher risk of quality problems, since there is no guarantee to suppliers of future transactions with the buyer, so there are low incentives to excel in quality. This leads to higher costs due to reworks, scrap, and warranty claims. Since there are no strong ties between buyer and suppliers, learning about one another's production processes and needs is difficult. Therefore, buyers can hardly acquire businessspecific products with a multiple sourcing strategy. Also, the lack of asset specificity in the transactions makes technology transfer and coordination in design and production activities, virtually impossible. This is an important issue, since the effect of sourcing in overall product design with respect to costs, quality, and availability of parts and materials is significant. Thus, this argument leads to the expectation that multiple sourcing has an impact on sourcing performance outcomes. Moreover, the nature of the input affects the relationship between multiple sourcing and a particular sourcing performance outcome. 4.3.3 Mix of Sole sourcing and Multiple Sourcing Strategies Besides sole and multiple sourcing, a buying firm has the option of applying a mix approach. That is, sole sourcing for some inputs and multiple sourcing for other inputs. Theoretically, a mix strategy can help to countervail the disadvantages of sole and multiple sourcing, while enhancing the advantages. This is especially relevant when some of the inputs being purchased are high-complexity and buyer-specific products, while others are low-complexity and standardized products. For high-complexity and buyer-specific inputs, the buyer benefits from trust, joint problem solving, and thick information sharing, while applying sole sourcing. For low-complexity and standardized products, the buyer benefits. 23.
(42) from low prices, wide access to information circulating in the market, and an enlarged ability to test new trading partners, when multiple sourcing is used. This suggest that buyers that use a mix of sole and multiple sourcing have the greatest adaptive capacity because sole sourcing facilitates coordination and resource pooling, while multiple sourcing prevents insulation from market imperatives and excessive dependence on particular suppliers. However, the optimum mix of sole and multiple sourcing will be moderated by the nature of the purchased inputs. That is, when most of the purchased inputs are highcomplexity products, the optimum mix will tend towards sole sourcing. And, when most of the purchased inputs are low-complexity products, the optimum mix will tend towards multiple sourcing. Thus, this argument leads to the expectation that a mix sourcing strategy has an impact on sourcing performance outcomes. Moreover, the nature of the input affects the relationship between a mix sourcing strategy and a particular sourcing performance outcome. 4.3.4 Proposed Hypotheses Therefore, after reviewing the different sourcing scenarios, the proposed hypotheses are stated as follows: Hla: When buying multiple inputs, other things being equal, sourcing strategy has an impact on input price. Hlb: When buying multiple inputs, other things being equal, sourcing strategy has an impact on input quality level.. 24.
(43) Hlc: When buying multiple inputs, other things being equal, sourcing strategy has an impact on on-time delivery. Hid: When buying multiple inputs, other things being equal, sourcing strategy has an impact on complete-order delivery. Hie: When buying multiple inputs, other things being equal, sourcing strategy has an impact on order fulfillment lead time. Hlf: When buying multiple inputs, other things being equal, sourcing strategy has an impact on supplier responsiveness. H2a: The nature of the input has an impact on the relationship between sourcing strategy and input price. H2b: The nature of the input has an impact on the relationship between sourcing strategy and input quality level. H2c: The nature of the input has an impact on the relationship between sourcing strategy and on-time delivery. H2d: The nature of the input has an impact on the relationship between sourcing strategy and complete-order delivery. H2e: The nature of the input has an impact on the relationship between sourcing strategy and order fulfillment lead time. H2f: The nature of the input has an impact on the relationship between sourcing strategy and supplier responsiveness.. 25.
(44) Chapter 5 Research Methodology. 5.7 Data Collection This empirical study relies on a survey to gather the relevant data Survey research is a frequently used methodology in the social sciences. In its basic form, the researcher selects a sample of respondents and administers a standardized questionnaire to them (Babbie, 2001). Surveys may be used for exploratory and descriptive purposes (Yin, 1994; Ellram, 1996); although Babbie (2001) mentions that this methodology can also be used for explanatory purposes. This method allows for statistical analysis (Meredith, Raturi, Amoako-Gyampah, & Kaplan, 1989). Survey research is probably the best method available to the researcher who is interested in collecting original data for describing a population too large to be observed directly (Babbie, 2001). Careful probability sampling provides a group of respondents whose characteristics may be taken to reflect those of the larger population, and carefully constructed standardized questionnaires provide data in the same form from all respondents (Babbie, 2001; Fowler, 2002). It is more efficient and cost effective than other alternatives (e.g., case studies; Meredith et al., 1989; Yin, 1994). This is particularly true at a distance, because once properly designed, the survey can be sent to a large number of respondents with little extra cost. For this project the original questions are "What is the effect of sourcing strategies on several sourcing performance outcomes?" and "How much impact has sourcing. 26.
(45) strategies on sourcing performance outcomes?" If a research question focuses on "what" and "how much" questions, it means that the study is descriptive (Yin, 1994; Ellram, 1996). As already mentioned, several authors assert that the most appropriate methodology for a descriptive research is a survey (e.g., Yin, 1994; Ellram, 1996; Babbie, 2001). This is one reason for using a survey methodology for this research project. Another reason for applying a survey to collect the data, is that previous related research widely applies survey using the same unit of analysis (e.g., Carr & Pearson, 2002; Andrabi, Ghatak, & Khwaja, 2002; Bensaou & Anderson, 1999; Ellram et al., 2002; Halley & Nollet, 2002; Janda & Seshadri, 2001; Joshi & Campbell, 2003; Kannan & Tan, 2002; Kotabe & Zhao, 2002; Quayle, 2002). Yin (1994) proposes four tests to establish the quality of any empirical social research: construct validity, internal validity, external validity, and reliability. Construct validity refers to establishing the correct operational measures for the concepts being studied (i.e., that the questionnaire measures what the researcher intends). Internal validity means that a causal relationship is the result of the intended variables and not exogenous variables. External validity establishes the domain to which a study's findings can be generalized. Reliability implies that research method can be repeated with the same results. To address the problems of construct validity and reliability, Fowler (2002) recommends designing a good survey instrument. Designing a good survey instrument involves selecting the questions needed to meet the research objectives, evaluate them to make sure they can be asked and answered as planned, and then putting them into a form to maximize the ease With which respondents can answer (Fowler, 2002).. 27.
(46) To achieve this goal, the questionnaire was carefully developed based on the related literature and on the suggestions made by Dillman (2000). The items were designed to measure the effect of sourcing strategies on several performance outcomes for the sourcing process. Also, questions regarding demographic information were included (e.g., respondent's position, number of employees in the firm, industry sector to which the manufacturer belongs, etc.). Once the draft of the questionnaire was ready, it was evaluated in two stages. The first stage consisted on two focus group discussions with six people with sourcing and survey research expertise. The focus group sessions followed the protocol included in Appendix A, and were made according to Fowler (2002) and Kinnear and Taylor (1996). As a result of the focus group some questions were reworded or deleted to improve validity and clarity, and the format of the questionnaire was improved. The second stage used the Q-Sort method. This technique is an iterative process in which the degree of agreement between judges forms the basis of assessing questionnaire items and is an appropriate technique to deal with construct validity and reliability (see Nahm, Solis-Galvan, Rao, & Ragu-Nathan, 2002). Two people with sourcing expertise participated in this method following the procedure included in Appendix B. This number of participants is considered adequate (cf. Nahm et al, 2002). The results from this method were the following: inter-judge raw agreement 74%, judge 1 hit ratio 84%, judge 2 hit ratio 82%, and overall hit ratio 83%. These values are considered acceptable and indicate an appropriate level of reliability and construct validity (cf. Nahm et al., 2002). The Q-sort. 28.
(47) participants are considered representative of the intended survey respondents, since they hold managerial positions in the operations department of two manufacturing firms. Since the data were collected in Mexico, the translation process of the questionnaire was validated using the "back-translation" procedure according to Spina & Zotteri (2001) and Nishiguchi (1994). The draft was developed in English. It was translated into Spanish, and then back-translated to English for validation. The resulting draft in Spanish was used for the evaluation procedure. After the focus group and the Q-sort method, an improved version in Spanish was obtained. This was the final draft used for the survey. The English version of this final draft (also subjected to "back-translation") is included in Appendix C. The issues of internal and external validity were addressed. following. recommendations by Fowler (2002): definition of population and appropriate sample frame, and application of a right sampling procedure to obtain a representative sample and reduce sampling bias. A population can be considered as the group or collection that we are interested in generalizing about (Babbie, 2001). For this study, manufacturing firms in Mexico are considered the population. Once the population was defined, a sampling design that included a judgment sample and a simple random sample was conducted. The judgment sample consisted in five manufacturing firms. These firms were selected in a non-probability mode, based on the judgment of the researcher as been representative of the population of study (Anderson, Sweeney, & Williams, 2003; Babbie, 2001). Data were collected via a combination of personal and telephone interviews. This. 29.
(48) sample was used as a field pretest for the questionnaire. All respondents were able to understand and answer all the questions without any difficulty. In this sense, the questionnaire was validated and suffered no additional modifications. After the judgment sampling, simple random sampling was applied. This probability sampling technique, when adequately done, is an appropriate way to obtain representative samples and reduce sampling bias (Mendenhall, Reinmuth, & Beaver, 1993; Babbie, 2001). The "C&mara de la Industria de la Transformacion de Nuevo Leon" (CAINTRA) professional association was used as the sample frame. The CAINTRA sample frame included 2654 manufacturing firms. A sample size of 93 firms was determined according to Mendenhall et al. (1993) and Dillman (2000), considering a 95% confidence level and a 10% sampling error. An initial random sample of 200 manufacturing firms was obtained. This list was validated and left 130 usable firms, after eliminating for wrong telephone numbers and out-of-business firms. Data were collected using only telephone interviews, due to lower unit costs and shorter collection periods than personal interviews (Fowler, 2002). Ninety five of the one hundred and thirty firms answered the questionnaire, for a response rate of 73%. As pointed out by Flynn, Sakakibara, Schroeder, Bates, and Flynn (1990), a response rate equal to or in excess of 50% justifies not testing for nonrespondents. However, testing for non-response bias is important for verifying the accuracy of the survey. In this case, to test for non-response bias, demographics differences between respondents and non-respondents were assessed (Fowler, 2002). Difference in the number of employees was examined by a t-test (a = 0.05), and yielded no statistically significant. 30.
(49) difference. In addition, a comparison of industry-type between respondents and nonrespondents showed a very similar distribution (see Table # 2). Both analyses suggested that non-response bias was not present.. Table # 2.- Industry Distribution for Respondents and Non-respondents INDUSTRY Automotive Beverage Chemical Food Furniture Machinery Metalmechanic Paper Plastics Textile TOTAL. RESPONSE FIRMS Percentage Ranking 1.05% 10 9 3.20% 1 24.20% 12.60% 3 9.50% 5 12.60% 3 9.50% 5 7 5.30% 2 16.90% 7 5.30% 100%. NON-RESPONSE FIRMS Percentage Ranking 10 0.00% 10 0.00% 1 31.40% 7 5.70% 4 11.40% 8.50% 5 14.20% 3 5 8.50% 2 20.00% 0.00% 10 100%. 5.2 Data Analysis To analyze the data obtained by the survey, the following techniques were used: fector analysis, cluster analysis, and analysis of variance (ANOVA). 5.2.1 Factor Analysis Factor analysis is a technique that helps to accomplish the following objectives: 1) identify the smallest number of common factors (i.e., the most parsimonious factor model) that best explain or account for the correlations among several indicators; 2) identify, via fector rotations, the most plausible fector solution; 3) estimate the pattern and structure. 31.
(50) loadings, communalities, and the unique variances of the indicators; and 4) provide an interpretation of the common factors (Sharma, 1996). In this case, factor analysis was carried out to empirically test the sourcing performance constructs (input price, input quality level, on-time delivery, complete-order delivery, order fulfillment lead time, and supplier responsiveness). That is, to reduce items Dl to D18 to a smaller number of underlying sourcing performance factors (see the questionnaire in Appendix C). This approach is similar to the one used by Kannan and Tan (2002). The Kaiser-Meyer-Olkin measure of sampling adequacy and the Bartlett test of sphericity were applied to validate the use of factor analysis. Principal component analysis was used to extract the factors (eigenvalue greaterthan-one rule and scree plot). This method begins by finding a linear combination of variables (a component) that accounts for as much variation in the original variables as possible. It then finds another component that accounts for as much of the remaining variation as possible and is uncorrelated with the previous component; continuing in this way until there are as many components as original variables. Usually a few components will account for most of the variation. To obtain a more interpretable factor matrix the Varimax rotation method was used. In the Varimax rotation the major objective is to have a factor structure in which each variable loads highly on one and only one factor (Sharma, 1996). That is, a given variable should have a high loading on one factor and near zero loadings on other factors. Such a factor structure will result in each factor representing a distinct construct.. 32.
(51) 5.2.2 Cluster Analysis Cluster analysis is a technique used for combining observations into groups such that: 1) each group or cluster is homogeneous with respect to certain characteristics and 2) each group should be different from other groups with respect to the same characteristics. (Sharma,1996). That is, within each cluster, observations (firms in this case) are similar to each other with respect to particular characteristics; and among clusters, observations should be different with respect to the same characteristics. The first step in cluster analysis is to select a measure of similarity. In this case, the clustering variables are sourcing strategy and input nature. The technique comes up first with a clustering solution where groups of firms have similar sourcing strategies (e.g., a cluster of firms that apply sole sourcing). This enables the researcher to analyze the effect of sourcing strategies on sourcing performance outcomes. A second clustering solution contains groups of firms that have similar sourcing strategies and buy inputs of similar nature (e.g., a cluster of firms with sole sourcing and high complexity inputs). In this way, the moderating effect of input nature on sourcing performance outcomes is assessed. The cluster analysis uses a combination of hierarchical and non-hierarchical techniques. The hierarchical method is used in an exploratory sense, and the resulting solution is submitted to a non-hierarchical method to further refine the cluster solution. However, in this case, the cluster solutions were straightforward, so only a non-hierarchical approach (fc-means cluster) was conducted. The intention was only to corroborate the intuitive clustering. Cluster center distances were used as a measure of solution adequacy.. 33.
(52) 5.2.3 Analysis of Variance (ANOVA) Once the factor structure of items on Section D was ready and the clusters were defined, the effect of sourcing strategies on the different sourcing performance outcomes of the firms was studied using ANOVA. The idea is to determine if the clusters are significantly different with respect to the sourcing performance variables (e.g., sole sourcing cluster, mix sourcing cluster, and multiple sourcing clusters are significantly different with respect to input price). This analysis also enables to observe the moderating effect of the input nature variable (e.g., how input prices differ between the sole sourcing/low complexity cluster and the sole sourcing/very low complexity cluster). In this way, the effect of sourcing strategies on the sourcing performance outcomes of the manufacturing firms is evaluated. Additionally, ANOVA was conducted on firm economic performance variables (i.e., return on assets, market share, and profit margin before taxes; see items Fl to F6 on the questionnaire in Appendix C), and on supplier-buyer relationship variables (i.e., trust, information sharing, information technology, problem-solving approach, buyer-specific solutions, co-investment, site specificity, long/short term relationships, opportunism risk, switching behavior; see items El to El0 on the questionnaire in Appendix C). Differences between groups were analyzed using means plots and F-tests. To verify the homogeneity of variances assumption, the Levene test was performed. For those variables where variances were less homogeneous, the Welch test was done. This test is more powerful than the standard F or the Brown-Forsythe, when sample sizes and variances are unequal (Sharma, 1996). Also, contrast analyses were made for pair-wise. 34.
(53) multiple comparisons between the clusters, with respect to performance and relationship variables. The analyses were made using alpha values of 0.05 and 0.10.. 35.
(54) Chapter 6 Results. 6.1 Demographics of Respondents Demographics information for the 100 firms that participated in the survey (5 from the judgment sample & 95 from the simple random sample) includes the following: data regarding the respondents' position on the firm, firm size (measured in number of employees), and industry to which the respondent firm belongs. Annual sales information is shown only for the judgment sample, since for the simple random sample, only 10% of the participants agreed to reveal this information. 6.1.1 Judgment Sample Respondents The five manufacturing firms from the judgment sample varied in size from 35 employees to almost 14,000 employees, with a mean of 3,311. The rank of the interviewees was also very diverse, ranging from strategic-level positions (e.g., technical director & general manager) to operational positions (e.g., import/export coordinator). The complete demographics information is shown in Table # 3. 6.1.2 Simple Random Sample Respondents Regarding the rank of the interviewees from the random sample, the positions range from strategic-level (e.g., general manager) to tactical (e.g., purchasing manager) and operational (e.g., purchasing coordinator). As seen on Table # 4, approximately 37% of the respondents were general managers, 20% were purchasing managers, and almost 38% were. 36.
(55) purchasing coordinators. This means that all participants were potentially knowledgeable of the issues asked in the survey and could answer reasonably.. Table # 3.- Judgment Sample Respondents' Demographics FIRM. RESPONDENT POSITION. FIRM SIZE (Employees). INDUSTRY. ANNUAL SALES (in Dollars). J1 J2 J3 J4 J5. Technical Director Business Manager Import/Export Coordinator Business Manager General Manager. 13,968 1500 1000 35 52. Beverage Beverage Machinery Paper Furniture. $990 millon $80 million $60 million NA $2 million. Table # 4.- Random Sample Respondents' Position Distribution RESPONDENT POSITION General Manager Business Manager Purchasing Manager Marketing Manager Warehouse Manager Purchasing Coordinator Materials Coordinator TOTAL. NUMBER OF FIRMS 35 2 19 1 1 36 1 95. PERCENTAGE 36.84% 2.10% 20.00% 1.05% 1.05% 37.89% 1.05% 100%. The ninety five manufacturing firms from the simple random sample varied in size from 3 employees to 900 employees, with a mean of 118. For the firm size distribution, I found useful to apply the CAINTRA classification. CATNTRA classifies firms in four sizes: micro (from 1 to 10 employees), small (from 11 to 50 employees), medium (from 51 to 250 employees), and large (more than 250 employees). As seen on Table # 5, participating firms were almost evenly distributed among the four firm sizes. This indicates. 37.
(56) that firms of all sizes were represented in the study; therefore, reducing any bias due to firm size and making results potentially generalizable to firms of any size.. Table # 5.- Random Sample Firm Size Distribution FIRM SIZE 1-10 employees 11 - 50 employees 51 - 250 employees More than 250 employees TOTAL. NUMBER OF FIRMS 21 34 22 18 95. PERCENTAGE 22.10% 35.80% 23.20% 18.90% 100%. In relation to the different industries represented in this study, 24% of the participating firms belong to the chemical industry, followed by the plastics industry with almost 17%, food industry and machinery industry, both with approximately 13% each. As shown in Table # 6, the diversity of industries represented in the random sample, is relevant in the sense that results are potentially generalizable to various industry-settings and an ample range of material inputs.. Table # 6.- Random Sample Industry Distribution INDUSTRY Automotive Beverage Chemical Food Furniture Machinery Metalmechanic Paper Plastics Textile TOTAL. NUMBER OF FIRMS 1 3 23 12 9 12 9 5 16 5 95. 38. PERCENTAGE 1.05% 3.20% 24.20% 12.60% 9.50% 12.60% 9.50% 5.30% 16.90% 5.30% 100%.
(57) 6.2 Factor Analysis Factor analysis was used to reduce 18 variables (i.e., items Dl to D18; see the questionnaire in Appendix C) to a smaller set of sourcing performance factors. An initial factor solution revealed that 4 variables (D5, D9, D16, D18) were redundant; so they were omitted from subsequent analysis. A final factor solution of six components was chosen. This solution was theoretically sound and evaluated by the appropriate statistical measures. The Kaiser-Meyer-Olkin (KMO) measure of sampling adequacy and the Bartlett's test of sphericity validated the adequacy of factor analysis for this dataset. KMO had a value of 0.713. This value indicates the proportion of variance in the variables that might be caused by the underlying factors. It is suggested that the KMO value should be above 0.60 for the analysis to be useful (Sharma, 1996). The Bartlett's test of sphericity had a significance value of cero. This measure tests the hypothesis that the correlation matrix is an identity matrix, which would indicate that the variables are unrelated and therefore unsuitable for structure detection. So, small values (less than 0.50) of the significance level indicate that a factor analysis is useful with the data. Factors were extracted using Principal Components Analysis, and applying as guidelines the eigenvalue. greater-than-one rule and the scree plot. Extraction. communalities were all high (i.e., higher than 0.80), which indicates that the extracted components represent the variables well (see Table # 7). Of the six chosen components, four had eigenvalues higher than one (see Table # 8). Besides the eigenvalue greater-thanone rule, the scree plot also helps to determine the optimal number of components. The. 39.
(58) eigenvalue of each component in the initial solution is plotted. Generally, you want to extract the components on the steep slope. The components on the shallow slope contribute little to the solution. So in this case, the scree plot shows that choosing six components is an appropriate decision (see Figure # 3). The six chosen factors accounted for 97% of the total variance (see Table # 8). This means that complexity of the dataset has been reduced by using six factors, with only 3% loss of information. The factor matrix was rotated using the Varimax method. As shown in Table # 8, the rotation maintains the cumulative percentage of variation explained by the extracted components, but that variation is now spread more evenly over the components. Large changes in the individual totals suggest that the rotated component matrix is easier to interpret than the un-rotated matrix. Rotation converged in 5 iterations. The suggested guideline, according to Sharma (1996), is to achieve convergence in less than 30 iterations. In this case, this means that data was suitable for factor analysis.. 40.
Figure

Documento similar
In the preparation of this report, the Venice Commission has relied on the comments of its rapporteurs; its recently adopted Report on Respect for Democracy, Human Rights and the Rule
This thesis is an empirical research based on an ethnographic and a theory- seeking approach. This study aims to analyze the progress and the challenges of
An overview of the literature on input indicates two ways of making input comprehensible: the first one is to premodify input before it is offered to the learner, (premodified
Therefore, the main goal of this work is to analyze the performance and the optimal system configuration update strategies over different time functions-based signature
• Theoretical framework: The research model shows the direct relationships between the internalization of quality standards and environmental practices and performance, and
The drivers that short the motor are determined by the logic level at the DIRECTION input (Pin 3): with Pin 3 logic high, both current sourcing output transistors are ON; with Pin
We argue that this approach has significantly higher potential for runtime- and energy savings than the previously proposed strategies for three reasons: (1) since the performance
The purpose of this research is to analyze the features of English as a Lingua Franca (ELF) interactions in travel blogs and explore some strategies used by participants in blog
