TítuloDepressive symptoms and other factors associated with poor self rated health in the elderly: gender differences
9
0
0
Texto completo
(2) In regard to sociodemographic variables, a relationship has been established between having a good SRH and being socially integrated and having an efficient network of friends.17 Relationships between other sociodemographic variables, such as age and gender, and SRH are unclear,12,14,18,19 although some studies have found worse perceptions among older people and women. The main purpose of this study was to identify the factors associated with poor SRH among a representative sample of non-institutionalized elderly people in Spain. We tested the hypothesis that poor SRH is associated with not only health (physical, psychological and functional) factors but also sociodemographic and social determinants. Materials and methods We conducted a cross-sectional study including a representative sample of 600 community-dwelling residents of Narón Council (A Coruña, Spain), aged 65 years and older. They were selected from the municipal register using a random number table arranged by 5-year age groups and sex. The level of confidence was 95%, the sampling error was 14%, and the estimate for missing data was 10%. Participants were individually assessed in a health centre or at home in the case of people with mobility difficulties. Before the data collection, all participants were informed about the study and signed the corresponding informed consent form. The study protocol was approved by the Ethics Committee at the University of A Coruña and conformed to the principles embodied in the Declaration of Helsinki. Self-rated health SRH was assessed with a single question: In general, would you say your health is excellent, good, fair, or poor?4,14 Next, following the methods used by different authors, SRH was dichotomized into two outcome measures: good (excellent and good) and poor (fair and poor).12,20 Sociodemographic aspects and social resources The Older Americans Resources and Services (OARS) standardized questionnaire was used to collect sociodemographic variables (age, gender, educational level and marital status),21 and need for caregiver support and regular practice of physical activity information. The need for caregiver support was assessed with the question “In the past six months, has someone helped you with your personal care; for example, helping you to bathe or dress, feeding you, or helping you with toilet care?” According to the World Health Organization global recommendations on physical activity for the health of adults 65-years-old and above,22 habitual physical activity should include at least 2 h and 30 min of moderate-intensity or 1 h and 15 min of vigorousintensity aerobic physical activity throughout the week, or include an equivalent combination of moderate- and vigorous-intensity activity. Social support was measured by items from the social resources section of the OARS.21 Three validated social resources subscales, derived from the sevenitem social resources index, were obtained: the extent of contact with others (“Number of people you know well enough to visit,” “Number of times you talk with someone on the telephone per week,” “Number of times you visit with someone per week”), the satisfaction with contacts (“Have someone you trust,” “Frequency of feelings of loneliness,” “Satisfaction with contacts with loved ones”) and the availability of help (“Have someone who would help you if you became sick or disabled”). Health aspects Physical aspects and habits Participant’s anamneses were given by the patient or their relatives according to the medical records. Tobacco and alcohol consumption was registered. The variable smoking status (smoker or non-smoker) was assessed based on the 30 days prevalence of cigarette smoking (i.e. whether or not someone had smoked a cigarette in the past 30 days).23 Alcohol consumers were those reporting daily alcohol consumption. According to the level of alcohol intake, we defined “moderate drinking” with an upper limit of 80 grams per day, and “heavy drinking,” with an upper level of consumption greater than 80 grams per day.24 General comorbidity and number of comorbid diseases were also registered, using the Charlson comorbidity index (CCI).25.
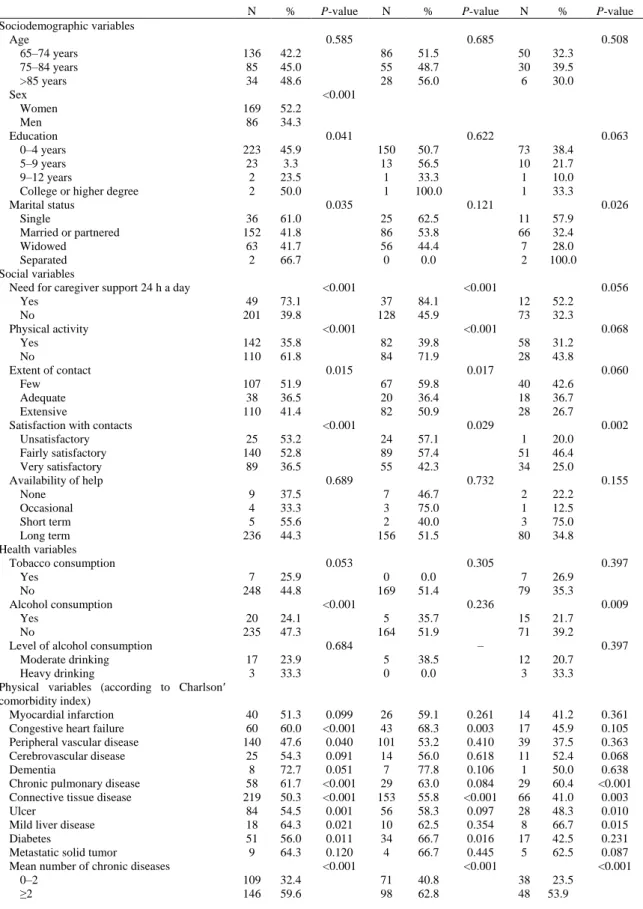
(3) Functional aspects Functional status was assessed by a physician or a trained nurse. The patient’s dependence on other people was assessed using the Katz Index26 for the basic activities of daily living (ADL) and the Lawton and Brody Index27 for the instrumental activities of daily living (IADL). Individuals who were unable to perform any one of the activities were considered to be functionally incapacitated in that activity (ADL or IADL dependent). Psychological aspects Cognitive status was assessed using the Mini Mental State Examination (MMSE),28 which is widely used in the Spanish population. Cognitive impairment was defined according to Crum’s median cut-off scores accounting for age and educational level.29 People were also assessed with the short-form version of the Geriatric Depression Scale (GDS-SF),30 a validated, reliable, 15-item, self-reporting, depressive symptoms checklist designed to detect the presence of current depression in the elderly. The optimal cut-off score as a screening instrument for depression was 5 out of 6.31 Both instruments were administered by a clinical psychologist with experience in psychological assessment. Statistical analysis Characteristics of the sample were summarized in terms of frequency and percentage for the categorical variables. The Student’s t-test for continuous variables and the χ2 test for categorical variables were used to examine differences in parameters between individuals with good and poor self-rated health. A multiple logistic regression analysis was used to determine which independent variables modified SRH; SRH was used as the dependent variable, and the other variables were introduced into the model as covariates. Odds ratios (OR) and 95% confidence intervals (CI) were calculated for each covariate included in the model. Statistical significance was set at a P-value of less than 0.05. Statistical analysis was performed using the Statistical Package for the Social Sciences (SPSS, SPSS Inc., Chicago, IL, USA) version 16.0.2.32 Results For the SRH, 5.9% of the participants reported their health was “excellent,” 50.2% reported it was good, while 33.2% and 10.7% reported that it was “fair” and “poor,” respectively. After SRH was dichotomized into two levels of “good” versus “poor,” 56.1% of the subjects responded that their health was “good,” while 43.9% perceived their health as poor. Table 1 shows the sociodemographic, social and health characteristics of the subjects with poor SRH for the total population and distributed by gender. Various sociodemographic variables were associated with poor health status: female sex; low educational level; less than 4 years of schooling; and being single or separated. The social factors of the need for caregiver support 24 h a day in the last 6 months and physical inactivity were associated with poor SRH. In addition, congestive heart failure, chronic pulmonary disease, connective tissue disease, ulcer, mild liver disease, diabetes and having two or more chronic diseases showed associations with poor SRH. ADL dependence and IADL dependence, cognitive impairment and depressive symptoms were also associated with poor SRH. Stratifying by sex, in women poor SHR was significantly associated with the need for caregiver support 24 h a day, physical inactivity, little contact and low or fair satisfaction with contacts. With respect to health variables, congestive heart failure, connective tissue disease, diabetes and having two or more chronic diseases showed significant associations with poor SRH. ADL dependence, IADL dependence, and depressive symptoms were also significantly associated with poor SRH. In men, being single or separated was significantly associated with poor SRH. Regarding health variables, no alcohol consumption, chronic pulmonary disease, connective tissue disease, ulcer, mild liver disease and having two or more chronic diseases were associated with poor SRH. Finally, ADL dependence, IADL dependence, cognitive impairment and depressive symptoms were associated with poor SRH..
(4) Table 1 Distribution of poor self-rated health (SRH) by sociodemographic, social and health variables (P-value shows significance level between poor and good SRH). Sociodemographic variables Age 65–74 years 75–84 years >85 years Sex Women Men Education 0–4 years 5–9 years 9–12 years College or higher degree Marital status Single Married or partnered Widowed Separated Social variables Need for caregiver support 24 h a day Yes No Physical activity Yes No Extent of contact Few Adequate Extensive Satisfaction with contacts Unsatisfactory Fairly satisfactory Very satisfactory Availability of help None Occasional Short term Long term Health variables Tobacco consumption Yes No Alcohol consumption Yes No Level of alcohol consumption Moderate drinking Heavy drinking Physical variables (according to Charlson′ comorbidity index) Myocardial infarction Congestive heart failure Peripheral vascular disease Cerebrovascular disease Dementia Chronic pulmonary disease Connective tissue disease Ulcer Mild liver disease Diabetes Metastatic solid tumor Mean number of chronic diseases 0–2 ≥2. Total N. %. 136 85 34. 42.2 45.0 48.6. 169 86. 52.2 34.3. 223 23 2 2. 45.9 3.3 23.5 50.0. 36 152 63 2. 61.0 41.8 41.7 66.7. 49 201. 73.1 39.8. 142 110. 35.8 61.8. 107 38 110. 51.9 36.5 41.4. 25 140 89. 53.2 52.8 36.5. 9 4 5 236. 37.5 33.3 55.6 44.3. 7 248. 25.9 44.8. 20 235. 24.1 47.3. 17 3. 23.9 33.3. 40 60 140 25 8 58 219 84 18 51 9. 51.3 60.0 47.6 54.3 72.7 61.7 50.3 54.5 64.3 56.0 64.3. 109 146. 32.4 59.6. P-value. Women N %. 0.585. P-value. Men N. %. 0.685 86 55 28. 51.5 48.7 56.0. 150 13 1 1. 50.7 56.5 33.3 100.0. 25 86 56 0. 62.5 53.8 44.4 0.0. 37 128. 84.1 45.9. 82 84. 39.8 71.9. 67 20 82. 59.8 36.4 50.9. 24 89 55. 57.1 57.4 42.3. 7 3 2 156. 46.7 75.0 40.0 51.5. 0 169. 0.0 51.4. 5 164. 35.7 51.9. 5 0. 38.5 0.0. 26 43 101 14 7 29 153 56 10 34 4. 59.1 68.3 53.2 56.0 77.8 63.0 55.8 58.3 62.5 66.7 66.7. 71 98. 40.8 62.8. P-value 0.508. 50 30 6. 32.3 39.5 30.0. 73 10 1 1. 38.4 21.7 10.0 33.3. 11 66 7 2. 57.9 32.4 28.0 100.0. 12 73. 52.2 32.3. 58 28. 31.2 43.8. 40 18 28. 42.6 36.7 26.7. 1 51 34. 20.0 46.4 25.0. 2 1 3 80. 22.2 12.5 75.0 34.8. 7 79. 26.9 35.3. 15 71. 21.7 39.2. 12 3. 20.7 33.3. 14 17 39 11 1 29 66 28 8 17 5. 41.2 45.9 37.5 52.4 50.0 60.4 41.0 48.3 66.7 42.5 62.5. 38 48. 23.5 53.9. <0.001. 0.041. 0.622. 0.035. 0.121. <0.001. 0.026. <0.001. <0.001. 0.056. <0.001. 0.015. 0.068. 0.017. <0.001. 0.060. 0.029. 0.689. 0.002. 0.732. 0.053. 0.155. 0.305. <0.001. 0.397. 0.236. 0.009. –. 0.684. 0.099 <0.001 0.040 0.091 0.051 <0.001 <0.001 0.001 0.021 0.011 0.120 <0.001. 0.063. 0.261 0.003 0.410 0.618 0.106 0.084 <0.001 0.097 0.354 0.016 0.445 <0.001. 0.397. 0.361 0.105 0.363 0.068 0.638 <0.001 0.003 0.010 0.015 0.231 0.087 <0.001.
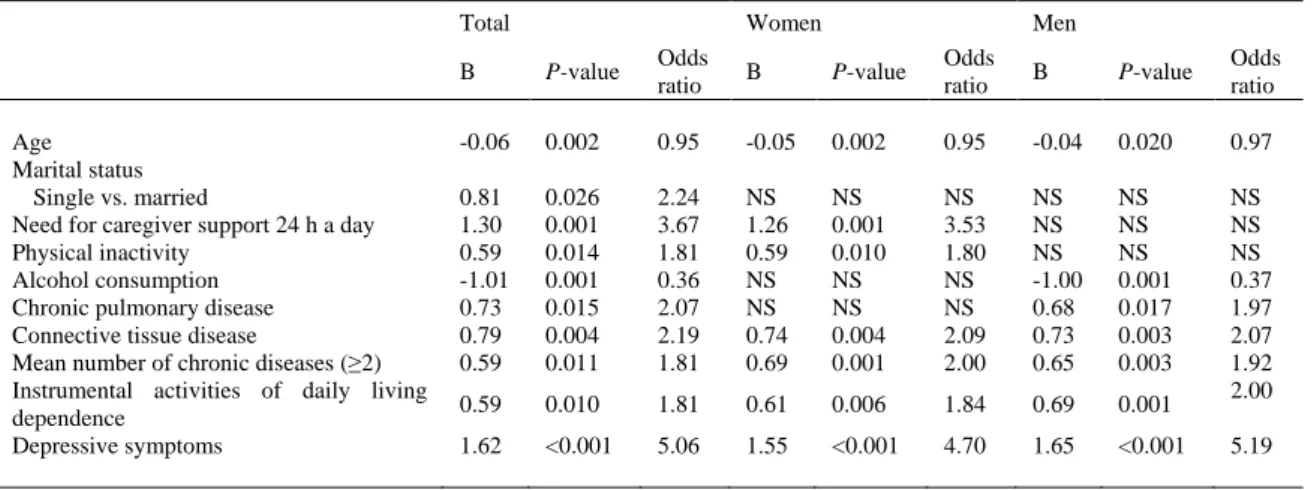
(5) Table 1 Continued Total N Functional variables Basic activities of daily living Dependence Independence Instrumental activities of daily living Dependence Independence Psychological variables Cognitive impairment Yes No Depressive symptoms Yes No. %. P-value. Women N %. P-value. <0.001 111 144. 57.5 37.2. 94 161. 52.6 34.3. 63 189. 52.9 41.5. 113 141. 76.9 32.8. Men N. %. 26 60. 48.1 30.5. 59 27. 42.4 24.1. 16 70. 50.0 32.1. 26 60. 76.5 27.8. P-value. 0.002 85 84. 61.2 44.2. 102 67. 61.1 41.4. 47 119. 54.0 50.2. 87 81. 77.0 37.9. <0.001. 0.015. <0.001. 0.026. 0.002. 0.543. <0.001. 0.047. <0.001. <0.001. The variables showing significant associations with poor SRH in the univariate analysis were included in a multiple logistic regression analysis to assess the determinants of poor SRH. Age was not significantly associated with poor SRH, but it was included in the model since it has been considered an important predictor of poor SRH by other authors.12,33 Table 2 contains the results of the multiple logistic regression analysis only for those variables showing significant differences between poor and good SRH in the regression model. Based on the adjusted regression coefficients, depressive symptoms were the single best predictor of risk of poor SRH. Elderly people with depressive symptoms were 5.06 times (95% CI 3.07–8.36) more likely to report poor SRH than those without depressive symptoms. Other factors increasing the risk of reporting poor SRH were the need for caregiver support 24 h a day (OR 3.67, 95% CI 1.70–7.94) and being single (OR 2.24, 95% CI 1.10–4.54). Other significant risk factors of poor SRH were chronic pulmonary disease (OR 2.07, 95% CI 1.15–3.71), connective tissue disease (OR 2.19, 95% CI 1.29–3.72), presence of two or more chronic diseases (OR 1.86, 95% CI 1.18–2.94), dependence in IADL (OR 1.81, 95% CI 1.15–2.85) and physical inactivity (OR 1.81, 95% CI 1.13–2.90). However, age (OR 0.95, 95% CI 0.91–0.98) and alcohol consumption (OR 0.36, 95% CI 0.20–0.67) showed significant inverse associations with poor SRH.. Table 2 Logistic regression coefficients and P-values for those variables showing significant differences between poor and good self-related health Total. Age Marital status Single vs. married Need for caregiver support 24 h a day Physical inactivity Alcohol consumption Chronic pulmonary disease Connective tissue disease Mean number of chronic diseases (≥2) Instrumental activities of daily living dependence Depressive symptoms. Women. Men. B. P-value. Odds ratio. -0.06. 0.002. 0.95. -0.05. 0.002. 0.95. -0.04. 0.020. 0.97. 0.81 1.30 0.59 -1.01 0.73 0.79 0.59. 0.026 0.001 0.014 0.001 0.015 0.004 0.011. 2.24 3.67 1.81 0.36 2.07 2.19 1.81. NS 1.26 0.59 NS NS 0.74 0.69. NS 0.001 0.010 NS NS 0.004 0.001. NS 3.53 1.80 NS NS 2.09 2.00. NS NS NS -1.00 0.68 0.73 0.65. NS NS NS 0.001 0.017 0.003 0.003. 0.59. 0.010. 1.81. 0.61. 0.006. 1.84. 0.69. 0.001. NS NS NS 0.37 1.97 2.07 1.92 2.00. 1.62. <0.001. 5.06. 1.55. <0.001. 4.70. 1.65. <0.001. B, regression coefficient B; NS, no significant difference.. B. P-value. Odds ratio. B. P-value. Odds ratio. 5.19.
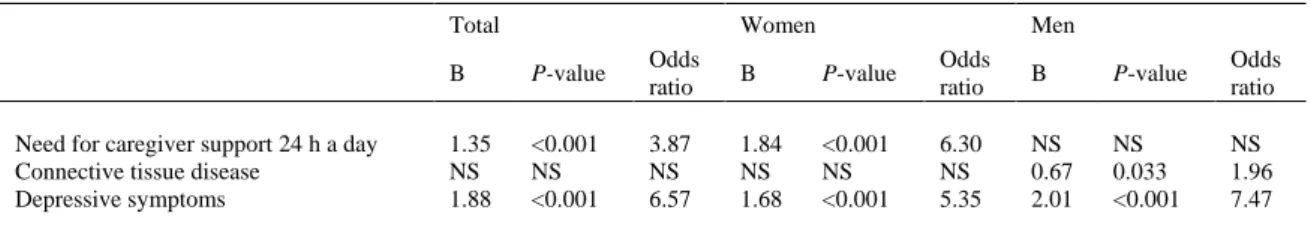
(6) Regarding the data obtained after distributing the population sample by sex, the best predictors of poor SRH in women were the presence of depressive symptoms (OR 4.70, 95% CI 2.94–7.53) and the need for caregiver support 24 h a day (OR 3.53, 95% CI 1.73–7.20). Other significative predictors were connective tissue disease (OR 2.09, 95% CI 1.27–3.44), the presence of two or more chronic diseases (OR 2.00, 95% CI 1.32–3.01), dependence in IADL (OR 1.84, 95% CI 1.20–2.83) and physical inactivity (OR 1.80, 95% CI 1.15–2.82). Age (OR 0.95, 95% CI 0.92–0.98) was inversely related to poor SRH in women. In men, depressive symptoms (OR 5.19, 95% CI 3.26–8.28) were the best predictors of poor SRH. Connective tissue disease (OR 2.07, 95% CI 1.27–3.36), dependence in IADL (OR 2.00, 95% CI 1.30– 3.07), chronic pulmonary disease (OR 1.97, 95% CI 1.13–3.44) and the presence of two or more chronic diseases (OR 1.92, 95% CI 1.25–2.93) were also significant predictors. Age (OR 0.97, 95% CI 0.94–0.99) and alcohol consumption (OR 0.37, 95% CI 0.20–0.67) had significant inverse associations with poor SRH in men. Finally, Table 3 shows the results of a logistic regression model including the two best single predictors of poor SRH. For the total population, the two main predictors were depressive symptoms and the need of caregiver support 24 h a day in the last 6 months. The combination of having both factors increased the risk of reporting poor SRH to 91.5%. The best predictors for women were also depressive symptoms and the need of caregiver support 24 h a day in the last 6 months, reaching a 94.4% likelihood of poor SRH. In men, the main predictors of poor SHR were depressive symptoms and connective tissue disease; and when considered together, the risk of reporting poor SRH was 78.4%.. Table 3 Logistic regression of two major predictor variables and poor self-rated health Total. Need for caregiver support 24 h a day Connective tissue disease Depressive symptoms. Women. B. P-value. Odds ratio. 1.35 NS 1.88. <0.001 NS <0.001. 3.87 NS 6.57. B 1.84 NS 1.68. Men P-value. Odds ratio. B. P-value. Odds ratio. <0.001 NS <0.001. 6.30 NS 5.35. NS 0.67 2.01. NS 0.033 <0.001. NS 1.96 7.47. B, regression coefficient B; NS, no significant difference.. Discussion Our results are consistent with those from other studies that found that SRH improves with age.12,14 The reason could be that the expectations for health decrease with age so that older persons with the same health problems would perceive that their health is better than those who are younger. However, as reported by other authors, sex is not significantly associated with poor SRH.15 This could be because men perceive their health as being better as adults, but after reaching the age of 50, they have steeper linear rates of decline than women. As a result, sex differences in SRH disappear in late adulthood.33 Being single was also a significant predictor of poor SRH for the entire population. The relationship between marital status and SRH is unclear. Previous studies have found that not being married was a risk factor for poor SRH, when compared to being married or living as a couple, for both men and women.34,35 Though other authors have found that single/divorced/separated participants were at no greater risk for poor health than married/cohabiting participants.36 There exist problems of inequality in health among older adults according to sex, age, education, wealth status and marital status.37 As regards lifestyles, we have found that a lack of physical activity is significantly associated with poor SRH in the total population and in women, but not in men. In the past, other research has found that a low level of physical activity is a predictor of poor SRH in women,13 and a decrease in physical activity predicts SRH worsening among the elderly.38 As regards alcohol consumption, we observed that, in the total population, it had an inverse correlation with poor SRH. A previous study found that people who do not drink alcohol perceive their health to be worse than those who drink occasionally or daily.17 This relationship could be due to the effects of alcohol consumption combined with the effects from other socioeconomic variables. Another explanation could be that people with a better health perception are those who think they are allowed to drink; nevertheless, further research is needed to clarify this connection. Alcohol consumption was inversely related with poor SRH in men but not in women. This is consistent with the results of other authors2 and could be explained by.
(7) the fact that most drinkers were men. Regarding smoke consumption no significant results were found. The association between smoke consumption and SRH is not clear. Some authors have found that smoke consumption is a risk factor for poor SRH,17 while others did not find a direct affect on SRH,9 others still found that female smokers had higher odds for good SRH.2 Several studies have found that the physical dimension of health is a major factor in SRH. The proportion of poor SRH that can be attributed to chronic diseases is higher in the elderly than in middleaged adults.14 Chronic diseases such as diabetes, cardiovascular diseases, neurological diseases, rheumatoid arthritis and cancer have been distinguished as important predictors of poor SRH in the elderly.2,15 In our study, connective tissue disease was a significant predictor of poor SRH in the total population and when distributed by gender. Chronic pulmonary disease was a significant predictor of poor SRH in the total population and in men, but not in women. This could be explained by the fact that the most important risk factor for chronic pulmonary disease is smoke comsuption,39 which is more frequent in men. Furthermore, the presence of two or more chronic diseases was a significant predictor of poor SRH in the total population and in both sexes, which is consistent with those studies showing that the increase in the number of chronic diseases is an independent risk factor for poor SRH.12,13 Dependence in IADL also was a significant predictor of poor SRH in the total population and when distributed by gender, similar to what has been found in other studies showing that functional capacity is one of the main determinants of SRH in the elderly.14,40 Despite the influence of mood on poor SRH, it has not been studied much; some studies have found that depression is one of the major predictors of poor SRH2,15,41 and that depressive symptoms predict the worsening of SRH in the elderly as time goes by.16 These data are similar to our results, where depressive symptoms appear to be the main predictor of poor SRH in the total population and in both sexes. An individual’s degree of dependence has a significant impact on health and quality of life, both for the individual and for his or her caregivers and relatives.42 Need for caregiver support 24 h a day in the last 6 months was the next predictor of importance in the total population and in women. However, it was not a significant predictor for poor SHR in men, and this could be due to the fact that in our country care giving has been historically women’s work. In fact, data from the Spanish Ministry of Work and Social Affairs reports that 84% of the informal caregivers of dependent older people are women.43 In 1978, the World Health Organization reaffirmed the definition of health as a “state of complete physical, mental and social well-being and not merely the absence of disease or infirmity,” from our results, we can state that SRH is also a multidimensional construct, 40 influenced by different health (physical, psychological and functional) and social aspects. Based on the above, identifying potential risk factors for poor SRH is essential to understanding their validity as predictors of future health outcomes. The results from this and other similar studies have important implications on a practical level because the knowledge of the main factors determining SRH in people over 65 years of age could result in strategies that improve the quality of life of this growing segment of the population. Due to the great contribution of depression to poor SRH and the high prevalence of depressive symptoms in the elderly,44 it is particularly important to increase the measures aimed to prevent depression and promote mental health. Our study focused on the risk factors for poor SRH, but we think it is also important to know the factors associated with good SRH, as they could suggest additional ways to intervene for improving the health and welfare of older people. Predictors of good and poor SRH are not mirror images,40 and therefore, further research is needed to clarify the determinants of good SRH. In conclusion, SRH is a multidimensional construct associated with physical, psychological, functional, and social health; depressive symptoms were the main predictor of poor SRH. Other factors, such as the need for caregiver support, being single, connective tissue disease, chronic pulmonary disease, the presence of two or more chronic diseases, the dependence for IADL living and not practicing exercise regularly, must also be considered. We understand that prevention strategies addressing the significant factors of poor SRH are fundamental to improving it and to ultimately improving the welfare and quality of life of the target population. Lastly, and because our results show that depressive symptoms are the main predictor of poor SRH, early prevention and intervention programs should give priority to this pathological manifestation. Acknowledgements We sincerely thank the Narón Council for providing us access to their elderly people..
(8) References 1 DeSalvo KB, Fan VS, McDonell MB, Fihn SD. Predicting mortality and health care utilization with a single question. Health Serv Res 2005; 40: 1234–1246. 2 Haseli-Mashhadi N, Pan A, Ye X et al. Self-Rated Health in middle-aged and elderly Chinese: distribution, determinants and associations with cardio-metabolic risk factors. BMC Public Health 2009; 9: 368. 3 Heistaro S, Jousilahti P, Lahelma E, Vartiainen E, Puska P. Self-rated health and mortality: a long term prospective study in eastern Finland. J Epidemiol Community Health 2001; 55: 227–232. 4 Idler EL, Benyamini Y. Self-rated health and mortality: a review of twenty-seven community studies. J Health Soc Behav 1997; 38: 21–37. 5 Goldman N, Glei DA, Chang MC. The role of clinical risk factors in understanding self-rated health. Ann Epidemiol 2004; 14: 49–57. 6 Ferraro KF, Farmer MM, Wybraniec JA. Health trajectories: long-term dynamics among black and white adults. J Health Soc Behav 1997; 38: 38–54. 7 Lee Y. The predictive value of self assessed general, physical, and mental health on functional decline and mortality in older adults. J Epidemiol Community Health 2000; 54: 123–129. 8 Shadboldt B. Some correlates of self-rated health for Australian women. Am J Public Health 1997; 87: 951–956. 9 Benyamini Y, Idler EL, Leventhal H, Leventhal EA. Positive affect and function as influences on self-assessments of health: expanding our view beyond illness and disability. J Gerontol B Psychol Sci Soc Sci 2000; 55: 107–116. 10 Kawada T. Self-rated health and life prognosis. Arch Med Res 2003; 34: 343–347. 11 Palmore EB, Burchett BM. Predictors of disability in the final year of life. J Aging Health 1997; 9: 283–297. 12 Damián J, Ruigómez A, Pastor V, Martin-Moreno JM. Determinants of self assessed health among Spanish older people living at home. J Epidemiol Community Health 1999; 53: 412–416. 13 Kanagae M, Abe Y, Honda S et al. Determinants of self-rated health among community-dwelling women aged 40 years and over in Japan. Tohoku J Exp Med 2006; 210:11–19. 14 Murata C, Kondo T, Tamakoshi K, Yatsuya H, Toyoshima H. Determinants of self-rated health: could health status explain the association between self-rated health and mortality? Arch Gerontol Geriatr 2006; 43: 369–380. 15 Molarius A, Janson S. Self-Rated Health, chronic diseases, and symptoms among middle-aged and elderly men and women. J Clin Epidemiol 2002; 55: 364–370. 16 Han B. Depressive symptoms and self-rated health in community-dwelling older adults: a longitudinal study. J Am Geriatr Soc 2002; 50: 1549–1556. 17 Zunzunegui MV, Kone A, Johri M, Béland F, Wolfson C, Bergman H. Social networks and self-rated health in two Frenchspeaking Canadian community dwelling populations over 65. Soc Sci Med 2004; 58: 2069–2081. 18 Leinonen R, Heikkinen E, Jylha M. Self-rated health and self-assessed change in health in elderly men and women-A five-year longitudinal study. Soc Sci Med 1998; 46: 591–597. 19 Yi Z, Vaupel JW. Functional capacity and self-evaluation of health and life of the oldest old in China. J Soc Issues 2002; 58: 733–748. 20 Zunzunegui MV, Beland F, Otero A. Support from children, living arrangements, self-rated health and depression of the elderly in Spain. Int J Epidemiol 2001; 30: 1090–1099. 21 Fillenbaum GG. Multidimensional Functional Assessment of Older Adults: The Duke Older Americans Resources and Services Procedures. Hillsdale, NJ: Lawrence Erlbaum Associates, 1988. 22 World Health Organization. Global Recommendations on Physical Activity for Health. Geneva, Switzerland: WHO, 2010. 23 Lantz PM. Smoking on the rise among young adults: implications for research and policy. Tob Control 2003; 12 (Suppl 1): i60– i70. 24 Turner TB, Bennett VL, Hernández H. The beneficial side of moderate alcohol use. Johns Hopkins Med J 1981; 148:53–63. 25 Charlson ME, Pompei P, Ales KL, MacKenzie CR. A new method of classifying prognostic comorbidity in longitudinal studies: development and validation. J Chron Dis 1987;40: 373–383. 26 Katz S, Ford AB, Moskowitz RW, Jackson BA, Jaffe MW. Studies of illness in the age. The index of ADL: a standardized measure of biological and psychological function. J Am Med Assoc 1963; 185: 914–919. 27 Lawton MP, Brody EM. Assessment of older people: self maintaining and instrumental activities of daily living. Gerontologist 1969; 9: 179–186. 28 Folstein MF, Folstein DE, McHugh PR. “Mini-Mental State”: a practical method for grading the cognitive state of patients for the clinician. J Psychiatr Res 1975; 12: 189–198. 29 Crum RM, Anthony JC, Bassett SS, Folstein MF. Population-based norms for the Mini Mental State Examination by age and level of education. J Am Med Assoc 1993;269: 2386–2391. 30 Sheikh JL, Yesavage JA. Geriatric Depression Scale (GDS). Recent evidence and development of a shorter version. Clin Gerontol 1986; 5: 165–172. 31 Herrmann N, Mittman N, Silver IL et al. A validation study of the Geriatric Depression Scale (GDS) short form. Int J Geriatr Psychiatry 1996; 11: 457–460. 32 SPSS Inc. SPSS Base 16.0.1. for Windows User’s Guide. Chicago: SPSS, 2007. 33 McCullough ME, Laurenceau JP. Gender and the natural history of self-rated health: a 59-year longitudinal study. Health Psychol 2004; 23: 651–655. 34 Lindström M. Marital status, social capital, material conditions and self-rated health: a population-based study. Health Policy 2009; 93: 172–179. 35 Rohrer JE, Bernard ME, Zhang Y, Rasmussen NH, Woroncow H. Marital status, feeling depressed and self-rated health in rural female primary care patients. J Eval Clin Pract 2008; 14: 214–217. 36 Amstadter AB, Begle AM, Cisler JM, Hernandez MA, Muzzy W, Acierno R. Prevalence and correlates of poor self-rated health in the United States: the national elder mistreatment study. Am J Geriatr Psychiatry 2010; 18: 615–623. 37 Van Minh H, Byass P, Wall S. Multilevel analysis of effects of individual characteristics and household factors on self-rated health among older adults in rural Vietnam. Geriatr Gerontol Int 2010; 10: 209–215. 38 Leinonen R, Heikkinen E, Jylhä M. Predictors of decline in self-assessments of health among older people–a 5-year longitudinal study. Soc Sci Med 2001; 52: 1329–1341. 39 Pauwels RA, Rabe KF. Burden and clinical features of chronic obstructive pulmonary disease (COPD). Lancet 2004; 364: 613– 620..
(9) 40 Shooshtari S, Menec V, Tate R. Comparing predictors of positive and negative self-rated health between younger (25–54) and older (55+) Canadian adults. A longitudinal study of well-being. Res Aging 2007; 29: 512–554. 41 Damián J, Pastor-Barriuso R, Valderrama-Gama E. Factors associated with self-rated health in older people living in institutions. BMC Geriatr 2008; 8: 5. 42 Millán-Calenti JC, Gandoy-Crego M, Antelo-Martelo M, López-Martínez M, Riveiro-López MP, Mayán-Santos JM. Helping the family carers of Alzheimer’s patients: from theory to practice. A preliminary study. Arch Gerontol Geriatr 2000; 30: 131–138. 43 IMSERSO. Situación Y Evolución Del Apoyo Informal A Los Mayores En España. Avance De Resultados: Informe Descriptivo. Madrid: IMSERSO, 2004. 44 Alexopoulos GS. Depression in the elderly. Lancet 2005; 365: 1961–1970.
(10)
Figure
Documento similar
EUROPEAN HEALTH INSURANCE CARD (EHIC) You have to register in the nearest public health centre to your accommodation in Malaga with this card.. Link to public health centres
The questionnaire includes questions on demographic information, students’ behaviours and attitudes towards self-medication practices, students’ health status and health
Among these individual circumstances that affect health percep- tion, we know that socioeconomic factors—like employ- ment status or educational level (Ahmad et al. 2014)—have
Sarcopenic obesity: prevalence and association with metabolic syndrome in the Korean Longitudinal Study on Health and Aging (KLoSHA). Is central obesity associated with
Research shows that persons with poor coping skills, mental health problems (such as depression, anxiety disorders), and poor social support before the traumatic event have
Fair Poor minutes none Good Moderate. Fair Good <μsec none
Figure 1 Dose–response relationship of the amount of self-reported moderate-to-vigorous physical activity (MVPA) with optimal self-rated health, less health complaints,
The disease which failed to show any association was asthma, which was significant only among men in Spain (Table 4). All the aforementioned diseases were also somehow
