When discussing scales, inverse items can be defi ned as those having a directionality opposed to the logic of the construct being measured (Weijters & Baumgartner, 2012). Such items can be reversed by creating phrases that represent a negation of the construct through the use of the word “no” or adjectives, adverbs, and even verbs that provide a negative connotation. According to Scheriesheim, Eisenbach, and Hill (1991), there are three ways in which negation may be established: regular or direct negation (e.g., people are not honest), polar opposites (e.g., people are dishonest) and negation of the polar opposite (e.g., people are not dishonest).
Some authors have emphasized the need to use negative items to reduce the acquiescence bias (Nunally, 1978; Baumgartner & Steenkamp, 2001) that occurs when people tend to agree with statements without regard for their actual content (Podsakoff, MacKenzie, Lee, & Podsakoff, 2003), or due to laziness, indifference or automatic adaption to a response pattern. The reason
that such items help minimize this bias is because they act to reduce response speed and promote cognitive reasoning in the subjects (Podsakoff et al., 2003). They also contribute to the validity of the measurement by expanding the way in which individuals think and arrange their beliefs related to the construct under study (Weijters & Baumgartner, 2012). Other studies show that the combination of positive and negative items fails to reduce acquiescence bias, and that the quantity of extreme responses between both types of items is similar (Sauro & Lewis, 2011).
Over the years, various investigations have revealed other problems associated with negative items. One problem is that people respond inconsistently, that is, their answers do not match the logic shown in other questions (Colosi, 2005; Garg, 1996; Kalton, Kollins, & Brook, 1978), in some cases, because they do not pay attention or because they cannot cognitively establish the difference with items worded positively (Sonderen, Sanderman, & Coyne, 2013; Sauro & Lewis, 2011; Roszkowski & Soven, 2010). Diffi culty in understanding is refl ected in the increase of non-responses (Colosi, 2005) and lower average scores on negative items (Weems, Onwuegbuzie, Schreiber, & Eggers, 2003). These problems result in low levels of correlation between the score for an item and the total score, even below what is accepted by the majority of authors (Roszkowski & Soven, 2010). This also generates a loss of reliability in the scales, which is refl ected in
ISSN 0214 - 9915 CODEN PSOTEG Copyright © 2015 Psicothema www.psicothema.com
The dilemma of combining positive and negative items in scales
Martín Solís Salazar
Instituto Tecnológico de Costa RicaAbstract
Resumen
Background: This study analyzed the advantages and disadvantages of combining negative and positive items in scales in a Spanish-speaking context. Method: Three telephone surveys of 233 people each were carried out. In one survey, 15 items from the Keyes Social Well-Being Scale were worded in a positive fashion; another survey presented 8 items in a positive fashion and 7 items in terms of direct denial; and in the third survey, 7 items were worded positively, 5 were worded in negative terms using polar opposites, and 3 terms were presented in terms of direct denial. Results: The results show a greater tendency for the items in the Positive questionnaire to show results associated with the directionality of the items. However, this questionnaire shows higher values of the Cronbach’s alpha coeffi cient, and better fi t of the theoretical factor structure. Conclusions: In the survey that included only positive items, fi ndings indicated the existence of acquiescence bias. However, a remedy to this situation only made matters worse, as the combination of positive and negative items seriously affected the internal consistency of the scales.
Keywords: Psychometrics; Likert scales; negative items; scale bias.
El dilema de combinar ítems positivos y negativos en escalas.
Antecedentes: se analizó en un contexto hispano hablante las ventajas y desventajas de combinar ítems negativos y positivos en las escalas. Método: se aplicaron tres encuestas telefónicas de 233 personas cada una. En una encuesta se redactaron 15 ítems de la escala de bienestar social de Keyes de forma positiva; otra contó con 8 ítems redactados de manera positiva y 7 de negación directa; en la última hubo 7 ítems positivos, 5 de negación usando el polo opuesto y 3 de negación directa. Resultados: los resultados revelan una mayor tendencia de los ítems del cuestionario positivo a presentar respuestas asociadas a la direccionalidad del ítem. Sin embargo, este cuestionario muestra valores más altos del coefi ciente alfa de Cronbach y un mejor ajuste de la estructura factorial teórica. Conclusiones: se prevé mayor presencia del sesgo de aceptación en el cuestionario que solo posee ítems positivos. Sin embargo, el remedio empeoró las cosas, la combinación de ítems positivos y negativos afectó seriamente la consistencia interna de las escalas.
Palabras clave: psicometría; escalas Likert; ítems negativos; sesgos en escalas.
Psicothema 2015, Vol. 27, No. 2, 192-199
doi: 10.7334/psicothema2014.266
Received: November 26, 2014 • Accepted: March 6, 2015 Corresponding author: Martín Solís Salazar
Instituto Tecnológico de Costa Rica
Santo Pablo. 75 metros norte, 25 este y 50 norte de la Viggui Heredia (Costa Rica)
confi dence indicators (Johnson, Bristow, & Schneider, 2011; Marsh, 1984). Some researchers have even pointed out the potential method effects associated with negatively worded items in different scales (Ye & Wallace, 2014; Tomás, Oliver, Galiana, Sancho, & Lila, 2013; Van Dam, Hobkirk, Danoff-Burg, & Earleywine, 2012; Ebesutani, Drescher, Reise, Heiden, Hight, Damon, & Young, 2012).
One of the main problems is that negative items tend to be more intercorrelated. This problem becomes especially severe when unidimensional scales are used, as negative items tend to form a different dimension (Merritt, 2012; Wong, Rindfl eisch, & Burroughs, 2003). When using multidimensional constructs, theoretical confirmation in confirmatory factor analysis is complicated (Cambell & Grissom, 1979). Such situations have led some authors to recommend only the use of positive items (Schriesheim & Eisenbach, 1995; DeVellis, 2003).
However, the problems associated with the use of negative items on subjective scales do not occur in the same fashion in all cultures (Wong, Rindfl eisch, & Burroughs, 2003). For example, in the US recognition of negative items by interviewees is more viable than in Asian countries (Wong, Rindfl eisch, & Burroughs, 2003). It is diffi cult to fi nd studies related to this topic in Latin America, but in one relevant study Gamba and Marín (1992) show inconsistencies in the responses of Hispanics when positive and negative items are combined.
For these reasons, it is relevant to investigate the differences in responses between positive and negative items in scales expressed in Spanish. The objective of this study is to analyze the advantages and disadvantages of combining negative and positive items in Spanish-language surveys, based on a scale used in a telephonic survey of public opinion. The study also attempts to determine whether people respond similarly to items phrased in terms of direct negation and to negative items that are expressed in terms of polar opposites. We specifi cally attempt to answer the following questions: 1) Are there differences in how subjects respond to positive and negative items? 2) Are there differences in how subjects respond to items phrased as direct negations and negations expressed using polar opposites? 3) Does the combination of positive and negative items reduce acquiescence bias? 4) Does this combination create a greater number of inconsistencies in answers? 5) Do scales that use positive and negative items have lower reliability? 6) Do scales that use positive and negative items show lower factorial validity?
Method
Participants
The population analyzed in the general study consisted of residents of homes with home phones, 18 years old or older, throughout Costa Rica. The total sample size was 699 people.
The sample design is random, with telephone numbers randomly selected from a list containing all Costa Rican residential numbers. Individuals were selected using probability quota sampling, by sex and age (18-29 years old, 30-54 years old, and over 55 years old) and employment status (working or not). The use of quotas allows refl ecting the overall percentage distribution of the Costa Rican population for these variables, according to the results of the 2012 household survey by the Costa Rican Institute of Statistics and Census. Thus, the sample consists of 47.1% men
and 52.9% women. The distribution by age is 26.0 % in the fi rst group (18-29 years old), 44.6 % in the second group, and 29.4 % in the last one. In terms of their employment status, 56.4% had one.
Instruments
A Spanish-language adaptation of the 15-item Keyes subjective well-being scale validated by Blanco and Díaz (2005) was used. Subjective well-being is the balance that the subject makes between his or her personal and social resources and individual skills (Keyes, 1998). The complete measurement of this construct is comprised of 29 items measuring 5 dimensions; however, for this study only some items that measure the following three dimensions are used.
Social integration: Assessing the quality of relationships that people maintain with society and the community (Blanco & Díaz, 2005).
Social acceptance: Trust, acceptance and positive image of others (Blanco & Díaz, 2005).
Social Actualization: Confi dence in the growth and development of society (Blanco & Díaz, 2005).
It is worth emphasizing that only three of the fi ve dimensions of the construct were used because the measuring instrument had additional scales from another study. Therefore the researchers, jointly with the author of this paper, considered that including the items of the other two dimensions would have made the instrument too extensive, which could lead to rejection or tiredness of respondents.
To meet the objectives of the study, three questionnaires with differing versions of the 15 subjective well-being items were developed. The fi rst questionnaire contained only positively worded items and was referred to as the Positive Questionnaire. The second had 8 positive items and 7 directly negative items, and is referred to as Combined Questionnaire 1. The third questionnaire had 7 positive items, 5 negative items expressed in terms of polar opposites, and 3 negative items expressed using direct negation, and is referred to as Combined Questionnaire 2. The position of the items was assigned randomly and is the same for each of the three surveys. Responses are on a scale of 1-5, corresponding to Total Agreement, Agreement, Neither agree Nor disagree, Disagreement, Strong disagreement. The items in each questionnaire are presented in Table 1.
Although the items of Blanco and Díaz (2005) were written in Spanish, several pilot tests were conducted to verify appropriateness of the items, and assess the infl uence of any cultural difference in the way they were understood. Based on the results obtained, between one and three words were changed in items 3, 4 , 9 and 13 of Table 1.
Procedure
Although the three questionnaires were used in three different surveys, a single sample design was used for all of the surveys, as there was a more general study using a common core of questions that appeared in the three questionnaires. Thus, each of the three questionnaires described in the last section was applied to 233 individuals.
questionnaires continuously throughout the information collection process. Fieldwork was conducted in November 2013.
The sampling design allowed the samples of individuals that were interviewed for each of the three questionnaires to be very similar in terms of the principal demographic characteristics (Table 2). The only variable that had a signifi cant difference between the three sample groups was gender (test χ², p<0.05). There was a greater percentage of women in the sample groups which were interviewed using the positive questionnaire and the Combined 2 questionnaire. However, this difference should not have any implications, given that the difference of the median response score between men and women only shows a signifi cant variation (t test, p<0.05) in item 2 of the positive questionnaire, and item 5 of the Combined 2 questionnaire. The overall similarity of the groups provides suffi cient reliability to compare the results of applying the three questionnaires.
Data analysis
The information was processed in Stata 12.1, but the graphics was created in Excel. It was used two sample mean comparison t-test, in order to analyze the difference of response in both, positive and negative items. Test as One Way Anova and Chi-Square of independence was applied to prove the bias difference between the questionnaires. The internal consistency of the scales was verifi ed with Cronbach’s alpha reliability. Finally, a confi rmatory factor analysis was conducted to identify the theoretical factor structure of the scales.
Table 1 Questionnaire items
Item Positive Combined 1 Combined 2
1 Creo que la gente me valora como persona Creo que la gente no me valora como persona Creo que la gente me valora como persona
2 Creo que se debe confi ar en la gente Creo que se debe confi ar en la gente Creo que se debe desconfi ar de la gente
3 La sociedad ofrece estímulos para gente como yo La sociedad no ofrece estímulos para gente como yo La sociedad ofrece estímulos para gente como yo
4 Siento que soy parte importante de mi comunidad Siento que soy parte importante de mi comunidad Siento que no soy parte importante de mi comunidad
5 La sociedad sigue progresando La sociedad sigue progresando La sociedad ya no progresa
6 Creo que la gente es de fi ar Creo que la gente no es de fi ar Creo que la gente es de fi ar
7 Me siento cercano a otra gente Me siento cercano a otra gente Me siento lejano a otra gente
8 Si tengo algo que decir creo que la mayoría de la gente
me escucharía
Si tengo algo que decir creo que la mayoría de la gente no me escucharía
Si tengo algo que decir creo que la mayoría de la gente me escucharía
9 La gente es cada vez más honesta La gente es cada vez más honesta La gente es cada vez más deshonesta
10 Veo que la sociedad está en continuo desarrollo No veo que la sociedad esté en continuo desarrollo Veo que la sociedad está en continuo desarrollo
11 Para mí el progreso social es algo que existe Para mí el progreso social es algo que existe Para mí el progreso social es algo inexistente
12 Las personas se preocupan de los problemas de los otros Las personas no se preocupan de los problemas de otros Las personas se preocupan de los problemas de los otros
13 Creo que instituciones como el Poder Judicial o el
Go-bierno pueden mejorar mi vida
Creo que instituciones como el Poder Judicial o el Go-bierno pueden mejorar mi vida
Creo que instituciones como el Poder Judicial o el Go-bierno no pueden mejorar mi vida
14 Si tuviera algo que decir pienso que la gente se lo tomaría
en serio
Si tuviera algo que decir pienso que la gente no se lo tomaría en serio
Si tuviera algo que decir pienso que la gente se lo tomaría en serio
15 Creo que la gente es generosa Creo que la gente es generosa Creo que la gente es egoísta
Table 2
Relative distribution of demographic variables, according to questionnaire type
Variables Positive
* Signifi cant association between the variable and de type of questionnaire (χ2 test,
Results
Behavior of the items
The fi rst topic to be analyzed is whether the Positive questionnaire items have similar or different scores from those in the other questionnaires. Figure 1 shows the confi dence interval for the average difference for the score of each item in the Positive questionnaire and the corresponding item when it appears in the Combined 1 or Combined 2 questionnaires. This is done to determine whether the negative items affect the responses to positive items in the combined questionnaires. The fi gure shows that all 95% confi dence intervals include zero, which means that there is no evidence that the items in the Positive questionnaire show scores signifi cantly different from those for their corresponding items in the other questionnaires.
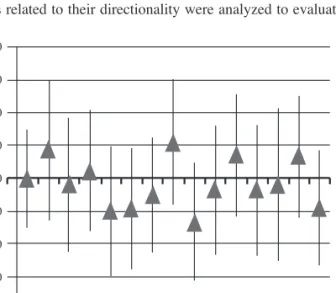
The second point to be considered is whether scores for the items in the Positive questionnaire show differences from those of their Negative counterparts in the Combined 1 or Combined 2 questionnaires. It is important to remember that Items 1, 3, 4, 5, 6 10, 12, 13, 14 shown in triangle shape in Figure 2 have counterparts phrased in terms of direct negation, while Items 2, 7, 9, 11, 15, shown square shape have their counterpart worded using polar opposites.
The confi dence intervals presented in Figure 2 show that the majority of positive items present signifi cant differences in their average scores compared to the negative items. Nine of the 15 positive items scored higher than their negative counterparts, fi ve positive items show no differences with their negative counterparts, and only one positive item has a lower score than its negative counterpart. Another important fi nding is that 50% (5) of the items worded using direct negation do not have lower scores than their positive counterparts, while of those items which use polar opposition, only 20% (1) do not have lower scores than their positive counterparts.
Acquiescence bias
The average number of items per subject that showed responses related to their directionality were analyzed to evaluate
acquiescence bias. An item shows a response related to its direction when the response to a positive item is agreement or total agreement, or the response to a negative item is disagreement or total disagreement. This is based on the assumption that if one of the three questionnaires has a greater tendency to refl ect items associated with their directionality, this will be due to acquiescence bias. The results show a greater tendency for the items in the Positive questionnaire to show results associated with the directionality of the items (Figure 3). On average, 7.4 items per subject have responses associated with their directionality in this questionnaire.
Inconsistency bias
For Colosi (2005), the inconsistency bias occurs when an item becomes distant from the other items that measure the same phenomenon. To analyze whether in the present study the questionnaires combining negative and positive items generate inconsistent responses, it is necessary to determine the number of subjects who, in at least one of the three dimensions of each questionnaire, provide answers which appear to be incongruent.
.40
.30
.20
.10
.00
-.10
-.20
-.30
-.40
Mean dif
ference
1 2 3 4 5 6 7 8 9 10 11 12 13 14 15
Item
Figure 1. Confi dence intervals (95%) for the mean difference between the score of positive items of the positive questionnaire and positive items of other questionnaires
1.2
1.0
0.8
0.6
0.4
0.2
0.0
-0.2
-0.4
-0.6
Mean dif
ference
1 2 3 4 5 6 7 8 9 10 11 12 13 14 15
Item
Figure 2. Confi dence intervals (95%) for the mean difference between the score of positive items of the positive questionnaire and negative items of other questionnaires. Items 2, 7, 9, 11, 15 (with a square shape) have their counterpart worded using polar opposites
Combined 2
Combined 1
Positive
Questionnaire
6,4
6,7
7,4
0,0 2,0 4,0 6,0 8,0
Mean
An inconsistency occurs when any of the following happens: the subject totally agrees with any positive item and totally disagrees with another positive item in the same dimension, or totally agrees with any negative item and totally disagrees with another negative item in the same dimension, totally agrees with one negative and one positive item in the same dimension, or totally disagrees with one negative and one positive item in the same dimension (Sauro & Lewis 2011). It is important to remember that three dimensions were discussed in the methodology section: social integration, social acceptance and social updating.
Figure 4 shows the percentage of subjects who showed at least one inconsistency. It is apparent that there are signifi cant differences in the percentage of subjects with inconsistencies among the three questionnaires. The highest frequency of inconsistencies (30% of subjects) occurs with the Combined 2 questionnaire, followed by the Combined 1 questionnaire (25% of subjects) and, fi nally, the Positive questionnaire (10% of subjects).
Internal consistency
It is perhaps because of this inconsistency that the Cronbach’s alpha reliability coeffi cient differs considerably in the subscales of the questionnaire with positive items and the combined questionnaires (see Table 3). In the questionnaire with positive items, the Cronbach’s alpha shows acceptable values in all three subscales, while in the other two questionnaires, reliability levels are very low. It is important to note that scales were inverted for the negative items, so they were oriented in the same direction as the positive items.
Factorial validity
The last aspect to be studied is whether the theoretical factor structure of the construct measured was altered when positive and negative items are combined. To test this, three models were generated based on a confi rmatory factor analysis. The fi rst model is based on the assumption that the 15 items measure three latent variables of the social well-being construct (Figure 5). These three
latent variables are correlated with each other because they are part of the same construct. This model was executed to the three questionnaires to determine whether the theoretical factor structure fi t well, regardless of the directionality given to the items.
The second model assumes that the 15 items measure two latent variables, one corresponding to the positive part of the items and the other to the negative part. Both variables are correlated (Figure 6).
The third model assumes that the 15 items measure two latent variables, one corresponding to the positive part of the items, and the other to the negative part. The two variables are not correlated, because they do not measure a common construct; furthermore, according to Alexandrov (2010), positively and negatively worded items are not true opposites (Figure 7).
It was found that the theoretical model fi ts the Positive questionnaire better, according to the CFI and TLI incremental fi t indices (Table 4). In addition, all coeffi cients are signifi cant using the Z test generated by the software STATA 12.0, which indicates that the model is more strongly validated. In the case of the data from the other two questionnaires, several non-signifi cant coeffi cients (p<.05) were found. In the Combined 1 model, the acceptance coeffi cient with Item 7 and 13 is not signifi cant, while update coeffi cients are not signifi cant with Items 6, 11, 12 and 14. In the Combined 2 model, the integration coeffi cient is not signifi cant with Item 4, while the acceptance coeffi cient is not signifi cant with Items 7 and 13, the update coeffi cient with Items 6 and 14, and the ratio coeffi cients integration-update and acceptance-update.
Positive
Combined 1
Combined 2
Questionnaire
29,9%
0,0 10,0 20,0 30,0 40,0 25,3%
10,3%
Figure 4. Percentage of subjects with contradictory answers, according to questionnaire type. There is a signifi cant difference between proportions (Chi square, p<0.05)
Table 3
Cronbach’s alpha of the scales, according to questionnaire type
Scale Positive Combined 1 Combined 2
Integration 0.78 0.52 0.49
Acceptance 0.72 0.39 0.38
Actualization 0.72 0.20 0.40
Integration Acceptance Actualization
|1 |4 |7 |8 |14 |2 |6 |9 |12 |15 |3 |5 |10 |11 |13
1 2 3 4 5 6 7 8 9 10 11 12 13 14 15
Figure 5. Model 1. Factorial structure of the scale
Negative Positive
|1 |3 |6 |8 |10 |12 |14 |2 |4 |5 |7 |9 |11 |13 |15
1 2 3 4 5 6 7 8 9 10 11 12 13 14 15
Figure 6. Model 2. Scale’s alternative factorial structure
Negative Positive
|1 |3 |6 |8 |10 |12 |14
1 2 3 4 5 6 7
|2 |4 |5 |7 |9 |11 |13 |15
8 9 10 11 12 13 14 15
Using the combined questionnaires shows that the second model improves the fi t to the observed variance and covariance matrix (Table 4); all fi t indices improved compared to the results of the fi rst model. In addition, this second model for these questionnaires was more strongly validated, with almost all coeffi cients being signifi cant (p<.05). The coeffi cient of the latent positive/latent negative variable is not signifi cant in any of the three cases of Model 2. Regarding the third model, results are very similar. Fit of the Combined 1 and Combined 2 questionnaires is improved with respect to the fi rst model, while the positive questionnaire shows its worse fi t.
Discussion and conclusions
This study analyzes the potential advantages and disadvantages of combining positive and negative items on scales, and to do so, it analyzes 15 items measuring three dimensions of the Keyes social well-being scale, translated to Spanish. The analysis is intended to answer fi ve questions posed in the introduction to this document.
The fi rst two questions to be answered were: (a) Are there differences in how subjects respond to positive and negative items? (b) Are there differences in how subjects respond to items phrased as direct negation and positive negation?
Findings of the analysis show that the scores for responses to positive items in the combined questionnaires do not differ from the scores for their counterparts in the Positive questionnaire. That is, negative items do not affect the response pattern for positive items when combined in the same scale.
However, the response pattern for positive items is different from its negative counterpart. It is clear that positive items tend to have higher scores than those of their negatively-phrased counterparts, even when the scale for scoring the negative responses has been inverted. This result is in line with fi ndings of Weems et al (2006) and Guyatt, Cook, King, Norman, Kane, and Van Ineveld (1999). Another point that should be mentioned is that the scores of positive items are more like those for items of direct negation than
like those of negative items worded using polar opposites. This suggests that subjects do not respond in the same way to all types of negative items.
The third question was whether the combination of positive and negative items reduces acquiescence bias. The answer to this question is affi rmative, as subjects responding to combined questionnaires gave responses which conformed less to the directionality of the items, although differences with respect to the positive questionnaire are not marked. According to other authors, bias reduction may depend on que amount of reversed items the instrument has. Sonderen, Sanderman and Coyne (2013) conclude that the acquiescence bias is not averted by reverting half of the items. This is in line with Weijters, Geuens and Schillewaert’s conclusions (2009), who determine that when reversed items are very close to one another, they tend to correlate with each other because, at a cognitive level, the person perceives them as similar. However, when the reversed item appears every 6 items, a positive impact is generated because the person perceives a difference that makes him/her think.
The fourth and fi fth questions were intended to determine whether there are lower levels of internal consistency of scales when positive and negative items are combined, and the results of analysis show that there is indeed less consistency in the responses in the Combined questionnaires. It was found that the scales of combined items had lower levels of reliability and greater frequencies of inconsistent responses. Colosi (2005) and Merritt (2012) found that such inconsistencies may be associated with tiredness or fatigue when completing the questionnaire. According to these authors, as the time necessary to complete the instrument increases, the frequency of inconsistent responses increases as well. This phenomenon could have infl uenced the results of this study, if it is taken into account that, before answering the subjective social wellbeing items, 35 items from other scales had been applied. Another aspect which apparently is related to inconsistent responses on negative items is the capacity for comprehension of what is read by the surveyed subjects. Some authors have found that
Table 4
Fit indices for the models and number of non-signifi cant coeffi cients
Chi2(Df) CFI TLI RMSE SRMR Coef. Ns
Model 1_ positive instrument 207.7(87) 0.88 0.85 0.08 0.07 0
Model 1_ combined instrument 1 229.9(87) 0.58 0.51 0.08 0.09 6
Model 1_ combined instrument 2 182.1(87) 0.71 0.65 0.07 0.08 7
Model 2_ positive instrument 360.1(89) 0.73 0.68 0.11 0.08 1
Model 2_ combined instrument 1 163.0(89) 0.78 0.74 0.06 0.07 1
Model 2_ combined instrument 2 147.9(89) 0.82 0.79 0.05 0.07 2
Model 3_ positive instrument 589.2(90) 0.50 0.41 0.15 0.21 0
Model 3_ combined instrument 1 164.2(90) 0.78 0.74 0.06 0.07 0
Model 3_ combined instrument 2 148.2(90) 0.82 0.79 0.05 0.07 1
Chi2. Chi square Df. degrees of freedom CFI.Comparative Fit index
TLI. Tucker Lewis incremental Fit index RMSE: Root Mean Square Error
SRMR: standardized root mean square residual
Coef.Ns: Number of non-signifi cant coeffi cients (p>0.05)
the biases generated by negative items are stronger in those with less education and lower reading comprehension capacity (Marsh, 1984; Weems et al., 2006; Meisenberg & Williams, 2008).
It is interesting that Blanco and Díaz (2005) obtained internal consistency coeffi cients greater than those obtained in the present study (0.69 to 0.83), in spite of the fact that they combined positive and negative items in the scales. A possible reason for this is that the authors combined less positive and negative items in each scale. For instance, in the social acceptance scale all the items were aimed at the same direction and the other two scales only had an item opposed to the directionality of the rest.
The differences may also lay on the type of population participating in both studies, and the way in which the instrument was applied. While Blanco and Díaz (2005) conducted their study with a considerable amount of university psychology students, the present study was mostly carried out with a low educational level, who may have more cognitive diffi culties to detect differences in the directionality of an item.
On the other hand, in the study carried out in Spain, the instrument was self-administered, while in the present study the survey was carried out through telephone interviews. Possibly, it may be easier to detect the difference in directionality of an item when the interviewee can read it than when he or she can only listen to it over the telephone; however, this is just an assumption that must be investigated. For this, it would be necessary to fi nd out if a telephone interview may lead to respondents’ tiredness of loss of attention faster, based on questionnaires with different durations.
The last research question asked whether factorial validity was impaired by combining positive and negative items. The results clearly showed that when only positive items were used, the data was much better adjusted to the theoretical factor structure, and the theoretical model of the measured construct showed greater validity and reliability. This occurs because in the combined questionnaires, negative items tended to be intercorrelated, regardless of whether there were positive and negative items that belonged to the same dimension of the construct being measured.
The question that is left at the end of the analysis is what to do when one wants to use a scale. Is it better to use only positive items and be exposed to the possibility of acquiescence bias, or combine negative and positive items and be exposed to the possibility of inconsistent responses and alterations in the internal consistency of the scales?
The two alternatives have different implications when validating a scale or evaluating a conceptual model. A scale with positive items can promote common variance bias, causing infl ated correlations and a more favorable picture of the model evaluated. On the other hand, the combination of positive and negative items
could lead to invalidation of a proposed scale or model, which could in fact be valid and reliable.
In this situation, it may be diffi cult to make a decision, but it may be easier to control for the bias produced by positive items by occasionally warning the subjects of the importance of their responses. The interviewer should also be prepared to moderate his or her tone of voice and repeat a question when the respondent appears to respond without thinking. Even identifying the individual who apparently responded without really paying attention, to simply pass on to the next step, would provide data for subsequent analysis. However, bias in terms of inconsistent responses may be more diffi cult to control for, and the higher correlation between negative items on the one hand, and between positive items on the other hand requires more cognitive research to understand. Hughes (2009) recommends that if the researcher decides to reverse items in spite of the implications this may have, he or she must try to verify whether, in the pilot test of the instrument, the respondents are able to detect the reversed items.
The results of this study also suggest a greater presence of bias in terms of inconsistency than in terms of acquiescence. Although there is a somewhat greater tendency to respond in the same direction as that of the items when all items are positive, this tendency was not strongly seen in this case, despite that response inconsistencies do seem to be more pronounced in the combined questionnaires.
There are many aspects related to the objectives of this study to be further explored in the future. One is to analyze the impact of adding negative items to scales in other types of surveys, such as self-administered surveys. It is also necessary to explore, using cognitive interviews, the differences between items phrased using direct negation and negative items using polar opposition. New methods for controlling for biases in scales composed of positive items and those with combined terms should be sought, either in terms of preventive mechanisms during the process of gathering information, or methodologies for control during the process of analysis.
The results obtained in this study should be corroborated in specifi c populations, such as in highly educated and poorly educated subjects, to determine whether the biases are present with the same strength in different populations. They should also be corroborated in other Spanish-speaking populations.
Finally, the present research is limited because the three instruments were applied on different samples, giving way to the possibility that the differences between the three instruments are due to this. To strengthen validity of the fi ndings of this research, it will be necessary to apply the scale with positive items, and the scale combining positive and negative items, to the same sample, in different periods of time to prevent respondents to remember the way in which they responded the fi rst time.
References
Alexandrov, A. (2010). Characteristics of single-item measures in Likert Scale format. The Electronic Journal of Business Research Methods, 8(1), 1-12.
Blanco, A., & Díaz, D. (2005). El bienestar social: su concepto y medición [Social well–being: Theoretical structure and measurement]. Psicothema, 17(4), 582-589.
Baumgartner, H., & Steenkamp, J.B.E. (2001). Response styles in marketing research: A cross national investigation. Journal of Marketing Research, 38(2), 143-156.
Colosi, R. (2005). Negatively worded questions cause respondent confusion. Proceedings of the Survey Research Methods Section, American Statistical Association (2005), 2896-2903.
DeVellis, R.F. (2003). Scale development: Theory and applications (2nd ed), Sage Publications.
Ebesutani, C., Drescher, C.F., Reise, S.P., Heiden, L., Hight, T.L., Damon, J.D., & Young, J. (2012). The loneliness questionnaire–short version: An evaluation of reverse-worded and non-reverse-worded items via item response theory. Journal of Personality Assessment, 94(4), 427-437.
Hughes, G.D. (2009). The impact of incorrect responses to reverse-coded survey items. Research in the Schools, 16(2), 76-88.
Johnson, J.M., Bristow, D.N., & Schneider, K.C. (2011). Did you understand the question or not? An investigation of negatively worded questions ins survey research. Journal of Applied Business Research, 20(1), 75-86.
Kalton, G., Kollins, M., & Brook, L. (1978). Experiments in wording opinion questions. Journal of the Royal Statistical Society, 27(2), 149-161.
Keyes, C.L.M. (1998). Social well-being. Social Psychology Quarterly, 61, 121-140.
Marsh, H.W. (1984). The bias of negatively worded items in ratings scales for preadolescent children: A cognitive-developmental phenomenon. Washington, D.C: Educational Resources Information Center. Marin, G., Gamba, R.J., & Marin, B.V. (1992). Extreme response style
and acquiescence among hispanics: The role of acculturation and education. Journal of Cross-Cultural Psychology, 23(4), 498-509. Meisenberg, G., & Williams, A. (2008). Are acquiescent and extreme
response styles related to low intelligence and education? Personality and Individual Differences, 44(7), 1539-1550.
Merritt, S.M. (2012). The two-factor solution to Allen and Meyer’s (1990) affective commitment scale: Effects of negatively worded items. Journal of Business and Psychology, 27(4), 421-436.
Nunnally, J.C. (1978). Psychometric theory (2nd ed.). New York: McGraw-Hill.
Podsakoff, P.M., MacKenzie, S.B., Lee, J.Y., & Podsakoff, N.P. (2003). Common method biases in behavioral research: A critical review of the literature and recommended remedies. Journal of Applied Psychology, 88(5), 879-903.
Garg, R.K. (1996). The infl uence of positive and negative wording and issue involvement on responses to Likert scales in marketing research. Journal of the Market Research Society, 38(3), 235-246.
Guyatt, G.H., Cook, D.J., King, D., Norman, G.R., Kane, S.L., & Van Ineveld, C. (1999). Effect of the framing of questionnaire items regarding satisfaction with training on residents’ responses. Academic Medicine, 74(2), 192-194.
Roszkowski, M.J., & Soven, M. (2010). Shifting gears: Consequences of including two negatively worded items in the middle of a positively worded questionnaire. Assessment & Evaluation in Higher Education, 35(1), 113-130.
Sauro, J., & Lewis, J.R. (2011). When designing usability questionnaires, does it hurt to be positive? In Proceedings of the SIGCHI Conference on Human Factors in Computing Systems (pp. 2215-2224). ACM. Schriesheim, C.A., Eisenbach, R.J., & Hill, K.D. (1991). The effect of
negation and polar opposite polar reversals on questionnaire reliability and validity: An experimental investigation. Educational and Psychological Measurement, 51(1), 67-78.
Schriesheim, C.A., & Eisenbach, R.J. (1995). An exploratory and confi rmatory factor-analytic investigation of item wording effects on the obtained factor structures of survey questionnaire measures. Journal of Management, 21(6), 1177-1193.
Van Sonderen, E., Sanderman, R., & Coyne, J.C. (2013). Ineffectiveness of reverse wording of questionnaire items: Let’s learn from cows in the rain. PloS one, 8(7), e68967.
Tomás, J.M., Oliver, A., Galiana, L., Sancho, P., & Lila, M. (2013). Explaining method effects associated with negatively worded items in trait and state global and domain-specifi c self-esteem scales. Structural Equation Modeling: A Multidisciplinary Journal, 20(2), 299-313. Van Dam, N.T., Hobkirk, A.L., Danoff-Burg, S., & Earleywine, M. (2012).
Mind your words: Positive and negative items create method effects on the Five Facet Mindfulness Questionnaire. Assessment, 19, 198-204. Weems, G.H., Onwuegbuzie, A.J., & Collins, K.M. (2006). The role of
reading comprehension in responses to positively and negatively worded items on rating scales. Evaluation & Research in Education, 19(1), 3-20.
Weems, G.H., Onwuegbuzie, A.J., Schreiber, J.B., & Eggers, S.J. (2003). Characteristics of respondents who respond differently to positively and negatively worded items on rating scales. Assessment and Evaluation in Higher Education, 28(6), 587-606.
Weijters, B., & Baumgartner, H. (2012). Misresponse to reversed and negated items in surveys: A review. Journal of Marketing Research, 49(5), 737-747.
Weijters, B., Geuens, M., & Schillewaert, N. (2009). The proximity effect: The role of inter-item distance on reverse-item bias. International Journal of Research in Marketing, 26(1), 2-12.
Wong, N., Rindfl eisch, A., & Burroghs, J.E. (2003). Do reversed worded items confound measures un cross cultural consumer research? The case of material values scale. Journal of Consumer Research, 30(1), 72-91.