A Single Question of Parent Reported Physical Activity Levels Estimates Objectively Measured Physical Fitness and Body Composition in Preschool Children: The PREFIT Project
9
0
0
Texto completo
(2) Palou et al.. PA Estimates Fitness and Body Composition. parent-reported physical activity levels (all p < 0.017 and all p < 0.001, respectively), as well as, for the fitness index (p < 0.001). Our study suggests that in school settings with insufficient resources to objectively assess fitness and body composition, parentsreported physical activity level by means of a single question might provide useful information about these important health markers in preschool children. Keywords: physical fitness, motor activity, body composition, fatness, physical activity, preschool children. et al., 2014; Ortega et al., 2015; Sanchez-Delgado et al., 2015; Cadenas-Sanchez et al., 2016a; Mora-Gonzalez et al., 2017). In this context, the PREFIT project group has recently provided for the first time the physical fitness reference standards for preschool children (Cadenas-Sánchez et al., 2019b). Since obesity and low fitness are important markers of health through the lifespan (Ortega et al., 2018), it is of public health interest to study determinants of these two modifiable risk factors as early as possible, being preschool age a sensitive stage of life. Thus, physical inactivity is a recognized determinant of obesity and low physical fitness, and it would be interesting to explore associations of physical activity with physical fitness and body composition in preschool children. Although objective methods, such as accelerometers, to assess physical activity in young individuals are preferable (Migueles et al., 2017), they have some practical limitations and most importantly they are not feasible under certain circumstances in the school context. Alternatively, parent-reported physical activity levels of their children are an alternative method, and it is of interest to test whether a single question on parents’ rated physical activity level is able for screening a set of important physical fitness and body composition markers in preschool children. If so, this method could be a very useful and economic tool to be used as a predictor of health markers in preschool, similarly to what selfreported PA of older children (10–12 years old) showed in a large epidemiological study (Jiménez-Pavón et al., 2012). Therefore, the aim of this study is to test whether a single question regarding the physical activity of children, reported by their parents, could be used as a screening tool of objectively measured physical fitness and body composition in preschool children.. INTRODUCTION Obesity is a worldwide concern that is growing among children and adolescents (Abarca-Gómez et al., 2017), and has even begun to occur in preschool children (Cadenas-Sánchez et al., 2019a). The early onset of obesity seems to be related to the occurrence of associated complications such as metabolic and cardiovascular disorders, and the risks depend partly on the age of onset and on the duration of obesity (Umer et al., 2017; Ho et al., 2019). Particularly worrying is the data coming from the World Health Organization (WHO) whose results demonstrated that in 2014 more than 41 million of children under 5 years old were classified as overweight/obese, and this fact will continue to worsen (World Health Organization, 2016). At European level, a higher prevalence of overweight/obese preschool in the south of Europe was observed, compared to those children from the north (Cadenas-Sanchez et al., 2016b). In addition, in a European cohort of 3120 children aged 2–9 years old (1016 from 2 to 6 years old) objectively measured physical activity was found an important factor to protect against clustering of CVD risk factors in young children (Jiménez-Pavón et al., 2013). At the national level, our group found that 35% of the preschoolers examined presented overweight/obesity were already 1.3% morbid obese (Cadenas-Sánchez et al., 2019a). A recent study with a population-based sample of 51,505 children found that the most rapid weight gain occurs between 2 and 6 years of age being those obese at that age also obese adolescents (Geserick et al., 2018). Despite preschool years represents an opportunity for obesity surveillance it is still challenging in the WHO European Region (Jones et al., 2017). In addition to obesity, a low physical fitness level in childhood/adolescence has been considered a marker of poor health and a risk factor for multiple health outcomes at these ages and later in life (Ortega et al., 2008b; Ruiz et al., 2009). In this context, it has been shown that higher levels of cardiorespiratory fitness during childhood are related to lower risk of becoming overweight/obese across puberty (Ortega et al., 2011). However, such information is not available in preschool children, which could be due, at least partially, to the fact that there was no information about which fitness tests should be used in preschool children. A systematic review searching for any study relating fitness in preschool age with health outcomes, found no studies in this direction (Ortega et al., 2015). Fortunately, over the last years, more evidence has been accumulated on which fitness tests are more feasible, reliable and valid to be used in preschool children, in particular the PREFIT (Assessing FITness in PREschoolers) battery, which will provide new avenues to study the role of fitness in health at these early ages and later in life (Cadenas-Sánchez. Frontiers in Psychology | www.frontiersin.org. MATERIALS AND METHODS Participants and Study Design The present study was performed under the framework of the PREFIT project1 (Cadenas-Sánchez et al., 2014; Ortega et al., 2015; Sanchez-Delgado et al., 2015; Cadenas-Sanchez et al., 2016a; Mora-Gonzalez et al., 2017; Labayen et al., 2018). Briefly, the aim of the project was to propose a physical fitness test battery of feasible and reliable field-based tests to assess physical fitness in children aged 3–5 years and to report reference values for a better interpretation of physical fitness assessment (Cadenas-Sánchez et al., 2019a,b). 1. 2. http://profith.ugr.es/prefit. July 2019 | Volume 10 | Article 1585.
(3) Palou et al.. PA Estimates Fitness and Body Composition. The 4 × 10 m SRT was used to assess speed/agility. This test consisted of running and turning as fast as possible between two parallel lines (10 m apart). To make this test easier to understand and perform for preschool children, we did not use sponges to be exchanged when crossing the lines (4 × 10 m), as the original protocol does in older children (Ortega et al., 2008a). Instead, two evaluators were located behind each line and participants had to touch the examiner’s hand and go back at maximum speed. The result was measured with a stopwatch (Tremblay, CHRO 300, Gleizé, France) to the nearest 0.1 s. The best of two attempts was recorded in seconds. A higher score indicates worse performance.. After several methodological studies to define the PREFIT fitness battery (Cadenas-Sánchez et al., 2014; Ortega et al., 2015; Sanchez-Delgado et al., 2015; Cadenas-Sanchez et al., 2016a; Mora-Gonzalez et al., 2017), we set up PREFIT-Spain, aiming to measure physical fitness in a geographically distributed sample of preschool children across Spain. The project involved data collection in 10 cities from the south, center, and north of Spain, gathering a total of 3179 (M: 4.60; SD: 0.87) healthy preschool children (52.8% boys and 47.2% girls) aged between 3 and 5 years (Cadenas-Sanchez et al., 2016a). Parents or legal guardians were informed about the purpose of the study and written informed consent was obtained from the parents of all participants. The study protocol was performed in accordance with the ethical standards and was approved by the Review Committee for Research Involving Human Subjects at the University of Granada (n◦ 845).. Body Composition Weight (kg) was measured without shoes and in light clothing using an electronic scale (SECA Model 869, Hamburg, Germany). Height (cm) was measured in the Frankfort plane without shoes using a stadiometer (SECA Model 213). BMI was calculated based on weight divided by height squared. The cut-off points used to classify weight status categories were those established by World Obesity Federation (WOF)3 , formerly International Obesity Task Force (IOTF) (Cole and Lobstein, 2012) and by the WHO (de Onis et al., 2007). Waist circumference (cm) was measured at the umbilical location with a non-elastic tape (SECA Model 200) at the end of a normal expiration without the tape compressing the skin. The waist-to-height ratio was calculated as waist circumference divided by height in centimeters. All measures were taken twice and the mean of the two measurements was used for analyses. All measurements were harmonized following a strict protocol to ensure standardization.. Procedure and Measures The PREFIT battery comprises the following tests2 : the PREFIT 20-meters shuttle-run test (PREFIT 20 m SRT) to assess cardiorespiratory fitness, handgrip strength and standing long jump tests to assess muscular strength (upper and lower limbs, respectively), 4 × 10 m SRT to assess speed-agility and oneleg stance test to assess balance (Cadenas-Sanchez et al., 2016a); and weight, height, body mass index (BMI), waist circumference, and waist-to-height ratio to assess body composition indicators. Children were assessed individually in a school-setting by trained evaluators using the following standardized equipment and procedures. Before starting the tests, evaluators performed an example to ensure that the child understood the test correctly.. Physical Activity As an indirect measure of the physical activity level of the children, parents were asked to answer the following question: “Your children’s physical activity level excluding school time is . . .?” The response options were very low, low, average, high, or very high. The response frequency by categories of parentreported physical activity levels is shown in Supplementary Figure S1. For analyses, the very low and low categories were merged due to the low response frequency of the very low category.. Physical Fitness Measures Cardiorespiratory fitness was assessed using a modified version of the original 20 m shuttle run test (SRT): the PREFIT 20 m SRT (Cadenas-Sánchez et al., 2014; Mora-Gonzalez et al., 2017). Participants had to run back and forth between 2 lines 20 m apart with an audio signal. The test finished when the child failed to reach the end lines concurrent with the audio signal on two consecutive occasions or when the child stops because of exhaustion. The initial stage of the PREFIT 20 m SRT was 6.5 km h−1 . The handgrip strength test measures the maximal strength of the upper limb using an analog dynamometer (TKK 5001, GripA, Takei, Tokyo, Japan). The test protocol is reported elsewhere (España-Romero et al., 2010). The grip spans were fixed at 4.0 cm (Sanchez-Delgado et al., 2015). The best value of the two attempts for each hand was chosen, and the average of both was registered in kilograms (kg). The standing long jump test assesses the explosive strength of the lower limbs. This test consisted of jumping as far as possible with the feet together and remaining upright. The distance was measured from the take-off line to the point where the back of the heel nearest to the take-off line lands on the ground. The better of two attempts were recorded in centimeters (cm). 2. Confounders Paternal and maternal educational was assessed by self-report questionnaire and can be consulted elsewhere (Merino-De Haro et al., 2018). A variable with three categories was calculated for analyses and for each parent: low (no education or primary school education), medium (secondary school education, uppersecondary school education, or technical training), and high (university education). Only, age, gender, and maternal education level were introduced as potential confounders.. Statistical Analysis Firstly, we explored which potential confounders were more strongly correlated with the study outcomes. Maternal education was more strongly associated than paternal education with 3. http://profith.ugr.es/recursos-prefit?lang=en. Frontiers in Psychology | www.frontiersin.org. 3. http://www.worldobesity.org/. July 2019 | Volume 10 | Article 1585.
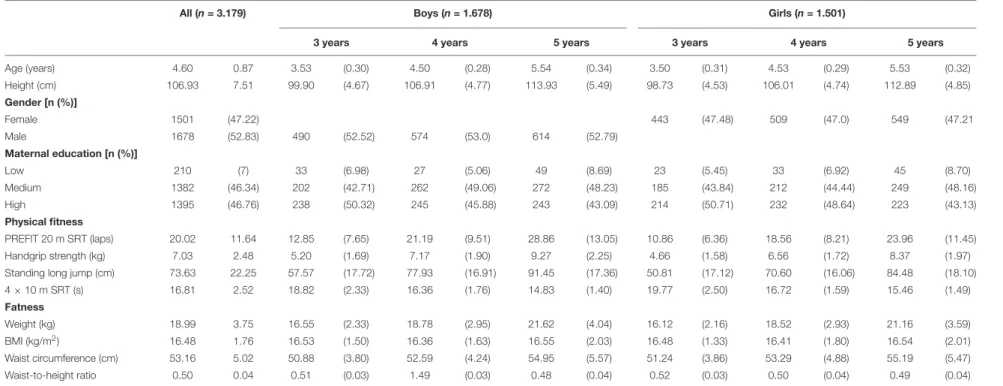
(4) Palou et al.. Frontiers in Psychology | www.frontiersin.org. TABLE 1 | Descriptive characteristics of the study population (n = 3.179). All (n = 3.179). Boys (n = 1.678) 3 years. Girls (n = 1.501). 4 years. 5 years. 3 years. 4 years. 5 years. Age (years). 4.60. 0.87. 3.53. (0.30). 4.50. (0.28). 5.54. (0.34). 3.50. (0.31). 4.53. (0.29). 5.53. (0.32). Height (cm). 106.93. 7.51. 99.90. (4.67). 106.91. (4.77). 113.93. (5.49). 98.73. (4.53). 106.01. (4.74). 112.89. (4.85). Female. 1501. (47.22). 443. (47.48). 509. (47.0). 549. (47.21. Male. 1678. (52.83). 490. (52.52). 574. (53.0). 614. (52.79). Gender [n (%)]. Maternal education [n (%)]. 4. Low. 210. (7). 33. (6.98). 27. (5.06). 49. (8.69). 23. (5.45). 33. (6.92). 45. (8.70). Medium. 1382. (46.34). 202. (42.71). 262. (49.06). 272. (48.23). 185. (43.84). 212. (44.44). 249. (48.16). High. 1395. (46.76). 238. (50.32). 245. (45.88). 243. (43.09). 214. (50.71). 232. (48.64). 223. (43.13). PREFIT 20 m SRT (laps). 20.02. 11.64. 12.85. (7.65). 21.19. (9.51). 28.86. (13.05). 10.86. (6.36). 18.56. (8.21). 23.96. (11.45). Handgrip strength (kg). 7.03. 2.48. 5.20. (1.69). 7.17. (1.90). 9.27. (2.25). 4.66. (1.58). 6.56. (1.72). 8.37. (1.97). Standing long jump (cm). 73.63. 22.25. 57.57. (17.72). 77.93. (16.91). 91.45. (17.36). 50.81. (17.12). 70.60. (16.06). 84.48. (18.10). 4 × 10 m SRT (s). 16.81. 2.52. 18.82. (2.33). 16.36. (1.76). 14.83. (1.40). 19.77. (2.50). 16.72. (1.59). 15.46. (1.49). Physical fitness. Fatness 18.99. 3.75. 16.55. (2.33). 18.78. (2.95). 21.62. (4.04). 16.12. (2.16). 18.52. (2.93). 21.16. (3.59). BMI (kg/m2 ). 16.48. 1.76. 16.53. (1.50). 16.36. (1.63). 16.55. (2.03). 16.48. (1.33). 16.41. (1.80). 16.54. (2.01). Waist circumference (cm). 53.16. 5.02. 50.88. (3.80). 52.59. (4.24). 54.95. (5.57). 51.24. (3.86). 53.29. (4.88). 55.19. (5.47). Waist-to-height ratio. 0.50. 0.04. 0.51. (0.03). 1.49. (0.03). 0.48. (0.04). 0.52. (0.03). 0.50. (0.04). 0.49. (0.04). SD, standard deviation; SRT, shuttle run test; BMI, body mass index. Values are presented as mean and standard deviation. July 2019 | Volume 10 | Article 1585. PA Estimates Fitness and Body Composition. Weight (kg).
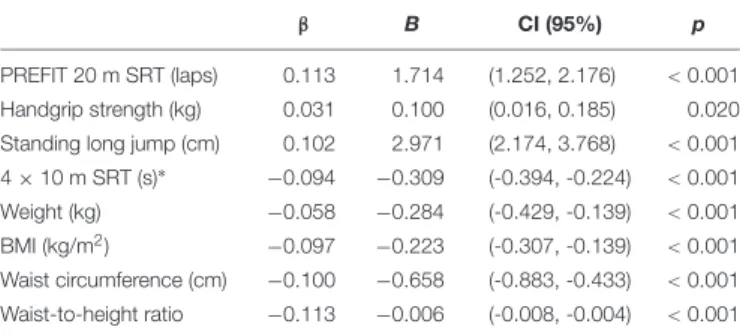
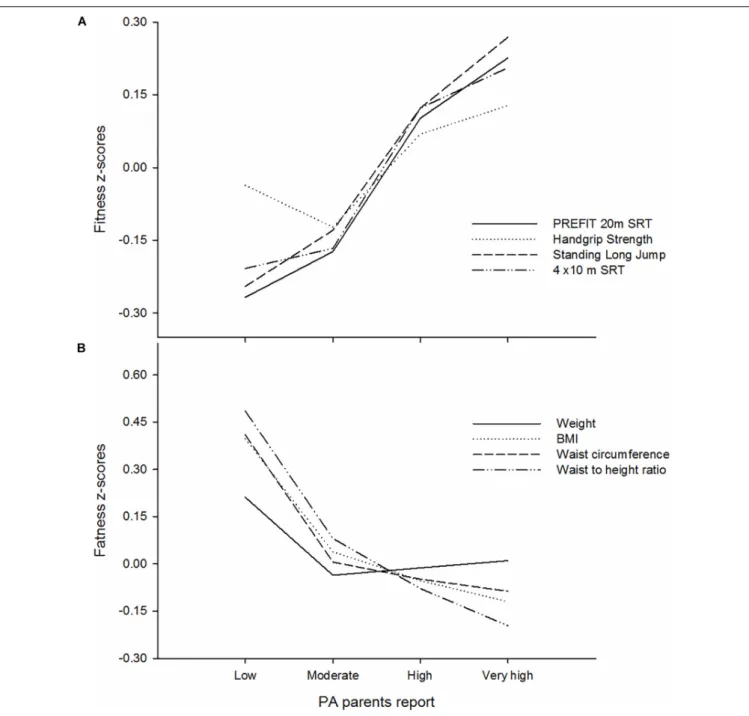
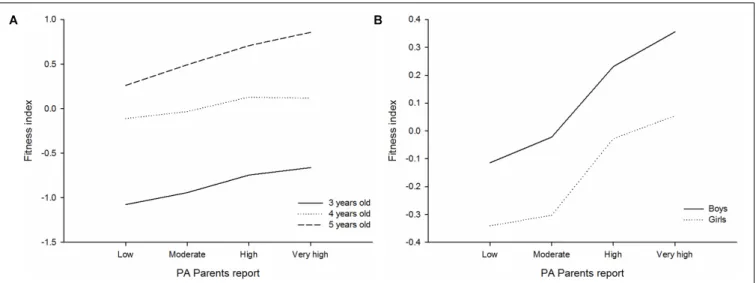
(5) Palou et al.. PA Estimates Fitness and Body Composition. each category of the parent-reported physical activity levels after a Bonferroni adjustment (all p < 0.038). There were pairwise significant differences in each category of the parent-reported physical activity levels after a Bonferroni adjustment and all body composition z-scores between (all p < 0.036). However, these pairwise significant differences were not seen between the high and very high categories in neither physical fitness z-scores nor body composition z-scores (prange = 0.059 to 0.934 and prange = 0.128 to.355, respectively). The results show the differences in physical fitness index across parent-reported physical activity levels, by age (Figure 2A) and gender (Figure 2B). The results showed significant differences in the fitness index across the parent-reported physical activity levels (p < 0.001). There were pairwise significant differences in the fitness index between each category of parent-reported physical activity levels after a Bonferroni adjustment (all p < 0.001). However, these pairwise significant differences were not seen between the high and very high categories (p = 0.102). No interaction effect was seen for age groups (p = 0.233) nor gender (p = 0.722).. study outcomes and, thus, it was a better predictor. Partial correlation adjusted for potential confounders were used to examine the association of parent-reported physical activity levels with physical fitness and body composition indicators. To study the association of parent-reported physical activity levels with physical fitness (PREFIT 20 m SRT, handgrip strength test, standing long jump, 4 × 10 m SRT) and body composition outcomes (weight, BMI, waist circumference, waist-to-height ratio), we conducted linear regression analysis inserting the physical fitness and body composition outcomes as dependent variables and parent-reported physical activity levels as independent variable, adjusted for sex, age and maternal education. Additionally, physical fitness and body composition z-scores were created and explored using analysis of covariance (adjusted for confounders) with a Bonferroni adjustment according to parent-reported physical activity levels. Also, it was created a fitness index using the average of physical fitness z-scores divided by the number of fitness outcomes (PREFIT 20 m SRT, standing long jump, 4 × 10 m SRT), and explored with an analysis of covariance with a Bonferroni adjustment according to parent-reported physical activity levels. All analyses were performed using the Statistical Package for Social Sciences (IBM SPSS Statistics for Windows, version 21.0, Armonk, NY) and the level of significance was set at p < 0.05. Graphics were performed using Sigmaplot version 12.5 for Windows (Systat Software, Inc., San Jose, CA, United States).. DISCUSSION This study provides evidence supporting that a single and very simple question of physical activity reported by parents can significantly estimate the physical fitness and body composition of preschool children (aged 3–5 years). More specifically, our findings support that: (1) parent-reported physical activity levels are positively associated with objectively measured physical fitness, as measured by means of the PREFIT 20 m SRT, handgrip strength, standing long jump and the 4 × 10 m SRT in children aged 3–5 years; (2) parent-reported physical activity levels are negatively related to body composition indicators, as measured by weight, BMI, waist circumference and waistto-height ratio in children aged 3–5 years; and (3) there. RESULTS Descriptive characteristics of the physical fitness and body composition indicators of the sample stratified by sex and age groups (3, 4, and 5 years) are presented in Table 1, as means and standard deviation. The response frequency of parent-reported physical activity levels (for the whole sample and by sex) is illustrated in Supplementary Figure S1. The results show the association of parent-reported physical activity levels between physical fitness and body composition measures after adjusting for sex, age and maternal education in preschool children. Children whose parents reported to have higher physical activity levels had a higher level of physical fitness in all indicators (βrange = −0.094 to 0.113, and p-value from 0.020 to <0.001) (Table 2). Otherwise, it was observed a negative association between parent-reported physical activity levels and all body composition indicators after adjusting for sex, age and maternal education (βrange = −0.058 to −0.113, all p < 0.001). The results showed similar trends for physical fitness and body composition of children with different age and sex (see Supplementary Tables S1 and S2, respectively). The results show the differences in objectively measured physical fitness z-scores (panel A) and body composition z-scores (panel B) across parent-reported physical activity levels. The results showed significant differences in all physical fitness and body composition z-scores across the parent-reported physical activity levels (all p < 0.017 and all p < 0.001, respectively) (Figure 1). There were pairwise significant differences in PREFIT 20 m SRT, standing long jump and the 4 × 10 m SRT between. Frontiers in Psychology | www.frontiersin.org. TABLE 2 | Associations of parents-reported physical activity levels with objectively measured physical fitness and body composition in preschool children (n = 3.179). β. B. PREFIT 20 m SRT (laps). 0.113. 1.714. (1.252, 2.176). Handgrip strength (kg). 0.031. 0.100. (0.016, 0.185). 0.020. Standing long jump (cm). 0.102. 2.971. (2.174, 3.768). < 0.001. CI (95%). p < 0.001. 4 × 10 m SRT (s)∗. −0.094. −0.309. (-0.394, -0.224). < 0.001. Weight (kg). −0.058. −0.284. (-0.429, -0.139). < 0.001. BMI (kg/m2 ). −0.097. −0.223. (-0.307, -0.139). < 0.001. Waist circumference (cm). −0.100. −0.658. (-0.883, -0.433). < 0.001. Waist-to-height ratio. −0.113. −0.006. (-0.008, -0.004). < 0.001. SRT, shuttle run test; BMI, body mass index; β, beta standardized coefficients; B, beta unstandardized coefficients; CI, confidence interval (upper, lower). Parentreported physical activity levels were considered as a predictive variable and physical fitness outcomes (PREFIT 20 m SRT, handgrip strength test, standing long jump and 4 × 10 m SRT) and body composition outcomes (weight, BMI, waist circumference and waist-to-height ratio) were considered as dependent variables. The analyses were adjusted by age, sex, and maternal education. ∗ Lower values indicate better performance.. 5. July 2019 | Volume 10 | Article 1585.
(6) Palou et al.. PA Estimates Fitness and Body Composition. FIGURE 1 | Differences of objectively measured physical fitness z-scores (A) and body composition z-scores (B) across parents-reported physical activity levels in preschool children (n = 3.179). SRT, shuttle run test; BMI, body mass index; PA, physical activity. The analyses were adjusted by age, sex, and maternal education.. are pronounced differences in all physical fitness and body composition z-scores, as well as, in the fitness index across each category of the parent-reported physical activity levels in children aged 3–5 years. This study shows a positive association between parentreported physical activity levels and the PREFIT 20 m SRT. These results are in agreement with previous findings in the adult population (Emaus et al., 2010; Minder et al., 2014). For instance, Murphy et al. (1988) who found that a reported physical activity single question was associated with maximal oxygen consumption, measured by a more valid and reliable technique.. Frontiers in Psychology | www.frontiersin.org. Likewise, Aadahl et al. (2007) showed that reported physical activity was related to objectively measured cardiorespiratory fitness. Nevertheless, in our study inconsistent associations were seen between parent-reported physical activity levels and handgrip strength (see Supplementary Table S1). In fact, when analyses were undertaken by age group only was seen as an association in those older preschool children. This result does not concur with those found in other population of adults where self-reported measures of physical activity were correlated with handgrip strength (Leblanc et al., 2015). In fact, a recent systematic review has found inconsistent associations between. 6. July 2019 | Volume 10 | Article 1585.
(7) Palou et al.. PA Estimates Fitness and Body Composition. FIGURE 2 | Differences of physical fitness index across parent-reported physical activity levels, by age (A) and gender (B) in preschool children (n = 3.179). SRT, shuttle run test; PA, physical activity. The analyses were adjusted by age, sex, and maternal education.. the question proposed in this investigation could be used to perform the first screening with large samples of preschool in order to detect the most extreme cases with a marked risk of worse physical fitness and body composition. Thus, objective and direct measures could be administered only in those participants who have already been detected at higher risk. Therefore, this single question about PA levels would serve to identify children at a higher risk of low fitness and worse body composition avoiding the complications associated with direct and objectively measurement.. muscular fitness and self-reported physical activity in children and adolescents (Smith et al., 2019). Otherwise, our data showed that parent-reported physical activity levels correlate strongly with lower body strength as measured by means of standing long jump. In this sense, it can be hypothesized that uncontrolled variables (fat-free mass, fat mass) in our sample might explain the discrepancies between the associations of parent-reported physical activity levels and the distinct components of the muscular strength (Artero et al., 2010). A negative association between parent-reported physical activity levels and body composition indicators was found in this investigation. To our knowledge, there are no studies that analyze this association in preschool children, and that’s why this study opens a new window in order to estimate childhood obesity based on physical activity information reported by parents. Recent studies have found that higher moderate-to-vigorous physical activity (MVPA) and/or vigorous physical activity of preschool children are associated with better body composition (Leppänen et al., 2016, 2017; Fang et al., 2017). In this context, a self-reported methodology to assess physical activity levels of preschool children has not been recommended (Oliver et al., 2007), however, parents might do with somewhat validity (Pate et al., 2010). Taking this evidence together, it can be suggested that parent-reported physical activity levels of preschool children might be an alternative to estimate objectively measured body composition indicators since physical activity is associated with body composition at an early age. Our results also showed that there was a pronounced difference between children with very low/low physically active (who had worse physical fitness and body composition) and the rest of the categories with higher reported physical activity; however, the question did not discriminate so accurately between those preschool children reported by their parents as being moderate, high and very high active. This finding suggests that our question might be more useful in more extreme cases (between very low/low and high/very high active). In this context,. Frontiers in Psychology | www.frontiersin.org. Limitations and Strengths This research has several limitations. The cross-sectional nature of the study and the use of an indirect measure of physical activity levels should be considered with caution. In addition, despite all associations of parent-reported physical activity levels between physical fitness and body composition were statistically significant the standardized regression coefficients were small. Likewise, the reliability of the single question has not been yet proved, which could be another drawback. To our knowledge, this large, population-based study on preschool children is the first that covers geographically most of the regions of Spain. Also, the use of a quick and single question able to identify vital markers of physical health at such early ages should be considered as something powerful.. CONCLUSION Our study suggests that a single question of parent-reported physical activity levels might provide meaningful information to identify children at a higher risk of important physical health markers such as physical fitness and body composition in preschool children. Therefore, a single question could be an alternative for a physical health screening at early ages, especially for epidemiological and intervention studies with insufficient. 7. July 2019 | Volume 10 | Article 1585.
(8) Palou et al.. PA Estimates Fitness and Body Composition. CC-S and FBO conceptualized and designed the study. CC-S organized the database. AM-M, CC-S, FBO, and JV-C carried out the statistical analysis. PP, AM-M, JC, PB, FBO, and JVC wrote the first draft of the manuscript. PP, AM-M, JC, PB, FBO, and JV-C wrote the sections of the manuscript. All authors contributed to the manuscript revision, read, and approved the final version of the manuscript.. Programme under the grant agreement no. 667302, the University of Granada, Plan Propio de Investigación 2016, Excellence Actions: Units of Excellence, the Unit of Excellence on Exercise and Health (UCEES), the Junta de Andalucia, Consejeria de Conocimiento, Investigación y Universidades, the EXERNET Research Network on Exercise and Health in Special Populations (DEP2005-00046/ACTI), the SAMID III Network, RETICS, funded by the PN I+D+I 2017-2021 (Spain), ISCIII-Sub-Directorate General for Research Assessment and Promotion, and the European Regional Development Fund (ERDF) (Ref. RD16/002). IL was supported by the Spanish Ministry of Economy and Competitiveness (DEP2016-78377R), the “Fondos Estructurales de la Unión Europea (FEDER), Una manera de hacer Europa”, the Public University of Navarra, Plan de Promoción de Grupos de Investigación, and the EXERNET Research Network on Exercise and Health in Special Populations (DEP2005-00046/ACTI). DJ-P was supported by a grant from the Spanish Ministry of Science and Innovation – MINECO (RYC-2014-16938), the Spanish Ministry of Economy and Competitiveness – MINECO/FEDER (DEP2016-76123-R), the Government of Andalusia, Integrated Territorial Initiative 2014–2020 for the province of Cádiz (PI-0002-2017), the European Union’s ERASMUS+SPORT Programme (Grant Agreement 603121-EPP-1-2018-1-ES-SPOSCP), and the EXERNET Research Network on Exercise and Health in Special Populations (DEP2005-00046/ACTI).. FUNDING. SUPPLEMENTARY MATERIAL. FBO was supported by the Spanish Ministry of Economy and Competitiveness – MINECO/FEDER DEP2016-79512-R, the European Union’s Horizon 2020 Research and Innovation. The Supplementary Material for this article can be found online at: https://www.frontiersin.org/articles/10.3389/fpsyg. 2019.01585/full#supplementary-material. REFERENCES. Cadenas-Sánchez, C., Intemann, T., Labayen, I., Peinado, A. B., Vidal-Conti, J., Sanchis-Moysi, J., et al. (2019b). Physical fitness reference standards for preschool children: the PREFIT project. J. Sci. Med. Sport 22, 430–437. doi: 10.1016/j.jsams.2018.09.227 Cadenas-Sanchez, C., Martinez-Tellez, B., Sanchez-Delgado, G., Mora-Gonzalez, J., Castro-Piñero, J., Löf, M., et al. (2016a). Assessing physical fitness in preschool children: feasibility, reliability and practical recommendations for the PREFIT battery. J. Sci. Med. Sport 19, 910–915. doi: 10.1016/j.jsams.2016. 02.003 Cadenas-Sanchez, C., Nyström, C., Sanchez-Delgado, G., Martinez-Tellez, B., Mora-Gonzalez, J., Risinger, A. S., et al. (2016b). Prevalence of overweight/obesity and fitness level in preschool children from the north compared with the south of Europe: an exploration with two countries. Pediatr. Obes. 11, 403–410. doi: 10.1111/ijpo.12079 Cole, T. J., and Lobstein, T. (2012). Extended international (IOTF) body mass index cut-offs for thinness, overweight and obesity. Pediatr. Obes. 7, 284–294. doi: 10.1111/j.2047-6310.2012.Y00064.x de Onis, M., Onyango, A. W., Borghi, E., Siyam, A., Nishida, C., and Siekmann, J. (2007). Development of a WHO growth reference for school-aged children and adolescents. Bull. World Health Organ. 85, 660–667. doi: 10.2471/blt.07.043497 Emaus, A., Degerstrøm, J., Wilsgaard, T., Hansen, B. H., Dieli-Conwright, C. M., Furberg, A.-S., et al. (2010). Does a variation in self-reported physical activity reflect variation in objectively measured physical activity, resting heart rate, and physical fitness? Results from the Tromsø study. Scand. J. Public Health 38, 105–118. doi: 10.1177/1403494810378919. resources or even in school settings where objective methods cannot be applied.. DATA AVAILABILITY The datasets generated for this study are available on request to the corresponding author.. ETHICS STATEMENT The study protocol was performed in accordance with the ethical standards and was approved by the Review Committee for Research Involving Human Subjects at the University of Granada (number 845).. AUTHOR CONTRIBUTIONS. Aadahl, M., Kjaer, M., Kristensen, J. H., Mollerup, B., and Jørgensen, T. (2007). Selfreported physical activity compared with maximal oxygen uptake in adults. Eur. J. Cardiovasc. Prev. Rehabil. 14, 422–428. doi: 10.1097/HJR.0b013e3280128d00 Abarca-Gómez, L., Abdeen, Z. A., Hamid, Z. A., Abu-Rmeileh, N. M., AcostaCazares, B., Acuin, C., et al. (2017). Worldwide trends in body-mass index, underweight, overweight, and obesity from 1975 to 2016: a pooled analysis of 2416 population-based measurement studies in 128·9 million children, adolescents, and adults. Lancet 390, 2627–2642. doi: 10.1016/S0140-6736(17) 32129-3 Artero, E. G., España-Romero, V., Ortega, F. B., Jiménez-Pavón, D., Ruiz, J. R., Vicente-Rodríguez, G., et al. (2010). Health-related fitness in adolescents: underweight, and not only overweight, as an influencing factor. The AVENA study. Scand. J. Med. Sci. Sport. 20, 418–427. doi: 10.1111/j.1600-0838.2009. 00959.x Cadenas-Sánchez, C., Alcántara-Moral, F., Sánchez-Delgado, G., Mora-González, J., Martínez-Téllez, B., Herrador-Colmenero, M., et al. (2014). Assessment of cardiorespiratory fitness in preschool children: adaptation of the 20 metres shuttle run test. Nutr. Hosp. 30, 1333–1343. doi: 10.3305/nh.2014.30.6.7859 Cadenas-Sánchez, C., Intemann, T., Labayen, I., Artero, E. G., Alvarez-Bueno, C., Sanchis-Moysi, J., et al. (2019a). Prevalence of severe/morbid obesity and other weight status and anthropometric reference standards in Spanish preschool children: the PREFIT project. Pediatr. Res. doi: 10.1038/s41390-019-0325-8 [Epub ahead of print].. Frontiers in Psychology | www.frontiersin.org. 8. July 2019 | Volume 10 | Article 1585.
(9) Palou et al.. PA Estimates Fitness and Body Composition. report. Am. J. Public Health 78, 708–710. doi: 10.2105/ajph.78. 6.708 Oliver, M., Schofield, G. M., and Kolt, G. S. (2007). Physical activity in preschoolers: understanding prevalence and measurement issues. Sport Med. 37, 1045–1070. doi: 10.2165/00007256-200737120-00004 Ortega, F. B., Artero, E. G., Ruiz, J. R., Vicente Rodriguez, G., Bergman, P., Hagströmer, M., et al. (2008a). Reliability of health-related physical fitness tests in European adolescents. The HELENA Study. Int. J. Obes. 32, 49–57. doi: 10.1038/ijo.2008.183 Ortega, F. B., Cadenas-Sanchez, C., Lee, D., Ruiz, J., Blair, S., and Sui, X. (2018). Fitness and fatness as health markers through the lifespan: an overview of current knowledge. Prog. Prev. Med. 3:e0013. doi: 10.1097/pp9. 0000000000000013 Ortega, F. B., Cadenas-Sánchez, C., Sánchez-Delgado, G., Mora-González, J., Martínez-Téllez, B., Artero, E. G., et al. (2015). Systematic review and proposal of a field-based physical fitness-test battery in preschool children: the PREFIT battery. Sport Med. 45, 533–555. doi: 10.1007/s40279-0140281-8 Ortega, F. B., Labayen, I., Ruiz, J. R., Kurvinen, E., Loit, H.-M., Harro, J., et al. (2011). Improvements in fitness reduce the risk of becoming overweight across puberty. Med. Sci. Sports Exerc. 43, 1891–1897. doi: 10.1249/MSS. 0b013e3182190d71 Ortega, F. B., Ruiz, J. R., Castillo, M. J., and Sjöström, M. (2008b). Physical fitness in childhood and adolescence: a powerful marker of health. Int. J. Obes. 32, 1–11. doi: 10.1038/sj.ijo.0803774 Pate, R. R., O’Neill, J. R., and Mitchell, J. (2010). Measurement of physical activity in preschool children. Med. Sci. Sports Exerc. 42, 508–512. doi: 10.1249/MSS. 0b013e3181cea116 Ruiz, J., Castro-Piñero, J., Artero, E. G., Ortega, F. B., Sjöström, M., Suni, J., et al. (2009). Predictive validity of health-related fitness in youth: a systematic review. Br. J. Sports Med. 43, 909–923. doi: 10.1136/bjsm.2008.05 6499 Sanchez-Delgado, G., Cadenas-Sanchez, C., Mora-Gonzalez, J., Martinez-Tellez, B., Chillón, P., Löf, M., et al. (2015). Assessment of handgrip strength in preschool children aged 3 to 5 years. J. Hand Surg. 40, 966–972. doi: 10.1177/ 1753193415592328 Smith, J. J., Eather, N., Weaver, R. G., Riley, N., Beets, M. W., and Lubans, D. R. (2019). Behavioral correlates of muscular fitness in children and adolescents: a systematic review. Sport Med. 49, 887–904. doi: 10.1007/s40279-019-01089-7 Umer, A., Kelley, G. A., Cottrell, L. E., Giacobbi, P., Innes, K. E., and Lilly, C. L. (2017). Childhood obesity and adult cardiovascular disease risk factors: a systematic review with meta-analysis. BMC Public Health 17:683. doi: 10.1186/ s12889-017-4691-z World Health Organization (2016). Global Strategy on Diet, Physical Activity and Health. Available at: https://www.who.int/dietphysicalactivity/childhood/ en/ (accessed April 3, 2019).. España-Romero, V., Ortega, F. B., Vicente-Rodríguez, G., Artero, E. G., and Ruiz, J. R. (2010). Elbow position affects handgrip strength in adolescents: validity and reliability of JAMAR, DYNEx, and TKK dynamometers. J. Strength Cond. Res. 24, 272–277. doi: 10.1519/JSC.0b013e3181b296a5 Fang, H., Quan, M., Zhou, T., Sun, S., Zhang, J., Zhang, H., et al. (2017). Relationship between physical activity and physical fitness in preschool children: a cross-sectional study. Biomed. Res. Int. 2017, 1–8. doi: 10.1155/2017/ 9314026 Geserick, M., Vogel, M., Gausche, R., Lipek, T., Spielau, U., Keller, E., et al. (2018). Acceleration of BMI in early childhood and risk of sustained obesity. N. Engl. J. Med. 379, 1303–1312. doi: 10.1056/NEJMoa1803527 Ho, H. C. H., Maddaloni, E., and Buzzetti, R. (2019). Risk factors and predictive biomarkers of early cardiovascular disease in obese youth. Diabetes. Metab. Res. Rev. 35:e3134. doi: 10.1002/dmrr.3134 Jiménez-Pavón, D., Fernández-Alvira, J. M., te Velde, S. J., Brug, J., Bere, E., Jan, N., et al. (2012). Associations of parental education and parental physical activity (PA) with children’s PA: the ENERGY cross-sectional study. Prev. Med. 55, 310–314. doi: 10.1016/j.ypmed.2012.07.011 Jiménez-Pavón, D., Konstabel, K., Bergman, P., Ahrens, W., Pohlabeln, H., Hadjigeorgiou, C., et al. (2013). Physical activity and clustered cardiovascular disease risk factors in young children: a cross-sectional study (the IDEFICS study). BMC Med. 11:172. doi: 10.1186/1741-7015-11-172 Jones, R. E., Jewell, J., Saksena, R., Ramos Salas, X., and Breda, J. (2017). Overweight and obesity in children under 5 years: surveillance opportunities and challenges for the WHO European Region. Front. Public Health 5:58. doi: 10.3389/fpubh. 2017.00058 Labayen, G. I., Arenaza, L., Medrano, M., García, N., Cadenas-Sanchez, C., and Ortega, F. B. (2018). Associations between the adherence to the Mediterranean diet and cardiorespiratory fitness with total and central obesity in preschool children: the PREFIT project. Eur. J. Nutr. 57, 2975–2983. doi: 10.1007/s00394017-1571-3 Leblanc, A., Pescatello, L. S., Taylor, B. A., Capizzi, J. A., Clarkson, P. M., Michael White, C., et al. (2015). Relationships between physical activity and muscular strength among healthy adults across the lifespan. Springerplus 4:557. doi: 10. 1186/s40064-015-1357-0 Leppänen, M. H., Henriksson, P., Delisle Nyström, C., Henriksson, H., Ortega, F. B., Pomeroy, J., et al. (2017). Longitudinal physical activity, body composition, and physical fitness in preschoolers. Med. Sci. Sport Exerc. 49, 2078–2085. doi: 10.1249/MSS.0000000000001313 Leppänen, M. H., Nyström, C. D., Henriksson, P., Pomeroy, J., Ruiz, J. R., Ortega, F. B., et al. (2016). Physical activity intensity, sedentary behavior, body composition and physical fitness in 4-year-old children: results from the ministop trial. Int. J. Obes. 40, 1126–1133. doi: 10.1038/ijo.2016.54 Merino-De Haro, I., Mora-Gonzalez, J., Cadenas-Sanchez, C., Borras, P. A., Benito, P. J., Chiva-Bartoll, O., et al. (2018). Higher socioeconomic status is related to healthier levels of fatness and fitness already at 3 to 5 years of age: the PREFIT project. J. Sports Sci. 37, 1327–1337. doi: 10.1080/02640414.2018.1558509 Migueles, J. H., Cadenas-Sanchez, C., Ekelund, U., Delisle Nyström, C., MoraGonzalez, J., Löf, M., et al. (2017). Accelerometer data collection and processing criteria to assess physical activity and other outcomes: a systematic review and practical considerations. Sport Med. 47, 1821–1845. doi: 10.1007/s40279-0170716-0 Minder, C. M., Shaya, G. E., Michos, E. D., Keenan, T. E., Blumenthal, R. S., Nasir, K., et al. (2014). Relation between self-reported physical activity level, fitness, and cardiometabolic risk. Am. J. Cardiol. 113, 637–643. doi: 10.1016/j.amjcard. 2013.11.010 Mora-Gonzalez, J., Cadenas-Sanchez, C., Martinez-Tellez, B., Sanchez-Delgado, G., Ruiz, J. R., Léger, L., et al. (2017). Estimating VO2max in children aged 5–6 years through the preschool-adapted 20-m shuttle-run test (PREFIT). Eur. J. Appl. Physiol. 117, 2295–2307. doi: 10.1007/s00421-017-3717-7 Murphy, J. K., Alpert, B. S., Christman, J. V., and Willey, E. S. (1988). Physical fitness in children: a survey method based on parental. Frontiers in Psychology | www.frontiersin.org. Conflict of Interest Statement: The authors declare that the research was conducted in the absence of any commercial or financial relationships that could be construed as a potential conflict of interest. The handling Editor is currently editing co-organizing a Research Topic with two of the authors, AM-M and PP, and confirms the absence of any other collaboration. Copyright © 2019 Palou, Muntaner-Mas, Cantallops, Borràs, Labayen, JiménezPavón, Dorado García, Moliner-Urdiales, Rodríguez Pérez, Rojo-Tirado, CadenasSanchez, Ortega and Vidal-Conti. This is an open-access article distributed under the terms of the Creative Commons Attribution License (CC BY). The use, distribution or reproduction in other forums is permitted, provided the original author(s) and the copyright owner(s) are credited and that the original publication in this journal is cited, in accordance with accepted academic practice. No use, distribution or reproduction is permitted which does not comply with these terms.. 9. July 2019 | Volume 10 | Article 1585.
(10)
Figure
Documento similar