An experimental study of the flow induced by the motion of a hinged door separating two rooms
11
0
0
Texto completo
(2) Building and Environment 131 (2018) 220–230. I.G. Papakonstantis et al.. similarity. From visual observations it was concluded that hinged doors allow more fluid to be exchanged than sliding doors, and that the motion of a hinged door is more important for the exchange than the motion of a manikin. These observations were validated using experiments conducted in a full scale model by Kalliomäki et al. [9,10]. Also within the context of rotating-hinged doors, Eames et al. [11] observed that the flow mechanism associated with the hinged door was mainly linked to the formation of a dipolar vortex shed from the tip of the door, which is followed by a near-wall high speed jet generated by the door closure. Kiel and Wilson [12] presented measurement results, along with theoretical analysis of the fluid volume that is exchanged through an external doorway. Measurements with a tracer gas were conducted in a full-scale room. Additionally, a 1:20 laboratory model using water as the fluid was studied. As density differences across the door were considered, the whole study was based on densimetric Froude number similarity between full scale and laboratory models. At zero density difference, a typical value of the exchange volume was found to be 0.50Vd, where Vd is the volume swept by the door for an opening of 90° (Vd = HπW2/4, H being the door height and W the door width). From the results obtained, Kiel and Wilson [12] concluded that the exchanged volume is almost constant with hold open time, which is the time a door is held open at an angle of 90°. They also observed that the exchanged volume increased linearly with the door speed for a laminar flow and independently from the speed for fully turbulent flow conditions. Eames et al. [11] tested various opening angles of the door and determined the exchange volume from concentration measurements for an internal door opening into an isolation room ventilated at 12 ac/h. They found that the fluid volume exchanged varies from about 1.5% to 5% of their room volume and the volume exchanged is comparable to the volume swept by the door. Kalliomäki et al. [7] conducted full scale measurements with no pressure differential using two gases as tracers for a range of angular door speeds and hold open times, between 10 and 30 deg/s and 2–25 s respectively. In contrast to [12] the results showed that the exchanged volume increases with hold open time and it does not vary with door speed for a certain hold open time. The contribution of a manikin's motion to the fluid volume exchange was found to be minor compared to that of the door motion, in accordance to the qualitative observations made by Tang et al. [8]. The experiments of Fontana and Quintino [13] showed a small decrease of the exchanged mass as the total time of door motion increases. This was found using a scaled model of a clean room operating under positive pressure. Hathway et al. [14,15] presented the results of flow visualisations and a quantification of the fluid volume exchanged between the two rooms, indicating an increase in the volume of fluid exchanged with door hold open time. Considering the conflicted observations on the influence of the door speed and the time the door is held open, there is still a need to characterize the airflow exchange across doorways. Further, an improved understanding of the velocity field during door motion is valuable to predict the potential for ‘draughts’ that may interact with ventilation design. Velocity fields have been measured experimentally in model rooms using both Laser Doppler Velocimetry (LDV) and Particle Image Velocimetry (PIV) [16]. PIV measurements have also been carried out at model scale for the indoor environment in an airliner cabin [17]. Further information about the use of PIV in studying the indoor environment can be found in Cao et al. [18]. In order to track three-dimensional (3D) flow patterns, Particle Tracking Velocimetry (PTV) has been applied to indoor spaces [19]. However, even though results from 3D velocity measurements reported by Hathway and Papakonstantis [20] are available, there is a lack of published information related to the velocity fields generated by the motion of a rotating door. In this study, experiments were conducted in a scale model for the exchange flow caused by the motion of a hinged door. The volume of fluid exchanged is determined through concentration measurements and the effects of door speed and hold open time on the exchange. Fig. 1. Plan view of the problem under consideration.. volume are assessed, clarifying discrepancies between previous studies [7,12]. Flow visualisations and 3D velocity measurements were also carried out to increase our understanding of such flows. 2. Theoretical considerations 2.1. The problem under consideration The problem under consideration is shown in Fig. 1. Two rooms are separated by means of a wall and a hinged door of height H and width W. The door follows a rotating motion and it opens to an angle of 90° in a time top. The door is held fully open for a time th (hold open time) and then it closes in a time tcl. During the door motion a fluid mass mx or a fluid volume Vx is exchanged between the rooms. The developed flow field and the exchange volume Vx are determined from experiments conducted in a 1:10 scale model representing two rooms, each of them being 4.5 m long, 7.0 m wide, 2.0 m high (full scale dimensions). The door in the model is full height enabling the flow around the vertical axis of the door to be studied without the variations created by different height gaps above the door frame. 2.2. Scale modelling Scale models are widely used for studying indoor airflows because they are practical, less expensive than full scale constructions and can provide accurate results [21]. Following previous studies [8,12,21] water was used as the working fluid instead of air. In this study no buoyancy effects are considered, therefore the modelling is based on Reynolds number matching between model and full scale [8]. For a flow caused only by door motion the Reynolds number can be estimated as. Re =. Ud W ν. (1). where Ud is the average door velocity, W is the door width and ν is the kinematic viscosity of the fluid. Following [12] the average door velocity (velocity of the door centre) can be estimated as Ud = πW/(4top), if the time top required for the door opening is known. The Reynolds number matching, between the model (where the working fluid is water) and the full scale (where the fluid is air), implies. Ref = Rem ⇒. Wf2 t f νa. =. Wm2 W2 ν t ⇒ m = m2 a tm νw tf Wf νw. (2). where t is time, ν is the kinematic viscosity of the fluid and the subscripts f, m, w and a stand for full-scale, model, water and air respectively. For a viscosity ratio νa/νw = 15.05 (20 °C) and a length ratio Wm/ Wf = 1/10, Eq. (2) leads to. tf tm. = 6.64 ⇒. ωm = 6.64 ωf. where ω is the angular door velocity (ω = π/2top). 221. (3).
(3) Building and Environment 131 (2018) 220–230. I.G. Papakonstantis et al.. Fig. 2. Schematic representation of the experimental setup used for flow visualisations and concentration measurements.. 3. Experiments. exchanged through the doorway, and the third series included 3D PTV measurements in a fluid volume of size 140 × 140 × 100 mm3 near the doorway. The experimental setup used for the first two sets of experiments is shown in Fig. 2, while the setup employed for the velocity measurements is shown in Fig. 3 (see Section 3.3).. 3.1. Experimental apparatus. 3.2. Visualisations of exchange flow. A 1:10 scale model was constructed at the University of Sheffield. The model consisted of a tank 0.90 m long, 0.70 m wide and 0.20 m high constructed from Plexiglas. The bottom of the tank was horizontal with two holes for supplying and draining water. The tank was divided into two equal parts by means of a dividing wall having in the middle an opening 0.20 m high and 0.09 m wide. A hinged door was placed in the opening which could rotate around a vertical steel axis. The door was almost full-height to simplify the exchange flow field by reducing the flow over the top of the door and allowing an exchange mostly along the vertical. The tank was covered by means of a Plexiglas lid bolted on the vertical sides of the tank. Four circular openings of 0.05 m diameter were made on the lid (two in each room) to allow dye injection, stirring the mixture, and the positioning of the concentration sensors. During the door motion, the openings were sealed with cylindrical lids, resulting in a smooth ceiling in the tank. The door speed and hold open times, were controlled by an automated actuator which was operated by a program developed in Labview® software. In all tests the opening angle was approximately 90°. The door motion was reproducible and it was constantly monitored. The door moved at a constant speed after the initial 60 ms, and begins to slow approximately 15 ms before stopping. The time for the door opening was varied from 0.4 s to 1 s, while the hold open time was varied from 0 to 8 s (experimental values). The time required for the door closure was approximately equal to the door opening time. Three different types of experiment were conducted. The first series included visualisations of the exchange flow, the second included concentration measurements aimed at determining the fluid volume. The flow was visualised by colouring the water in one room with food dye and observing the transport of dye into the adjacent room. Initially the tank was filled with tap water, air bubbles formed during filling were removed using a syringe connected to a catheter located at the round openings. Dye was added to one room and the mixture was sufficiently stirred and left to rest before each experiment. The tank was illuminated by means of two LED floodlights. A digital camcorder (Panasonic HC-V720) was placed beneath the tank (Fig. 2) at a distance 0.85 m from the bottom and a second camcorder (Panasonic HC-V210) was placed to face the long side of the tank at a distance approximately 1.20 m (not shown in Fig. 2). Both cameras provided a video with a resolution of 1920 × 1080 pixels at a rate of 50 fps. For a certain door speed and a hold open time, two successive experimental runs were performed to visualise the mass exchange. Experiments were conducted for door speeds varying from 19 deg/s to 36 deg/s and hold open times varying between 0 and 27 s (values converted to full-scale).. Eq. (3) implies that 1 s in the full scale should be approximately 0.15 s in the model and the angular door speed in the model should be 6.64 times higher than that in the full scale.. 3.3. Velocity flow field To determine the 3D velocity field developed by the door motion, measurements were carried out by means of a volumetric 3-component velocimetry (V3V) system provided by TSI® which has been used in several studies for conducting velocity measurements [22–24]. The V3V technique is based on the defocusing technique [25,26]. Images of tracer particles and their 3D positions were obtained by means of a volumetric camera, which is composed by three independent cameras. 222.
(4) Building and Environment 131 (2018) 220–230. I.G. Papakonstantis et al.. Fig. 3. Schematic of the experimental setup used for conducting velocity measurements.. arranged in an equilateral triangle shape. A 532 nm, double pulsed, Nd:YAG laser with power of 200 mJ was used to illuminate the particles. The laser light was positioned by means of a guiding arm located beneath the tank. A conical laser volume was created using two cylindrical lenses, and it was positioned in the doorway region, within Room 2. The volumetric camera was placed 0.67 m from the measurement volume. The intersection between the camera field of view and the laser beam defined a measurement volume of 140 × 140 × 100 mm3. The apparatus was fully enclosed to control the illumination and to fulfil local laser regulations. Schematic of the experimental setup is shown in Fig. 3. The flow was seeded with Polyamide 12 particles with a mean diameter of 90 μm and a density of 1.016 g/cm3. The camera was synchronized with the pulsed laser and double frame images were captured using a time separation of 5000 μs. The synchronization device was externally triggered to start just before the initiation of the door motion. Image sets were captured at a rate of 7.25 Hz. The door motion at model scale lasted 1.5 s in total (0.5 s was the time for the door opening, 0.5 s was the hold open time, and 0.5 s the time for the door closure in the experiment). At full scale this would equate to a total door motion time of 9.96s. Ten different pairs of frames were captured before the initiation of the door motion to characterise the full range of motion. After this, 50 pairs of frames were captured to determine the velocity field during the door motion and after the door had shut. 3D PTV was carried out to identify the velocity of the particles as they were displaced by the door motion. The Insight V3V® software was used for the analysis. The software implements the relaxation method algorithm, where a deformation tolerance of 1.0 mm and coefficients a and b were set to 0.3 and 3 respectively [27]. The outliers were filtered using a 3D implementation of the filtering technique with a threshold of 0.4 m/s (faster than the speed of the door tip) [28]. In this work a sequence of instantaneous velocity vectors are presented to provide further clarification to the results shown by the dye experiments. Results for velocity measurements surrounding the door for three separate experiments are shown.. Table 1 Experimental parameters for concentration measurements. (Full scale values.) ω [deg/s]. top [s]. th [s]. Ud [m/s]. Re. Experiments. 19.35 27.09 13–31. 4.65 3.32 2.66–6.64. 0–27 0–54 1.99. 0.14 0.20 0.10–0.25. 8074 11304 5652–12845. 10 27 14. 3.4. Fluid volume exchange Concentration measurements were conducted using the tracer Rhodamine WT to determine the mass, mx, or the volume of fluid Vx, exchanged between the two rooms (mx = ρVx, ρ being the water density). As the chlorine existing in the tap water reacts with Rhodamine WT, the water of the tank was left for a couple of days to promote chlorine decay. Moreover, a small amount of Anhydrous sodium sulphite (Na2SO3) was used for dechlorination. Measurements of Rhodamine concentration were carried out with a Cyclops fluorometer (Turner Designs®). This instrument was linked with an analogue to digital converter USB-1208LS by Computing Measurement®. For the data acquisition the TracerDAQ® software was used. The fluorometer was calibrated daily and a linear relation between measured voltage and concentration was always obtained. The sensor was submerged in the tank through the openings existing on the lid (Fig. 2) prior to, and after, the door motion. Reflections were avoided by covering the bottom of the tank with a black plastic membrane. Rhodamine WT was injected in both rooms and the fluid volumes were stirred to obtain a uniform concentration. A concentration around 300 ppm was created in Room 1 (see Fig. 1), and a background concentration of 20–50 ppm in Room 2. The sensor sampled the fluid for 60 s at a rate of 10 Hz. From 600 concentration values an average concentration was calculated. The door motion was recorded by a camcorder to monitor the opening. 223.
(5) Building and Environment 131 (2018) 220–230. I.G. Papakonstantis et al.. angle, the opening and closure times, and the hold open time. After the door motion has been completed and the door shut, the mixtures of both rooms were stirred sufficiently in order to obtain a spatially averaged concentration. After this, the concentration in each room was measured again. The fluid volume Vx which is exchanged between rooms 1 and 2 (Fig. 1) can be obtained from the conservation of Rhodamine mass written for each room as:. Room 1: Co1 Vr − Co1 Vx + Co2 Vx = C1 Vr ⇒ Vx =. Co1 − C1 Vr Co1 − Co2. (4a). Room 2: Co2 Vr − Co2 Vx + Co1 Vx = C2 Vr ⇒ Vx =. C2 − Co2 Vr Co1 − Co2. (4b). where Co1 and Co2 are the concentrations in rooms 1 and 2 before the door opening, C1 and C2 are the concentrations in rooms 1 and 2 after the door motion, Vr is the volume of each room and Vx is the fluid volume exchanged. The exchanged volume can be obtained from either Eq. (4a) or Eq. (4b). In total, 51 experiments were carried out to investigate the effect of the hold open time and the door speed on the exchange volume. More specifically, experiments were conducted for two different full scale equivalent door speeds ω = 27.09 deg/s and ω = 19.35 deg/s, for various hold open times. Further, for a full scale equivalent hold open time of th = 1.99 s experiments were conducted for various door speeds. In all the experiments, the Reynolds number estimated by Eq. (1), was sufficiently high (between 5500 and 13000) to ensure turbulent flow near the door region. The number of experiments and the experimental parameters are summarised in Table 1. 4. Results and discussion 4.1. Visualisations of the exchange flow The time evolution of the exchange flow induced by the door motion is presented in Figs. 4 and 5, for an angular door speed of 27.09 deg/s and a hold open time 1.99 s. The full video is available online [29]. All results shown in section 4 have been converted to full scale using Reynolds number similarity described above. Fig. 4 presents a view from beneath the tank, while Fig. 5 shows the sideview as recorded by the second camcorder. In both figures, the left column shows the mass flux from Room 1 to Room 2, while the second column shows the mass flux from Room 2 to Room 1. Similar visualisations were obtained for a range of door speeds and hold open times. Both, the bottom view (Fig. 4) and the side view (Fig. 5), show that the flow pattern in Room 2 is different than that observed in Room 1. The door opening allows a rotating cloud of coloured water to enter the Room 2 (Fig. 4a). The formation of a vortex due to the door opening was also observed in earlier studies [6,11]. The two views indicate (Figs. 4a and 5a) that the rotating cloud is initially cylindrical, and appears almost axisymmetric but in the next images (Figs. 4 and 5b, c, d) becomes three-dimensional. As the door is held open at 90° the cloud spreads further from the door tip (Fig. 4b). The door closure leads to the formation of a large scale vortex (Fig. 4c) which rotates opposite to the direction of the door motion. The vortex propagates along the vertical walls, grows and occupies most of the available space (Fig. 4d, e, 4f). The mass transport in Room 1 is characterised by a cloud of coloured water spreading from the door opening both longitudinally and transversely. The cloud of water appears to grow in both directions approximately equally, unlike in Room 2. After reaching the opposite wall the cloud continues growing transversely and vertically. In Fig. 4f it is seen that at a time of about four minutes after the initiation of the door. Fig. 4. Time evolution of the exchange flow induced by the door motion (bottom view) for door speed 27.09 deg/s and hold open time 1.99 s. The left column shows the mass flux from Room 1 to Room 2, while the right column shows the mass flux from Room 2 to Room 1. The frames shown are (a) 2.52 s, (b) 5.18 s, (c) 7.17 s, (d) 14.48 s, (e) 55.64 s, (f) 234.92 s after the initiation of the door motion. (All values full scale).. motion, there is still a region in both rooms which has not been coloured, indicating that the complete mixing in the room needs more time.. 224.
(6) Building and Environment 131 (2018) 220–230. I.G. Papakonstantis et al.. Fig. 5. Time evolution of the exchange flow induced by the door motion (sideview) for door speed 27.09 deg/s and hold open time 1.99 s. The left column shows the mass flux from Room 1 to Room 2, while the right column shows the mass flux from Room 2 to Room 1. The frames shown are (a) 2.52 s, (b) 5.18 s, (c) 7.17 s, (d) 14.48 s, (e) 55.64 s, (f) 234.92 s after the initiation of the door motion. (All values full scale).. 4.2. Velocity flow field. Fig. 7 shows the change in average velocity in the measurement region surrounding the door motion against time for three separate experiments. Two peaks in velocity are shown, towards the end of the motion during opening and again during the period the door is closing. The median velocity across the measurement zone peaks at 0.22 m/s (full scale value) as the door is closing. At this time higher particle velocities are found of the order of 0.4 m/s (full scale value) in some areas, this is a similar order of magnitude to the door tip speed which would be 0.42 m/s. Although these values are small and unlikely to interact with specified extraction systems, which usually have inlet velocities in the region of 2–10 m/s [18], they may have the potential to interact with low speed ventilation devices such as personalised ventilation (with typical inlet velocities of 0.2–0.6 m/s) or displacement ventilation inlets (0.15–0.5 m/s) [18,30] if these are located near doorways.. Fig. 6 shows indicative images of the instantaneous velocity fields generated from the door motion in the zone surrounding the region the door moves through. The general flow patterns and the directionality changes of the flow field are also highlighted in the figure. The movement begins with a stationary volume in Room 2. As shown in Fig. 6a at the initial stages, the volume immediately behind the door is displaced away from the door. Then due to the low pressure region formed behind the door, a large scale vortex is formed (Fig. 6b). At full opening (Fig. 6c) a vortex-like structure is observed in the region of door motion. As the door starts closing, the direction of the flow is inverted (Fig. 6d). A large scale flow is now formed behind the door (Fig. 6f). Finally, the flow continues to rotate and the macro structure starts disappearing from the region. The experimental data is available to download [29].. 225.
(7) Building and Environment 131 (2018) 220–230. I.G. Papakonstantis et al.. Fig. 6. Velocity vector field with a downwards view onto the door opening at (a) 0.9 s, (b) 2.8 s, (c) 4.6 s (d) 8.3 s, (e) 9.3 s after the initiation of door motion. Approximate door position within Room 2 is indicated by the grey shading. (All values full scale.). 4.3. Fluid volume exchange Following Kiel and Wilson [12] the volume of fluid exchanged can be normalised by the volume Vd swept by the door motion, estimated as. Vd =. πW 2 H 4. (5). where W is the door width and H is the door height. In our scale model W = 0.085 m (measured from the rotating vertical axis) and H = 0.20 m, resulting in an equivalent full scale volume Vd = 1.135 m3. The normalised exchange volumes obtained for two different door speeds and for various hold open times are plotted against hold open time in Fig. 8. The exchange volumes obtained from Eq. (4a) are shown in Fig. 8a, while the exchange volumes obtained from Eq. (4b) are shown in Fig. 8b. Results are only shown for angular door speeds ω = 27.09 deg/s and ω = 19.35 deg/s and varying hold open times. The results from the experiments with hold open time of 1.99 s and varying door speeds are shown in Fig. 10. Fig. 8 demonstrates that, although there are some deviations between the volumes obtained from equations (4a) and (4b), the results are generally in satisfactory. Fig. 7. Box-whisker plot of velocity magnitude as the door moves for 3 separate experiments. The median, upper and lower quartile and the 10th and 90th percentile are shown. (All values full scale).. 226.
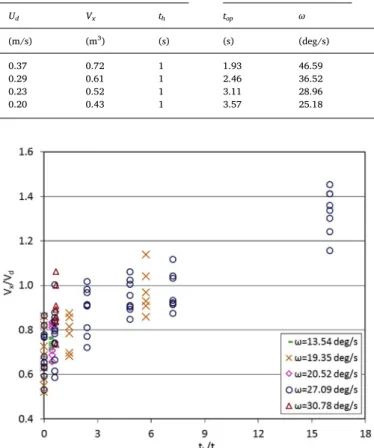
(8) Building and Environment 131 (2018) 220–230. I.G. Papakonstantis et al.. Fig. 8. Normalised exchange volume obtained from (a) Eq. (4a) and (b) Eq. (4b), for two different door speeds and for various hold open times (All values full scale).. Fig. 10. Normalised exchange volume against angular door speed for a certain hold open time (th = 1.99 s for present study, 2.0 s for [7], and 1.0 s for [12]). (a) All data and (b) average data. * Results adapted using Reynolds number similarity (see Table 2). (All values full scale.). reported by Kiel and Wilson [12] have been plotted in the same graph. Kiel and Wilson's results have been obtained from full scale measurements for an opening time 3.7 s, corresponding to an angular door speed ω ≈ 24 deg/s, and have been normalised by the swept volume Vd = 1.28 m3 reported in their study. Also, the data of Kalliomäki et al. [7] normalised by the volume Vd (estimated equal to 2.076 m3) have been plotted in Fig. 9. Kalliomäki et al. [7] reported full scale measurements for the fluid volume transferred in both directions (i.e. results are presented from Room 1 to Room 2 and vice versa) for a door speed ω = 30 deg/s, which have all been plotted in Fig. 9a. It is noted that in contrast to the current study, Kalliomäki et al. [7] and Kiel and Wilson [12] used a door height that was lower than the room height. The exchange volumes reported by Kiel and Wilson [12] are lower than the ones measured in this study. However, the comparison shows a. Fig. 9. Normalised exchange volume against hold open time. (a) All data, (b) averages for each hold open time. (All values full scale).. agreement. In the following both the volumes obtained from equations (4a) and (4b) are used as they provide a sense of the measurement uncertainty. To investigate the effect of hold open time on the volume of fluid exchanged, all the data shown in Fig. 8 (a) and (b) is plotted against hold open time in Fig. 9a with the average results given in Fig. 9b. The two figures are provided to show the trends in the average data as well as the variation between experiments since the standard error for each set of measurements was found to be generally small (0.026–0.044). For comparison, selected data (for very low temperature differences) 227.
(9) Building and Environment 131 (2018) 220–230. I.G. Papakonstantis et al.. Table 2 Data obtained by Kiel and Wilson [12] in a 1:20 scale model. Data reported in Ref. [12]. Calculated parameters. Full scale values obtained from Reynolds number similarity. Ud. Vx. th. top. ω. top. th. ω. Ud. (m/s). (m3). (s). (s). (deg/s). (s). (s). (deg/s). (m/s). 0.37 0.29 0.23 0.20. 0.72 0.61 0.52 0.43. 1 1 1 1. 1.93 2.46 3.11 3.57. 46.59 36.52 28.96 25.18. 13.61 17.37 21.90 25.18. 7.05 7.05 7.05 7.05. 6.61 5.18 4.11 3.57. 0.053 0.041 0.033 0.028. Re. 3273 2565 2034 1769. exchanged fluid is proportional to the speed of the door motion, and not dependent on hold open time. However, the findings of Kalliomäki et al. [7] are contrary to this. A possible reason for these different conclusions is that Kiel and Wilson scaled their results based on densimetric Froude number similarity as the majority of the study was investigating buoyant flows. However, for zero temperature difference (zero buoyancy), Reynolds number similarity should be valid. To investigate the discrepancy between the relative importance of door speed and hold open time Fig. 10 compares the results from the current study, including all data obtained from both Eqs. (4a) and (4b), to Kalliomäki et al. [7] for a full scale room, and to Kiel and Wilson [12]. The Kiel and Wilson data is scaled using Froude number, as presented in their paper, and also scaled using Reynolds number similarity (highlighted using the asterix in the key). In Table 2 a comparison between scaling Kiel and Wilson's data using Froude number similarity and Reynolds number similarity is shown. For instance, a linear door velocity Ud = 0.37 m / s corresponding to a door opening time top = πW /(4Ud ) = 1.93 s and an angular door speed ω = 46.59 deg / s , as well as a hold open time th = 1 s have been scaled up from the corresponding experimental parameters top = 1.93 s / 4.47 = 0.43 s , ω = 208.27 deg / s and th = 1/4.47 = 0.22 s . Using Reynolds number similarity the previous values can be scaled up as top = 0.43 × 31.5 = 13.61 s , ω = 6.61 deg / s and th = 7.05 s . It is worth noting that the results of Kiel and Wilson from a full scale house as shown in Fig. 9 were only provided for one door speed. The results of this study and the results of [7] were obtained for a hold open time of approximately 2 s, whereas in Ref. [12] a hold open time equal to 1 s is reported. The comparison shows that the results of the present study are in very good agreement with those reported by Kalliomäki et al. [7], whereas Kiel and Wilson [12] again reported lower exchange volumes (understandably since the door is open for a shorter period of time). Taking into consideration the scatter of the experimental data our average results (Fig. 10b) show that the exchange volume does not vary considerably with angular door speed in the range of 10–30 deg/s. Higher exchange volumes are found with door speeds above 27 deg/s, however it is difficult to draw conclusions from this as in these experiments this is combined with greater scatter in the experimental results. These results are in agreement with Kalliomäki et al. [7], whereas Kiel and Wilson [12] found that the exchanged volume increases with door speed. When using Reynolds number similarity to scale the values to full scale it is clear that Kiel and Wilson's results are for much lower door speeds than either the current work, or that presented by Kalliomäki et al. [7]. It is notable that Kiel and Wilson [12] presented a theoretical analysis showing that for laminar flow the exchanged volume increases with door speed Ud and consequently with ω (Ud is proportional to ω), whereas for a turbulent flow the exchanged volume does not depend on the door speed. These theoretical results may explain the different relationship between exchanged volume and door speed found in Kiel and Wilson [12], Kalliomäki et al. [7] and this study. To further investigate this point, the Reynolds numbers of Kiel and Wilson's experiments were estimated, as shown in Table 2. The Reynolds number was found to vary between 1700 and 3300, whereas in the present study the Reynolds number was much higher varying from 5500 to 13000 (Table 1).. Fig. 11. Normalised exchange volume against the ratio of hold open time to time for door opening.. good agreement between our results and the full scale data of Kalliomäki et al. [7] providing confidence in the normalisation applied and the use of our scale model in studying indoor airflows. Although there is scatter in our data (equation (4a) and (4b) are quite sensitive to small concentrations changes), it is seen that the exchanged volume increases with hold open time. Such a result seems reasonable, because both rooms will obtain the same concentration if the door is held open for a long enough period of time. For a hold open time of about 8 s, Kalliomäki et al. [10] reported a normalised exchange volume of 0.69 which is smaller than the average value 0.83 obtained from the data reported in Ref. [7] and the average value 0.89 found in the present study (Fig. 9b), but still comparable to the data shown in Fig. 9a. In Fig. 9b the average exchange volumes for each hold open time are shown. It is seen that the average normalised exchange volume varies from about 0.7 to about 1.3. A linear fitting of the normalised exchange volume with hold open time was obtained from all the data of the present study (shown in Fig. 9a and b). It is noted that a linear fitting of the average exchange volumes for ω = 19.35 deg/s would lead to a line which would be almost parallel to that obtained for ω = 27.09 deg/s, with an average deviation of less than 6%. Since the present results do not present any considerable differences for these two considered door, the linear fitting shown was obtained from the average exchange volumes of both door speeds. The effect of the door speed on the volume of exchanged fluid is investigated in Fig. 10, where the normalised exchange volume is plotted against the door speed, for a hold open time, th = 1.99 s. As with Fig. 9 two plots are presented to show the variance in the experimental data (Fig. 10a) and the average trends (Fig. 10b). Previously Kiel and Wilson [12] have found that the volume of 228.
(10) Building and Environment 131 (2018) 220–230. I.G. Papakonstantis et al.. volume swept by the door varies from about 0.7 to about 1.3. The exchanged volume increases linearly with hold open time. For door speeds in the range 10–31 deg/s there is little variation in fluid volume exchanged once you have accounted for the uncertainty in experimental results. However, previous studies have shown this relationship does not hold at lower door speeds. Further work is therefore required to observe whether these relationships hold over a wider range of door speeds and hold open times.. The agreement between the present results, obtained in a scale model, and the full scale measurements of Kalliomäki et al. [7], implies that the normalised exchange volumes Vx/Vd can be applicable for practical purposes. Of course, more results would be useful to support the validity of the normalisation Vx/Vd, particularly at very low door speeds. The choice of normalisation method will clearly affect the comparisons between experiments. For instance, normalisation of the exchange volumes by the volume Vr of the room where the door motion occurs as carried out by Eames et al. [11] leads obviously to values depending on the room size. Intuitively the swept volume of the door is a more appropriate approach to normalization, as it is quite conceivable that in large rooms the volume of the space is independent from the flow around the door when it is only held open for a few seconds. It is only in small rooms where walls near the opening may restrict the flow that the room size is likely to have an impact on exchange flow. Finally, Fig. 11 presents all the normalised experimental data for different hold open times and door speeds. The normalised fluid volume exchanged is plotted against the ratio of hold open time to the door opening time. It is clear there is a lot more scatter at the lower values of th/top which is due to increased scatter in experimental results at the higher door speeds. As th/top increases there is an increase in fluid volume exchanged between rooms.. Acknowledgments The main research of this paper was carried out when the first author was working at the University of Sheffield in the context of project ‘Quantifying the human induced ventilation of buildings’ which was funded by EPSRC (grant EP/K011669/1). The V3V system was provided on loan from the EPSRC Engineering Instrument Pool. The contribution of Mr Alex Cargill and Dr Paul Bentley (technical staff) on the preparation of the experimental setup is acknowledged. The assistance provided by Dr Adorkor Bruce-Konuah in some experiments is also appreciated. Many thanks to Panos Papanicolaou, Associate Professor at NTUA, for his willingness to provide useful information from his experimental experience to the first author.. 5. Conclusions Appendix A. Supplementary data The motion of a hinged door leads to mass exchange between two rooms. In the room into which the door opens the fluid enters as a rotating cloud which propagates around the walls of the room, enabling significant mixing in the space. The results obtained are valuable for increasing our understanding of indoor airflows and pollutant transport in order to improve the quality of the indoor environment. The data is particularly useful for understanding the air movement during indoor air quality studies (due to improved understanding of the amount of air transferred between rooms) and for validation purposes for CFD studies. Experiments were conducted to visualise the flow, measure the mass exchanged, and to investigate the velocity field in a scale model where two sealed rooms are separated by means of a hinged door. Based on the results obtained the following conclusions are drawn:. Supplementary data related to this article can be found at http://dx. doi.org/10.1016/j.buildenv.2017.12.026. References [1] Department of Health/Estates and Facilities Division, Health technical memorandum 03–01: specialised ventilation for healthcare premises, Part A - Design and validation (2007) 1–120. [2] L. Sehulster, R.Y.W. Chinn, Guidelines for environmental infection control in health-care facilities. Recommendations of CDC and the healthcare infection control practices advisory committee (HICPAC), MMWR Recomm. Rep. (Morb. Mortal. Wkly. Rep.) 52 (2003) 1–42 doi:DX. [3] J.I. Choi, J.R. Edwards, Large-eddy simulation of human-induced contaminant transport in room compartments, Indoor Air 22 (2012) 77–87, http://dx.doi.org/ 10.1111/j.1600-0668.2011.00741.x. [4] L. Chang, X. Zhang, S. Wang, J. Gao, Control room contaminant inleakage produced by door opening and closing: dynamic simulation and experiments, Build. Environ. 98 (2016) 11–20, http://dx.doi.org/10.1016/j.buildenv.2015.12.013. [5] D.J. Wilson, D.E. Kiel, Gravity driven counterflow through an open door in a sealed room, Build. Environ. 25 (1990) 379–388, http://dx.doi.org/10.1016/03601323(90)90012-G. [6] J.W. Tang, I. Eames, Y. Li, Y.A. Taha, P. Wilson, G. Bellingan, K.N. Ward, J. Breuer, Door-opening motion can potentially lead to a transient breakdown in negativepressure isolation conditions: the importance of vorticity and buoyancy airflows, J. Hosp. Infect. 61 (2005) 283–286, http://dx.doi.org/10.1016/j.jhin.2005.05.017. [7] P. Kalliomäki, H. Koskela, P. Saarinen, E. Sandberg, J.W. Tang, A.D. Nicolle, C.A. Klettner, K.W. Tham, Air leakage from hospital isolation room during passage through a hinged door, 10th Int. Conf. Ind. Vent. Paris, Fr. 17–19 Sept. 2012. [8] J.W. Tang, A. Nicolle, J. Pantelic, C.A. Klettner, R. Su, P. Kalliomaki, P. Saarinen, H. Koskela, K. Reijula, P. Mustakallio, D.K.W. Cheong, C. Sekhar, K.W. Tham, Different types of door-opening motions as contributing factors to containment failures in hospital isolation rooms, PLos One 8 (2013) e66663, , http://dx.doi.org/ 10.1371/journal.pone.0066663. [9] P. Kalliomäki, P. Saarinen, J.W. Tang, H. Koskela, Airflow patterns through single hinged and sliding doors in hospital isolation rooms, Int. J. Vent. 14 (2015) 111–126. [10] P. Kalliomäki, P. Saarinen, J.W. Tang, H. Koskela, Airflow patterns through single hinged and sliding doors in hospital isolation rooms – effect of ventilation, flow differential and passage, Build. Environ. 107 (2016) 154–168, http://dx.doi.org/ 10.1016/j.buildenv.2016.07.009. [11] I. Eames, D. Shoaib, C.A. Klettner, V. Taban, Movement of airborne contaminants in a hospital isolation room, J. R. Soc. Interface 6 (2009) S757–S766, http://dx.doi. org/10.1098/rsif.2009.0319.focus. [12] D.E. Kiel, D.J. Wilson, Combining door swing pumping with density driven flow, ASHRAE Trans. 95 (1989) 590–599. [13] L. Fontana, A. Quintino, Experimental analysis of the transport of airborne contaminants between adjacent rooms at different pressure due to the door opening, Build. Environ. 81 (2014) 81–91, http://dx.doi.org/10.1016/j.buildenv.2014.05. 031. [14] A. Hathway, I. Papakonstantis, A.B. Konuah, W. Brevis, Towards understanding the. Flow visualisations - The door opening allows a rotating cloud of coloured water to enter the second room into which the door opens. The rotating cloud is initially almost axisymmetric (like a rotating cylinder) but it becomes soon three-dimensional. A large scale vortex is formed due to door closure which propagates along the vertical walls, grows and occupies most of the available space. In the first room a cloud of coloured water spreads longitudinally, while growing transversely and vertically. At a time of about 4 min after the initiation of the door motion there is still a region in both rooms which has not been coloured, indicating that the complete mixing in the room needs more time. Velocity field - The velocity field compares well to the flow visualisations. The median velocity in the region of the door as it opens peaks at 0.22 m/s (full scale) with some higher values of the order of the door tip speed. Exchange volume - The exchange volumes of fluid, obtained from measurements in a small scale model, normalised by the volume swept by the door motion, are comparable to those obtained from full scale measurements. This finding shows that such normalisation allows comparison of exchange volumes estimated in different studies and application of the results to practical purposes. - For the full scale angular door speeds 19.35 deg/s and 27.09 deg/s considered in this study (door opening times 4.6 s and 3.3 s respectively) the average exchange volume normalised by the 229.
(11) Building and Environment 131 (2018) 220–230. I.G. Papakonstantis et al.. [15]. [16] [17]. [18]. [19]. [20]. [21]. role of human activity on indoor air flows: a case study of door motion based on both field and experimental activities, Proc. Indoor Air 13 (2014) 7–12. A. Hathway, I. Papakonstantis, A. Bruce-Konuah, W. Brevis, Experimental and modelling investigations of air exchange and infection transfer due to hinged-door motion in office and hospital settings, Int. J. Vent. 14 (2015) 127–140. J. Posner, C. Buchanan, D. Dunn-Rankin, Measurement and prediction of indoor air flow in a model room, Energy Build. 35 (2003) 515–526. S.B. Poussou, S. Mazumdar, M.W. Plesniak, P.E. Sojka, Q. Chen, Flow and contaminant transport in an airliner cabin induced by a moving body: model experiments and CFD predictions, Atmos. Environ. 44 (2010) 2830–2839, http://dx.doi. org/10.1016/j.atmosenv.2010.04.053. X. Cao, J. Liu, N. Jiang, Q. Chen, Particle image velocimetry measurement of indoor airflow field: a review of the technologies and applications, Energy Build. 69 (2014) 367–380, http://dx.doi.org/10.1016/j.enbuild.2013.11.012. P.H. Biwole, W. Yan, Y. Zhang, J.-J. Roux, A complete 3D particle tracking algorithm and its applications to the indoor airflow study, Meas. Sci. Technol. 20 (2009) 115403, http://dx.doi.org/10.1088/0957-0233/20/11/115403. A. Hathway, I. Papakonstantis, CFD, Simulation of airflow due to door motion using a momentum source method, 14th Int. Conf. IBPSA - Build. Simul. vol. 2015, 2015, pp. 911–916. T.L. Thatcher, D.J. Wilson, E.E. Wood, M.J. Craig, R.G. Sextro, Pollutant dispersion in a large indoor space: Part 1-Scaled experiments using a water-filled model with occupants and furniture, Indoor Air 14 (2004) 258–271, http://dx.doi.org/10. 1111/j.1600-0668.2004.00242.x.. [22] W. Lai, G. Pan, R. Menon, D. Troolin, E. Graff, M. Gharib, F. Pereira, Volumetric three-component velocimetry: a new tool for 3D flow measurement, Proc. 14th Int. Symp. Appl. Laser Tech. To Fluid Mech. Lisbon, Port, 2008. [23] D. Kim, M. Gharib, Experimental study of three-dimensional vortex structures in translating and rotating plates, Exp. Fluid 49 (2010) 329–339, http://dx.doi.org/ 10.1007/s00348-010-0872-6. [24] D.R. Troolin, E.K. Longmire, Volumetric velocity measurements of vortex rings from inclined exits, Exp. Fluid 48 (2010) 409–420, http://dx.doi.org/10.1007/s00348009-0745-z. [25] F. Pereira, M. Gharib, D. Dabiri, D. Modarress, Defocusing digital particle image velocimetry: a 3-component 3-dimensional DPIV measurement technique. Application to bubbly flows, Exp. Fluid 29 (2000) S078–S084. [26] F. Pereira, M. Gharib, Defocusing digital particle image velocimetry and the threedimensional characterization of two-phase flows, Meas. Sci. Technol. 13 (2002) 683. [27] K. Ohmi, H.-Y. Li, Particle-tracking velocimetry with new algorithms, Meas. Sci. Technol. 11 (2000) 603. [28] J. Westerweel, F. Scarano, Universal outlier detection for PIV data, Exp. Fluid 39 (2005) 1096–1100, http://dx.doi.org/10.1007/s00348-005-0016-6. [29] I. Papakonstantis, A. Hathway, W. Brevis, PTV and Video Data Underpinning “An Experimental Study of the Flow Induced by the Motion of a Hinged Door Separating Two Rooms”, (2017), http://dx.doi.org/10.15131/shef.data.5319547. [30] S.D. Hamilton, K.W. Roth, J. Brodrick, Displacement ventilation, ASHRAE J. 46 (2004) 56.. 230.
(12)
Figure


+3
![Fig. 10. Normalised exchange volume against angular door speed for a certain hold open time (t h = 1.99 s for present study, 2.0 s for [7], and 1.0 s for [12])](https://thumb-us.123doks.com/thumbv2/123dok_es/7318978.451576/8.892.59.491.80.898/normalised-exchange-volume-angular-speed-certain-present-study.webp)
Documento similar
In this contribution, the planning and management of ante-earthquake emergency scenarios have been approached by proposing an improved method for the assessment of
Two applications have been developed for this dissertation: Painometer (an app that helps in the process of assessing pain intensity), and Fibroline (an app that aims
‘What is education for?’, by Roger Marples, critically discusses three philosophical curriculum theories in relation to the aims of education (namely, RS Peters’ and
Two different fusion architectures have been considered, an ideal case having exactly the same number of footstep and face signals, and a more realistic case with an adaptive fusion
The atrium has been equipped with temperature, pressure and velocity sensors, in order to study the thermal and fluid fields induced by the fire. Up to sixty one sensors have
Fast computation of shielding effectiveness of metallic enclosures with apertures and inner elements
There is an optimum for resonance damping and is the same for emission and radiation as reciprocal values of shielding effectiveness have been obtained for immunity and
Furthermore, two predictive models have been developed (an ARIMA Time Series and an LSTM recurrent neural network) to study how time series models adapt to this type of data..
Results. We determine an upper limit of 8 km s −1 for the projected rotational velocity and derive the surface abundances; we find the star to have a silicon abundance below solar,
