1
PRODUCTION OF STABILIZED QUERCETIN AQUEOUS SUSPENSIONS BY SUPERCRITICAL FLUID EXTRACTION OF EMULSIONS
György Lévai, Ángel Martín*, Esther de Paz, Soraya Rodríguez-Rojo, María José Cocero High Pressure Processes Group.- Chemical Engineering and Environmental Technology–
2
PRODUCTION OF STABILIZED QUERCETIN AQUEOUS SUSPENSIONS BY SUPERCRITICAL FLUID EXTRACTION OF EMULSIONS
György Lévai, Ángel Martín*, Esther de Paz, Soraya Rodríguez-Rojo, María José Cocero High Pressure Processes Group.- Chemical Engineering and Environmental Technology–
University of Valladolid, Doctor Mergelina s/n 47011 Valladolid (Spain) Tel: +34 9831840711, e-mail: mamaan@iq.uva.es (Á. Martín)
Abstract
Quercetin is a flavonoid with highly promising bioactivity against a variety of diseases, due to its strong antioxidant, antiviral and antihistaminic effect, but these applications are limited by the low solubility of quercetin in gastrointestinal fluids and the correspondingly low bioavailability. The objective of this work is to produce encapsulated quercetin particles in sub-micrometric scale, in order to increase their low bioavailability. These particles were produced by extraction of organic solvent from oil in water emulsions by Supercritical Fluid Extraction of Emulsions (SFEE). Due to the rapid extraction of organic solvent by this method, the disperse organic phase becomes rapidly supersaturated, causing the precipitation of quercetin particles in sub-micrometric scale, encapsulated by the surfactant material. Two different biopolymers (Pluronic L64 ® poloxamers and soy bean lecithin) were used as carriers and surfactant materials. In experiments with Pluronic, needle quercetin particles were obtained after SFEE treatment, with particle sizes around 1 µm and poor encapsulation efficiency. In case of soy lecithin, quercetin-loaded multivesicular liposomes were obtained, with a mean particle size around 100 nm and around 70% encapsulation efficiency of quercetin, without presence of segregated quercetin crystals.
3 1. INTRODUCTION
Quercetin (3,3’,4,4’,5,7-pentahydroxyflavone, chemical structure presented on Figure 1) is a bioflavonoid, available in various fruits, vegetables and oils. It can scavenge reactive oxygen species, and down-regulate lipid peroxidation due to its ion chelating and iron stabilizing effect [1]. Furthermore it can promote the oxidation of Fe2+ to Fe3+, which is less effective in generating free radicals. These effects of quercetin may be explained by its o-diphenol B-ring structure [2] and the ability of donating π electrons from the benzene ring, while it is remaining relatively stable [3]. It has also anti-proliferative effects in a wide range of human cancer cell lines [4]. Due to these properties, quercetin is a highly promising active compound against a wide variety of diseases.
(FIGURE 1)
4
supercooled melts, drug nanoparticles, which caused a certain scatter in the particle size distribution, with particle sizes spanning the range from 20 nm to 500 nm. The absorption rate of quercetin loaded solid lipid nanoparticles was studied by in-situ perfusion method in rats, obtaining a 6-fold relative increase in bioavailability, compared to unprocessed quercetin.
Supercritical fluids are another promising alternative in the processing of natural bioactive compounds, such as quercetin, because they allow carrying out the encapsulation process at near ambient temperatures, and in an inert atmosphere, thus avoiding the thermal degradation or oxidation of the product and reducing its contamination with organic solvents. Several authors have studied the processing of quercetin by supercritical fluid technologies. Due to the low solubility of quercetin in supercritical carbon dioxide [12], Supercritical Antisolvent (SAS) experiments have been particularly successful. By SAS processing of pure quercetin, crystalline particles with particle sizes in the micrometer range (1 – 6 m) have been obtained [13, 14, 15]. Fraile et al. [16] produced quercetin particles encapsulated with Pluronic F127 by SAS technology. As in previous works, SAS-processed pure quercetin crystallized as needle like particles, meanwhile quercetin co-precipitated with Pluronic had a totally different spherical morphology, indicating that Pluronic F127 was able to successfully encapsulate quercetin. Higher particle sizes were obtained when the quercetin / Pluronic mass ratio was increased, due to the possible aggregation of the polymer shells. Obtained morphologies indicate, that quercetin particles acted as nucleation sites for the formation of a polymer film, and this film of polymer restrained the growth of quercetin particles above the mass ratio of 1/1 = quercetin / Pluronic. With this encapsulation method, the solubility of quercetin in simulated intestinal fluid was increased by a factor of 8.
5
drugs in an aqueous suspension. The process consists of forming an oil-in-water emulsion, containing the water-insoluble drug in the dispersed organic phase. By SFEE, the organic solvent is extracted from this emulsion by the supercritical solvent, which should have high affinity to the organic solvent and a low affinity to the active compound of interest. Due to the solubility differences, the supercritical solvent quickly extracts the organic solvent from the emulsion, leading to the rapid super-saturation of active compound, and hence a fast precipitation. Meanwhile in the SAS antisolvent precipitation method particle nucleation and growth occur across the whole solution volume, in the case of SFEE the formation of particles is confined within the emulsion droplets. This restrains the size of the particles obtained, that can be one order of magnitude smaller than particles produced by solution precipitation [17].
F. Mattea et al. studied the precipitation of β-carotene by continuous SFEE in order to model the process [18]. In this study submicro- and nano-particles were obtained with a residual organic content as low as 1 ppm. The obtained particle size distribution was directly related with the droplet size distribution of the initial emulsion, while residual organic content depended on the process parameters, such as the pressure and the temperature. Model results showed that the saturation of organic phase droplets with CO2 caused a rapid antisolvent
effect, which in the continuous implementation of the process can take place during the drop fly time, while the elimination of the residual organic solvent was much slower. Based on experimental and model results, a two-step process strategy can be proposed. The first step would involve contact between emulsion and CO2, to ensure the saturation of the disperse
phase, in order to achieve precipitation by antisolvent effect. A second step would involve an extended contact between CO2 and emulsion, in order to eliminate the remaining organic
6
emulsion destabilization is no longer a problem. In a subsequent work, Santos et al. extended this approach to the precipitation of lycopene [19].
The aim of this study is to apply the Supercritical Fluid Extraction of Emulsion process to the encapsulation of quercetin. Based on the available information, two different carrier materials that have been found to increase the water solubility and the bioavailability of quercetin have been tested: Pluronic block copolymers, and soybean lecithin. The influence of the main process parameters has been studied, including properties of the initial emulsion, extraction time and extraction conditions. The performance of the process has been evaluated analysing the encapsulation efficiency and particle size and morphology of the final aqueous suspensions.
2. EXPERIMENTAL SECTION 2.1 Materials
Quercetin Hydrate (C15H10O7xH2O, 95% purity, CAS: 849061-97-8) was obtained from
7
2.2 Emulsion preparation and supercritical extraction of the emulsion
The initial emulsion was prepared using an Ultraturrax IKA LABOR-PILOT 2000/4 (IKA-WERKE GMBH&CO.KG) high frequency mixing device with a cooling jacket. The required amount of quercetin was dissolved in an organic solvent (ethyl acetate), and a required amount of surfactant material (Pluronic L64 or lecithin) was dissolved in water, purified by Millipore Elix. Then these two solutions were mixed together by a magnetic stirring for 5 minutes, in order to obtain a homogeneous dispersion. Afterwards, the dispersion was mixed by the Ultraturrax emulsifier at 70 Hz frequency for a predefined time.
To extract the organic solvent from the initially prepared emulsion, a batch SFEE equipment – presented on Figure 2 – was used. The equipment consists of two vessels: an extractor vessel with a volume of 85 mL, and a buffer vessel with a volume of 100 mL. The vessels are located in a thermostated oven, and are separable from each other by two valves.
Firstly, the equipment was pressurized with scCO2 and thermostated (typically, at 110 bar
and 40ºC). Afterwards 25 mL of the initially prepared emulsion was injected by an HPLC into the extraction vessel. The emulsion was loaded after the pressurization of the system, as otherwise the disturbances caused by the addition of CO2 can spill the emulsion out from the
extraction vessel into the recirculation circuit, making it difficult to recollect the treated emulsion after the experiment. Then the HPLC pump was isolated from the circuit by closing the valve in its impulsion, and the CO2 recirculation pump was switched on, starting the
circulation of the scCO2 between the CO2 buffer vessel and the extraction vessel. During this
process, scCO2 was bubbled through the emulsion, in order to extract the organic solvent
from it. As the scCO2 gradually became saturated with organic solvent during this batch
8
maintain the extraction vessel at a constant pressure, meanwhile the CO2 was renewed in the
rest of the circuit, thus minimizing the disturbances and losses of emulsion by entrapment in CO2 during the repeated depressurization processes needed for each CO2 renewal.
Considering that the volume of the extraction vessel is 85 mL and it contains 25 mL of liquid emulsion, meanwhile the volume of the buffer vessel is 100 mL, it is estimated that approximately 60% of CO2 in the circuit was renewed with this procedure. After several
cycles, the complete system was slowly depressurized, and the aqueous suspension – got from the emulsion by SFEE treatment – was retrieved from the extraction vessel and stored for analysis.
(FIGURE 2) 2.3 Analytical methods
2.3.1 Initial emulsion stability measurement by laser diffraction
9
V [m/s], continuous phase viscosity and density, dispersed phase density and volume fraction, using the General Settling Law [22].
2.3.2 Particle size distribution measurement and morphological characterization
A Malvern Mastersizer 2000 Light Scattering device from Malvern Instruments was used in order to define the particle size distribution in the final aqueous suspension after SFEE treatment. This equipment is able to measure particle size between 0.02 – 2000 µm, using a diode laser 4 mW with a dual – wavelength detection system (red light 633 nm, blue light 436 nm). The sample was diluted by deionized water in the dispersion unit (Hydro SM) to obtain an adequate level of laser obscuration and prevent multiple scattering effects. The refractive index of the dispersed phase (water) is 1.331, meanwhile for quercetin particles is 1.823. Each measurement was performed triplicate.
Additionally, visual observations of the initial emulsions and SFEE-treated aqueous suspensions were done by microscopy in order to obtain information about the morphology of the initial emulsion and the final suspension, and to confirm the size measurements obtained by laser diffraction. Two different techniques were used depending on the particle size of the analysed samples: optical microscopy, using a Leica microscope for initial emulsion, and Cryo - TEM technology using a GATAN PB3 Cryoplunge equipment to freeze and carbon coat the sample. The carbon coated samples were analysed by a JEOL JEM-FS2200 HRP 200 kV TEM equipment with electron filtering, to obtain micrographs of the frozen samples of the final suspensions after the SFEE treatment, when lecithin was used as surfactant material, due to the too low particle size of samples for optical microscopy.
10
bar vacuum for two days at 35°C, in order to remove the adsorbed water and solvents, while avoid the degradation of quercetin.
X-Ray diffraction (XRD) patterns of dried samples were determined by a BRUKER D8 DISCOVER A25 device, Generator 3KW, Ceramic cupper tube 2.2 KW type FFF, in order to determine the crystallinity of lecithin encapsulated quercetin samples. Samples were prepared similar way than in case of FTIR measurements.
2.3.3 Residual organic content
The remaining organic solvent concentration after SFEE treatment was measured by Head Space Gas Chromatography. Measurements were done three times in different days, in order to determine the reliability of measurements and to evaluate the standard deviations of measurements.
In order to perform the chromatographic analysis, 4 mL of sample were introduced in a 10 mL vial, and this vial was hermetically closed with a septum. The vial was heated for 1 hour in an oven at 40º C, and after that time, a sample of the vapour of the upper part of the vial (headspace) was taken with a 1000 μL syringe and introduced into the chromatograph. The syringe must be filled 3 times with that same vapour in order to homogenize its content. The apparatus used for this analysis was an Agilent Technologies 7890A gas chromatograph with a flame ionization detector (FID), with a HP-5 5% phenyl-methyl-silicone 30 m x 32 m x 25 μm column. The operating conditions for the analysis were: injector temperature 200º C, detector temperature 200º C, column temperature 80 ºC, injector flow rate 24 mL/min, column flow rate 1 mL/min (He) and split (sample dilution) 70:1.
2.3.4 Quercetin concentration
11
Shimadzu UV-2550 spectrophotometer. Measurements were done at a wavelength of 373 nm. Samples were diluted in 20 volumes of acetone before measurement. In addition, long term stability measurements of remained quercetin were also done, keeping the samples in fridge at 4ºC at least one month after the experiment.
In samples with lecithin as carrier material, it was not possible to determine the concentration of quercetin by UV-VIS spectroscopy due to the interference of lecithin in the absorption spectra [23]. In this case, quercetin concentration was determined by HPLC using a Waters 2487 chromatography system, consisting of a Waters In-Line degasser, Waters 515 HPLC pump and Waters 717 Plus Autosampler device. The injection volume of samples was 20 µL. The mobile phase was acetonitrile / milliQ water containing acetic acid in 5 V/V% concentration with a flowrate of 1 mL/minute. The method used a Pre-column, Guard cartridge package 2 from BIO-RAD: Bio-Sil C18 HL90-5 30 X 4.6 mm with a pore size 5 µm. The column was Waters Symmetry ® C18 150 X 4.6 mm with a pore size 5 µm, thermostated at 30°C. The detector was Waters 2784 Dual λ absorbance detector set on wavelength of 373 nm in order to determine the quercetin concentration with a retention time 8.32 min. Each sample was measured twice: one without centrifugation, and one with 30 min 2.3 g centrifugation (Spectrafuge 240, Labnet International Inc., NJ, USA) in order to separate sedimented crystals. Furthermore samples were diluted 5 times in volume by MeOH and filtered by 2.2 µm pore size PTFE filters. To quantify the concentration of quercetin, a calibration line was developed from analysis of standard solutions of quercetin dissolved in a solution of methanol / water = 70 / 30 (V/V%), in the concentration range from 25 to 200
µg/mL.
2.3.5 Antioxidant activity
12
disodium fluorescein (FL) catalysed by peroxyl radicals generated from α, α’-Azodiisobutyramidine Dihydrochloride porum (AAPH). In a 96-well micro plate 25 µL of the appropriate sample dilution were added together with 150 µL of disodium fluorescein (10 nM). The micro plate was put in a fluorescent reader that allowed incubating the samples at 37ºC for 30 minutes. The reaction was started with 25 µL of AAPH (240 mM). Fluorescence emitted by the reduced form FL was measured in an BMG LABTECH Fluostar OPTIMA fluorescent reader, recorded every 1 min at the emission wavelength of 530±25 nm and excitation wavelength of 485±20 nm for a period of 90 min. Phosphate buffer (75 mM, pH=7.4) was used to prepare AAPH and FL solutions, and was also used as blank. Standards went from 13 till 200 µM Trolox, and additionally one independent control sample was also prepared. Samples and an independent control sample were analysed six times, blank and standards three times. Final ORAC values were calculated by a regression equation between the Trolox concentration and the net area under the FL decay curve and expressed as µM Trolox Equivalents per gram of quercetin (µM TE/g quercetin). Samples were centrifuged by 2.3 g, diluted 50 times by milliQ water and filtered by 2.2 µm pore size PTFE filters [24].
2.4 Experimental plans and statistical analysis of results
13
According to several articles, regarding to supercritical fluid extraction of emulsion technology, there is a significant correlation between the droplet size in initial emulsion and the final particle size distribution [19, 17]. Thus, as a preliminary study, in the first set of the experiments the main process parameters analysed were those expected to influence the properties of the initial emulsion: quercetin concentration (0.02 – 0.04 w/w%), Pluronic L64 concentration (0.6 – 1 w/w%), organic/water ratio (0.2 – 0.3) and emulsifying time ( 2 – 6 min). In five cases SFEE treatment of the emulsion was completed as well, in order to determine the required number of cycles and duration of cycles of SFEE treatment according to the final particle size distribution and residual organic content.
According to the results of the first experimental plan, a second experimental plan (three factors varied in two levels, full resolution with three centrum point measurements) was performed to study the effect of Pluronic L64 concentration (0.8 – 1.2 w/w%), quercetin concentration (0.02 – 0.03 w/w%) and organic/water ratio (0.25 – 0.35), in the remaining organic solvent, average final particle size in aqueous suspension and quercetin recovery ratio after SFEE treatment.
14 3. RESULTS AND DISCUSSION
3.1 Extraction efficiency of organic solvent
As a preliminary study, ethyl acetate-on-water emulsions stabilized by Pluronic L64 were treated by SFEE applying different extraction times, in order to optimize the requested treatment time decreasing the residual organic content under 100 ppm. This value is well below the restriction of FDA: 5000 ppm, corresponding with 50 mg/day [25]. Five drying cycles were applied with varying cycle times, with an extraction pressure of 10 MPa and an extraction temperature of 40ºC. The results are reported in Table 1 In order to decrease the remained organic solvent below 100 ppm, treatment time should be around 575 min. A further increase in SFEE treatment time is not advisable since particles could aggregate or degrade due to the longer treatment time, and there is no significant reduction in the residual ethyl acetate content. Considering this, in all further SFEE experiments, five extraction cycles with a total extraction time of 575 min were used, with the following extraction times in each cycle: 20 min in the 1st cycle, 90 min in the 2nd cycle, 120 min in the 3rd cycle, 135 min for in 4th cycle and 210 min in the 5th and last cycle, with longer extraction times in the last cycles, because as the concentration of solvent in the initial emulsion becomes smaller, more time is required for saturation of the carbon dioxide used for the extraction.
(TABLE 1)
3.2 Emulsification of ethyl acetate in water using Pluronic L64 as surfactant: variation of emulsion properties with emulsification conditions
15
employed were appropriate for producing an emulsion with the required characteristics of a small droplet size and a high homogeneity. Furthermore, droplet sizes determined by an image analysis technique are equivalent to the average droplet sizes measured by TurbiScan, confirming the reliability of the TurbiScan size measurements.
(TABLE 2) (FIGURE 3)
Figure 4 presents the results obtained from the statistical analysis of the results of the experimental plan presented in Table 2 as surface response plots. According to centrum point measurements, a linear model is not suitable for all of the factors, so it is necessary to use a quadratic model as well. Significant factors in 95% confidence level are the combination of the concentration of Pluronic L64 and EtAc. With higher concentrations of both compounds, smaller droplet diameters could be obtained in the initial emulsion (Figure 4). Another significant factor, according to a quadratic model, is the emulsification time. The optimum emulsification time was 4 minutes (Figure 4), with larger emulsion droplet sizes when either the emulsification time was too short for a complete homogenization of the system, or too high leading to an increased droplet size probably due to coalescence and temperature effects. According to these results, a fixed emulsification time of 4 minutes was employed in all remaining experiments. Concentration of quercetin was not a significant factor on the average droplet size of initial emulsion.
(FIGURE 4)
3.3 Supercritical Fluid Extraction of Emulsions stabilized with Pluronic L64
16
size distributions. Probably due to the needle morphology of crystals obtained in experiments, in every cases, the particle size distributions were multimodal. However, it must be noted, that due to the needle-like morphology, the accuracy of particle size measurements probably is not high, because the measured dimensions of the crystals depend on the spatial orientation of crystals in the measurement cells during measurement. As reported in Table 3, in the experiments with the best results according to the mean particle size marked bold, the residual EtAc content was under 300 ppm and the proportion of particles with a size below 10
µm was higher than 30% (V/V%). According to UV-VIS measurements, in every case around 70% of the initially added quercetin was recovered in the SFEE treated aqueous suspension, corresponding to quercetin concentrations in the range of 0.160 – 0.245 g/L, and in every cases the quercetin content was stable up to two months, with samples stored in glass vials in fridge at 4°C.
(TABLE 3) (FIGURE 5)
According to the statistical analysis of results, presented in the Pareto chart shown in Figure 6, final particle size distribution were influenced by the concentration of quercetin, according to linear model, and concentration of EtAc, according to a quadratic model. In order to decrease the particle size, it is necessary to increase the concentration of quercetin, and to choose an optimal concentration of EtAc. If the initial concentration of EtAc is high, high residual organic solvent concentrations are observed in the final product, which can also influence the formation of particles, meanwhile if the concentration of EtAc is too low, it is possible that solvent is removed and particles formed already in the first cycles of the extraction, and particles start to aggregate or degrade along the remaining treatment time. On the other hand, there is no significant factor influencing the quercetin recovery ratio.
17
The results of the statistical analysis indicate, that the outcome of the precipitation mainly depended on the concentration of quercetin in the original solution, which is a determinant factor for an antisolvent precipitation from a homogeneous solution, and it was not influenced by the parameters that significantly influenced the droplet size of the emulsion, such as the concentration of surfactant, or the organic/water ratio. These results of the statistical analysis agree with the morphology presented in the micrograph of Figure 3, which as previously described showed large crystalline particles of quercetin, which apparently were not encapsulated or dispersed by the surfactant material. Indeed, the morphologies and sizes – obtained and shown in this Figure – are similar to the results reported by Fraile et al. by precipitation of quercetin by SAS process from quercetin – acetone homogenous solutions, changing the initial concentration of quercetin. In the work of Fraile et al., morphology and particle size depended on the initial concentration of quercetin: with increasing quercetin concentration, particle size decreased. Precipitated quercetin crystals also showed needle-like morphology, agglomerated in flocks of about 1 µm scale [16]. Considering these results, it can be concluded that Pluronic L64 is not a suitable material to encapsulate quercetin, as the precipitation occurred as in a normal anti-solvent process, and the surfactant did not provide any additional control over particle size through the formation of an emulsion template.
3.4 Preparation of emulsions using lecithin as surfactant
18
As presented in Table 5, the droplet size of the initial emulsions prepared with lecithin, showed smaller variations with process conditions than those observed in experiments with Pluronic L64 and reported in Table 2. According to the statistical analysis of the results presented in Table 4, factors influencing the average droplet size in initial emulsion were the concentration of lecithin and concentration of EtAc. The concentration of lecithin should be increased in order to decrease the droplet size in initial emulsion, while the concentration of EtAc should be decreased.
In addition to a smaller droplet size and smaller variability of this size (Table 4 and Table 5), the use of lecithin as surfactant provided a better stability of the emulsion. This is shown in the results presented in Table 5 that summarize the measurements of emulsion stability, performed with the Turbiscan apparatus. As presented in this table, the migration rate, which is related to the emulsion destabilization by creaming effect, was less than halve in emulsions prepared with lecithin than in emulsions with Pluronic L64.
(TABLE 4) (TABLE 5)
3.5 Supercritical Fluid Extraction of Emulsions stabilized with Lecithin
Table 4 reports the main results obtained after SFEE treatment of emulsions prepared with lecithin. As shown in Figure 7, after SFEE treatment, multimodal particle size distributions were obtained, with a main peak in the sub-micrometer size range, and additional peaks at larger sizes, that probably corresponded to a small number of large quercetin crystals that were not encapsulated in lecithin, in some cases visible for the naked eye.
(FIGURE 7)
19
correspond well with the measurements obtained by laser diffraction, reported in Table 4. In experiments performed with higher lecithin concentration, TEM micrographs showed bigger particles due to the formation of multi-layered vesicles (Figure 8 C). One experimental run was done without quercetin (other settings are the same as in the case of centrum point runs), in order to can compare by TEM the structure of the system with and without quercetin (Figure 8 D). Multivesicular system is observed in all cases (expect of the one with higher lecithin concentration, Figure 8 C), without any variation in the morphology due to the presence of quercetin, which further indicates that segregated crystals of quercetin were not formed, and therefore did not alter the morphology of the vesicles.
Regarding the influence of process parameters, if experimental results are analysed considering the average particle size d0.5, inconclusive results with weak dependencies in all
20
probably due to the small variation of the properties of emulsions prepared with lecithin with process conditions, described in section 3.4.
The average of recovered quercetin after SFEE is 65.4 %, corresponding to concentrations in the range of 0.16 – 0.2 g/L, depending on the initially added quercetin. This result is approximately 16 – 20 times higher than the solubility of quercetin in pure water (0.01 g/l) [26], indicating that it was possible to substantially increase the amount of quercetin that could be stabilized in the aqueous suspension by encapsulation in lecithin liposomes. No significant factor was found to influence the quercetin recovery. According to Figure 10, lecithin encapsulated quercetin was stable up to 14 days. This means that the degradation of quercetin, the crystallization process of quercetin out of lyposomes, or growing of already
Several SFEE treated aqueous suspensions where characterized by FT-IR spectroscopy in order to determine the mechanism of encapsulation of quercetin by lecithin. As presented in Figure 11, pure quercetin show its characteristics peaks [27] in the range of 1600 – 1100 cm-1, and OH – phenolic bending: 1400 – 1200 cm-1. Lecithin shows characteristic peaks [28] in the range of 1765 – 970 (at 1765-1720 cm-1 corresponding to C=O, 1200-1145 cm-1 corresponding to P=O, 1145-970 cm-1 corresponding to P-O-C, and 1200-970 cm-1 corresponding to P-O-C + PO2).
21
1625 cm-1 and 1170 cm-1. This result indicates that in the SFEE treated sample, quercetin is encapsulated by lecithin and it is not present as segregated crystals.
(FIGURE 11)
An XRD spectra of physical mixture of quercetin/lecithin = 1/75 in mass and experimental run 1 and 8 were measured also by XRD, in order to examine the encapsulation of quercetin by lecithin. In order to directly analyse the aqueous suspensions without drying, samples from experimental runs were disposed on the surface of a silica slide, and their spectra was corrected as well of the spectra of the pure silica slide. As visible on the spectra presented on Figure 12, lecithin presents a peak at 20°, meanwhile pure quercetin has high crystallinity and presents its characteristics peaks at 2θ values: 10.78°, 12.46°, 15.88°, and two more prominent peaks at 25.66°, and 27.4°.[29, 30]. According to the XRD spectra, physical mixture and the experimental runs have similar spectra than pure lecithin has, conforming that encapsulation of quercetin is performed without formation of segregated crystals.
(FIGURE 12) 3.7 Antioxidant activity
22
molecular weight antioxidant compounds of lecithin during the supercritical CO2 treatment,
such as sterols.
Furthermore quercetin – lecithin physical mixtures in different mass ratios (quercetin / lecithin = 1 / 36; quercetin / lecithin = 1 / 75 same as the centrum point standard runs; quercetin / lecithin = 1 / 160: equal ratio as experimental run 9 in mass) were also prepared in a solution EtOH (abs.) / water milliQ = 1 / 1 in volume, in order to compare the antioxidant activity of pure physical mixtures (without SFEE treatment) with antioxidant activities of treated samples. As displayed in Figure 13, this quercetin – lecithin physical mixtures have an increased antioxidant activity, comparing to pure, unprocessed quercetin, due to an antioxidant synergism effect: there are chain structures formation between quercetin and phosphatidyl-choline, linked by hydrogen bonds [2]. The antioxidant activity of physical mixtures (reported as a function of the amount of quercetin in the sample) is independent on the mass ratio of quercetin / lecithin.
Quercetin encapsulated in lecithin by SFEE treatment also shows a higher antioxidant activity than pure quercetin. However, as in the case of pure lecithin, SFEE treated quercetin-lecithin samples show lower antioxidant activity than physical mixtures of the two compounds, again probably due to the loss of low molecular weight antioxidant compounds of lecithin by CO2
extraction.
Analyzing the results of SFEE treated samples, in case of experimental run 8, the antioxidant activity is not changing significantly in the following 10 days after the experiment. Furthermore, antioxidant activity of experimental run 7 (C) also did not change significantly after 10 days. An increased antioxidant activity is obtained in experimental run 9 (with an increased lecithin concentration, quercetin / lecithin ~ 1 / 160 in mass ratio) comparing with the other SFEE treated samples.
23 4. CONCLUSIONS
In this work encapsulated quercetin microparticles were produced by SFEE from an initially prepared oil in water emulsion. Two types of surfactant material were tried: Pluronic L64® and soy bean lecithin. Pluronic is not a suitable material to encapsulate quercetin because micrometric crystalline particles of quercetin were obtained without encapsulation, meanwhile with soy bean lecithin multivesicular system was obtained in sub-micrometric scale, with an encapsulation efficiency around 70%, encapsulated quercetin stable up to two weeks and residual organic content below 300 ppm, and without presence of crystalline quercetin particles. The antioxidant activity of quercetin was enhanced by encapsulation in lecithin, in agreement with previous reports that describe a synergistic effect of these two compounds, but the antioxidant activity decreased by SFEE treatment, perhaps due to a partial extraction of low molecular weight fractions of quercetin by supercritical CO2.
Acknowledgements
24 REFERENCES
[1]S. Das, A. Mandal, A. Ghosh, S. Panda, N. Das, S. Sarkar, Nanoparticulated quercetin in combating age related cerebral oxidative injur, Cur Aging Science, 2008, p. 1
[2]M. F. Ramadan, Antioxidant characteristics of phenolipids (quercetin-enriched lecithin) in lipid matrices, Industrial Crops and Products 36, 2012, p. 363–369
[3]A. Parmara, K. Singhb, A. Bahadurc, G. Marangonib, P. Bahadura, Interaction and solubilization of some phenolic antioxidants in Pluronic® micelles, Colloids and Surfaces B: Biointerfaces 86, 2011, p. 319–326
[4]Y. Gao, Y. Wang, Y. Ma, A. Yu, F. Cai, W. Shao, G. Zhai, Formulation optimization and in situ absorption in rat intestinal tract of quercetin-loaded microemulsion, Colloids and Surfaces B, Biointerfaces, Vol 71, 2009, p. 306
[5]C. Somsuta, S. Sami, D. Nirmalendu, T. C. Somsubhra, G. Swarpupa, S. Snehasitka, The use of nano-quercetin to arrest mitochondrial damage and MMP-9 upregulation during prevention of gastric inflammation induced by ethanol in rat, Biomaterials Vol. 33, 2012, p. 2991
[6] K.A. Khaled, Y.M. El-Sayed, B.M. Al-Hadiya, Disposition of the flavonoid quercetin in rats after single intravenous and oral doses, Drug Dev. Ind. Pharm. 29, 2003, p. 397–403. [7] R. Gugler, M. Leschik, H.J. Dengler, Disposition of quercetin in man after single oral and intravenous doses, Eur. J. Clin. Pharmacol. 9, 1975, p. 229–234.
25
[9] Pralhad T., Rajendrakumar K., Study of freeze-dried quercetin–cyclodextrin binary systems by DSC, FT-IR, X-ray diffraction and SEM analysis, J. Pharm. Biomed. Anal. 34, 2004, p. 333–339.
[10]Z.P. Yuan, L. J. Chen, L. Y. Fan, M. H. Tang, G. L. Yang, H. S. Yang, X. B. Du, G. Q. Wang, W. X. Yao, Q. M. Zhao, B. Ye, R. Wang, P. Diao, W. Zhang, H. B. Wu, X. Zhao, Y. Q. Wei, Liposomal quercetin efficiently suppresses growth of solid tumors in murine models, Clin. Cancer. Res. 12, 2006, p. 3193–3199.
[11] H. L. Li, X. B. Zhao, Y. K. Ma, G. X. Zhai, L. B. Li, H. X. Lou, Enhancement of gastrointestinal absorption of quercetin by solid lipid nanoparticles, Journal of Controlled Release 133, 2009, p. 238–244
[12] A. Chafter, T. Fornari, A. Berna, R. P. Stateva, Solubility of quercetin in supercritical CO2 + ethanol as modifier: Measurements and thermodynamic modelling. J. Supercrital
Fluids, 32, 2004, p. 189−196.
[13] X. Liu, Z. Li, B. Han, T. Yuan, Supercritical antisolvent precipitation of microparticles of quercetin. Chin. J. Chemical Engineering, 13, 2005, 128−130.
[14] D. T Santos, M. A. A. Meireles, Micronization and encapsulation of functional pigments using supercritical carbon dioxide, J. Food Process Engineering, 36, 2013, 36−49.
[15] P. Alessi, A. Cortesi, N. Zordi, T. Gamse, I. Kikic, M. Moneghini, D. Solinas, Supercritical antisolvent precipitation of quercetin systems: Preliminary experiments, Chemical, Biochemical Engineering Q., 26, 2012, p. 391−398.
26
[17 ] B. Y. Shekunov, P. Chattopadhyay, J. Seitzinger, R. Huff, Nanoparticles of Poorly Water-Soluble Drugs Prepared by Supercritical Fluid Extraction of Emulsions, Pharmaceutical Research, Vol. 23, No. 1, 2006, DOI: 10.1007/s11095-005-8635-4
[18] F. Mattea, Á. Martín, A. Matías-Gago, M., J. Cocero, Supercritical antisolvent precipitation from an emulsion: β-Carotene nanoparticle formation, The Journal of Supercritical Fluids, Vol 51, 2009, p. 238 -247
[19] D. T Santos, Á. Martín, M. A. A. Meireles, M. J. Cocero, Production of stabilized sub-micrometric particles of carotenoids using supercritical fluid extraction of emulsions, The Journal of Supercritical Fluids, Vol. 61, 2012, p. 167-174.
[20] E. Dickinson, Milk protein interfacial layers and the relationship to emulsion stability and rheology, Colloids and Surfaces B: Biointerfaces 20, 2001, p. 197–210
[21] O. Mengual, G. Meunier, I. Cayre, K. Puech, and P. Snabre, Characterisation of instability of concentrated dispersions by a new optical analyzer: the Turbiscan MA 1000. Colloids” Surf. A: Physicochemical Engineering Aspects, vol. 152, 1999, p. 111-123
[22] P. Snabre, P. Mills, Settling of a suspension of hard spheres, Q. Europhysic Letters 25, 9, 1994, 651-656
[23] N. S. Acharya, G. V. Parihar, S. R. Acharya, Phytosomes: Novel approach for delivering herbal, extract with improved bioavailability, Pharma Science Monitor, Vol-2, Issue-1, 2011, ISSN: 0976-7908
[24] F. Ganske, E. J. Dell, ORAC Assay on the FLUOstar OPTIMA to Determine Antioxidant Capacity, Application Note 148, Rev. 2006
27
[26] L. Chebil, C. Humeau, J. Anthoni, F. Dehez, J. M. Engasser, M. Ghoul, Solubility of flavonoids in organic solvents. J. Chem. Eng. Data 52, 2007, p. 1552– 1556.
[27] D. Bennet, M. Marimuthu, S. Kim, J. An, Dual drug-loaded nanoparticles on self-integrated scaffold for controlled delivery,, International Journal of Nanomedicine 7, 2012, p. 3399–3419
[28] J. M. Nzai, A. Proctor, Soy Lecithin Phospholipid Determination by Fourier Transform Infrared Spectroscopy and the Acid Digest/Arseno-Molybdate Method: A Comparative Study, JAOCS 76, J8935, 1999, p.61–66
[29] A. S. M. Ghanem, H. S. M. Ali, S. M. E. Shanawany, E. S. A. Ibrahim, Solubility and dissolution enhancement of quercetin via preparation of spray dried microstructured solid dispersions, Thai J. Pharm. Sci. 37 2013, p. 12-24
28 FIGURE CAPTIONS
Figure 1: Chemical structure of quercetin [5].
Figure 2: Schematic diagram of batch Supercritical Extraction of Emulsions (SFEE) equipment.
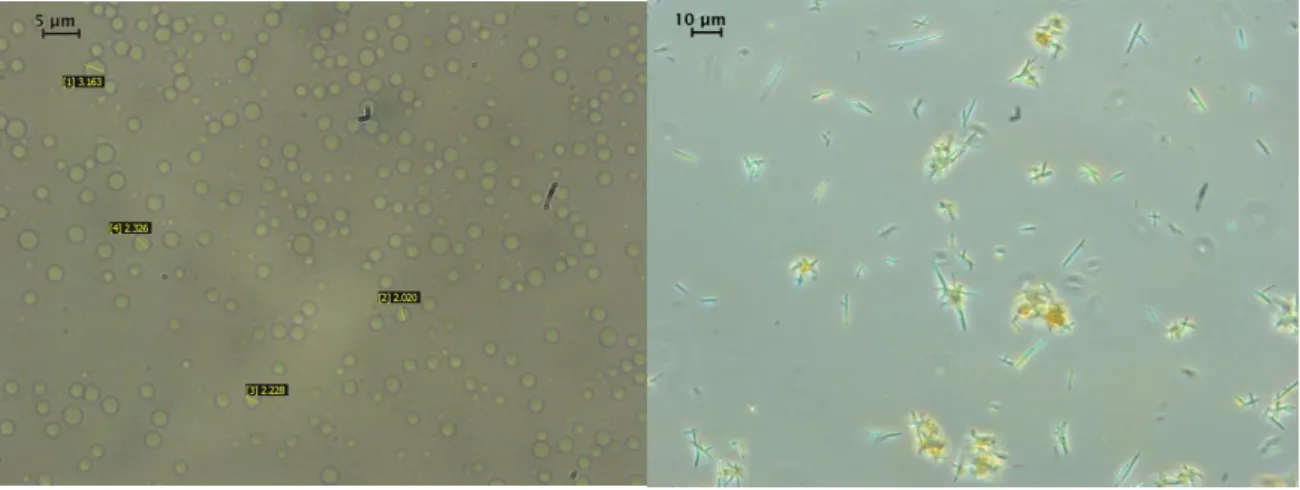
Figure 3: Experiments with Pluronic L64 surfactant: Optical microscopy picture of the initially prepared emulsion (left) and of aqueous suspension of quercetin particles obtained by SFEE treatment of the emulsion (right). Inserts show sizes measured by an image analysis technique.
Figure 4: Surface plot of influencing factors on average droplet size of initial emulsion Figure 5: Example for multimodal particle size distribution with Pluronic L64: experimental run 5 indicated by red, experimental run 5 indicated by green.
Figure 6: Influencing factors for particle size distribution in SFEE treated aqueous suspension
Figure 7: Final particle size distribution of SFEE treated emulsions prepared with lecithin, according to volume percent and number percent
Figure 8: TEM micrographs of particles obtained after SFEE treatment of quercetin emulsion prepared with lecithin: Experimental run 1 of Table 4 (A), Experimental run 8 (B), Experimental run 9 (C) and centrum point run without quercetin (D).
Figure 9: Surface diagram of influencing factors to final particle size distribution according to volume percent of particles under 1 µm
Figure 10: Stability of quercetin suspensions
29
Figure 12: X-Ray diffraction spectra of pure lecithin, quercetin – lecithin physical mixture, Experimental run 1 and 8
30 TABLES
Table 1: Variation of the residual organic content after SFEE treatment as a function of the total extraction time
Total Extraction Time [min]
Residual organic content [ppm]
581 14
529 48
496 113
577 200
32
33
34
Table 5: Stability of ethyl acetate-on-water emulsions prepared with Pluronic L64 and lecithin surfactants
Surfactant material Pluronic L64 Lecithin
Range of solvent/water ratio [mL/mL] 0.25 – 0.35 0.2 – 0.23 Surfactant concentration range [w/w%] 0.8 – 1.2 1.6 – 2.0 Migration rate between [mm/min] 3.37·10-3 – 8.60·10-3 1.58·10-3 – 3.63·10-3 Standard deviation of migration rate 1.67·10-3 6.40·10-4
Average droplet size [µm] 2.6 1.6
35 FIGURES
36
37
Figure 3: Experiments with Pluronic L64 surfactant: Optical microscopy picture of the initially prepared emulsion (left) and of aqueous suspension of quercetin particles obtained by
38
39
Figure 5: Example for multimodal particle size distribution with Pluronic L64: experimental run 5 indicated by red, experimental run 5 indicated by green.
0 1 2 3 4 5 6
0,01 0,1 1 10 100 1000 10000
V
o
lu
me
p
e
rc
e
n
t
Particle size [µm]
Experimental run 5
40
41
Figure 7: Final particle size distribution of SFEE treated emulsions prepared with lecithin, according to volume percent and number percent
42
Figure 8: TEM micrographs of particles obtained after SFEE treatment of quercetin emulsion prepared with lecithin: Experimental run 1 of Table 4 (A), Experimental run 8 (B), Experimental run 9 (C) and centrum point run without quercetin (D).
A
B
43
44
Figure 10: Stability of quercetin suspensions
45
Figure 11: FTIR spectra of pure quercetin, pure lecithin, quercetin – lecithin physical mixture, Standard Run 1
380 880
1380 1880
2380 2880
3380 3880
T
ran
sm
ittan
ce
[
%]
Wavelenght cm-1 Quercetin
Lecithin
Querceitn/Lecithin=1/75
46
Figure 12: X-Ray diffraction spectra of pure lecithin, quercetin – lecithin physical mixture, Experimental run 1 and 8
0 500 1000 1500 2000 2500 3000 3500
4 14 24 34 44 54 64
In
ten
sity
2 θ Quercetin/Lecithin=1/75
Lecithin
Standard Run 1
47

![Figure 1: Chemical structure of quercetin [5]](https://thumb-us.123doks.com/thumbv2/123dok_es/5336103.716817/35.892.276.620.343.569/figure-chemical-structure-of-quercetin.webp)