Atmospheric Concentrations of PM10 and Radioisotopes in Air at Aldama, Mexico
14
0
0
Texto completo
(2) http://eventscribe.com/2013/AWMA/login.asp Password: AWMA2013. Atmospheric Concentrations of PM10 and Radioisotopes in Air at Aldama, Mexico Paper No 13217. Michel Y. Montelongo, Eduardo F. Herrera Research Center for Advanced Materials (CIMAV), 120 Miguel de Cervantes, Chihuahua Industrial Complex, ZIP 31109, Chihuahua, Chih.; México.. INTRODUCTION. The world population is constantly exposed to radiation through natural and anthropogenic sources, through processes which involve the use of radiation and radioactive substances, such as mining, energy production through combustion of coal, medicine, environmental pollution by radioactive wastes resulting from nuclear weapons testing and nuclear accidents on a large scale. This remains a comprehensive source of human exposure1.. The exploration of radioactive minerals in Mexico began in 1955, which was under the charge of the federal government agency called the Comisión Nacional de Energía Nuclear (National Nuclear Energy Commission) (CNEN) until 1972. Later in 1979, this was divided in the Instituto Nacional de Investigaciones Nucleares (National Institute for Nuclear Research) (ININ), the Comisión Nacional de Seguridad Nuclear y Salvaguardias (National Commision of Nuclear Safety and Safeguards) and Uranio Mexicano (URAMEX) created to develop the mining stage of the nuclear cycle (exploration, exploitation and processing of radioactive minerals), as mentioned Perea (1979)2. URAMEX by political and labor conflict was closed in accordance with the law in 1987, inheriting its functions of exploitation and profit to the Consejo de Recursos Minerales (Council of Mineral Resources, CRM), now tha Servicio Geológico Mexicano (Mexican Geological Service, SGM)..
(3) The first exploration of radioactive minerals in Mexico, focused on calcareous rocks. The mineral was first extracted en the Sierra Gomez, Chihuahua, to separate molybdenum ore from it, and the Comisión de Fomento Minero (Mining Development Commission) tested in a pilot plant installed a few hundred meters from the city of Aldama, Chihuaua. The uranium deposits located in the Peña Blanca Range, a municipality of Aldama, Chihuahua, are 85 km north of Chihuahua City. This range consists of a sequence of limestone, shale and sandstone of Palaeozoic and Cretaceous limestone, covered by volcanic rocks of acid composition of the Tertiary.. Based on the foregoing, we have the following objectives: estimating the activities of 238U radioisotopes, 232Th, 226Ra and 210Pb, deposited in the lifetime of the firm URAMEX (1979-1987), in order to determine the correlations between the concentrations of isotopes in PM10 and silts, and to establish equivalent doses of radiation to generate a map of isopleths around the plant and the city of Aldama and obtain the concentrations of radioisotopes used in this work. These concentrations will also serve as boundary and initial conditions for the CALPUFF program, with which dispersion and deposition of radioactive particles produced during the extraction of uranium can be estimated (Rood, 2008)3. Other isotopes of anthropogenic, natural and cosmogenic origin as 40K, 137Cs and 7Be, respectively, were also included in the analysis.. BACKGROUND. Materials and Methods. Three PM10 high-volume collectors4 were placed in specific locations in the city of Aldama in order to measure isotope concentrations in the air. The points were located in the upper part of the same plant of URAMEX, on the roof of City Hall and on the roof of a private home to form an almost isosceles triangle and thus cover the entire city (Figure 1). As can be seen in the same figure, the city area of 16 km2 was divided into 64 squares of 500 m from edge and in the vertices of the grid formed silt samples were taken between January and June 2011, before the rains that began in late June..
(4) WHATMAN glass-fiber filters (8 x 10 in.)5 were weighed and conditioned before and after the collection. The aerosol collection was performed following the timetable proposed by the EPA in 2011 every six days and the Mexican Official Standard NOM-035-ECOL-19936. The mud samples were collected and sieved according to ASTM method C136 and EPA7,8,9,10, with grains of up to 75 microns and deposited in polyethylene containers 5 x 5 cm diameter.. Concentration of uranium and thorium and the anthropogenic, natural and cosmogenic isotopes was calculated in both the PM10 collected as in the silts. For the case of the filters, PM10 was determined following the concentration method described in the Mexican Official Standard NOM035-ECOL-1993. Concentrations of the particles collected on the filters was determined in µg/m3 and were converted to milliBecquerel per cubic meter (mBq/m3). For the case of mud concentration was in Becquerel per kilogram (Bq/kg), based on the weight of the collected sample.. Both filters and silt samples were measured in a CANBERRA gamma spectrometer of 60 cm3 active volume and processed using the Spectrum Analyzer (SA-1997)11. The spectra obtained in measurements of filters and polyethylene cylindrical containers must be corrected for efficiency. The filters were folded into four parts, so that the geometry was completely atypical and had to resort to Monte Carlo modeling, using the EGS4-2007 program12. The same procedure and program was used to measure the silts containers.. We selected those isotopes present in the spectrum due to the Natural Radioactive Series 238U and 232 Th. To achieve the radioactive secular equilibrium, both samples were collected and deposited, in filters in the case of PM10, such as polyethylene containers mentioned for the case of the silt and thereafter were stored for at least one month.. Table 1 shows the isotope selected for the measurement of gamma lines. This table lists the daughter measured and its parent isotope, the energy of the gamma line that is measured, the period of semi-disintegration and the relative intensity (or branching ratio)..
(5) Table 1. Isotopes selected for the measurement of gamma lines. Daughter. Parent. 210. Eγ (keV). T(1/2). I γ (%). Pb. 238. 46.53. 22.3 y. 4.25. 226. Ra. 238. U. 186.21. 1600 y. 3.59. 212. Pb. 232. Th. 238.6. 10.6 (1.4 x10 10 y). 43.3. 214. Pb. 238. 241.9. 28.6 m. 7.43. 214. Pb. 238. U. 351.9. 28.6 m. 37.6. N/A. 477.6. 53.12 d. 10.52. Bi. 238. U. 609.3. 19.9 min (4.5 x 10³y). 46.1. Cs. N/A. 661.6. 30.07 y. 85.1. 214. Bi. 238. U. 1120.3. 19.9 min (4.5 x 10³y). 15.1. 40. K. N/A. 1460.8. 1.3 x10 9 y. 11. 7. U. U. Be. 214. 137. Results and Discussion. Concentration PM10 in filters To obtain the concentration of PM10 on filters measured every 6 days in 2011 and compared with the maximum permissible value according to Mexican Official Standard NOM-025-SSA1-199313 we can see that in the URAMEX Plant the maximum allowed value is exceeded only in the months of February, March, April, October and November when the wind speed is high, allowing the particles to be lifted off the ground, as it is located on the outskirts of the city and near a hill, where the streets are unpaved and motor traffic is reduced. For filters measured at City Hall, values were Figure 2. Graphic that compares the concentration of PM10 in the air on the 3 points sampled with the maximum allowed value in the Mexican Official Standard. Concentration PM 10 in Air 800 700 URAMEX Plant. 600 500. 300. Private Home. 200 Maximum Allowed Value. 100. 3-Dec. 17-Dec. 5-Nov. 19-Nov. 22-Oct. 8-Oct. 24-Sep. 10-Sep. 27-Aug. 30-Jul. 13-Aug. 2-Jul. Date. 16-Jul. 18-Jun. 4-Jun. 21-May. 7-May. 23-Apr. 9-Apr. 26-Mar. 12-Mar. 26-Feb. 12-Feb. 29-Jan. 0. 15-Jan. g/m. 3. City Hall 400.
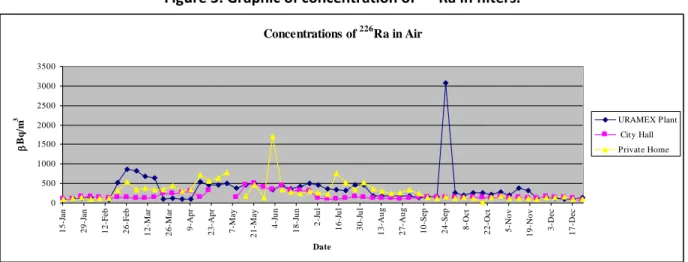
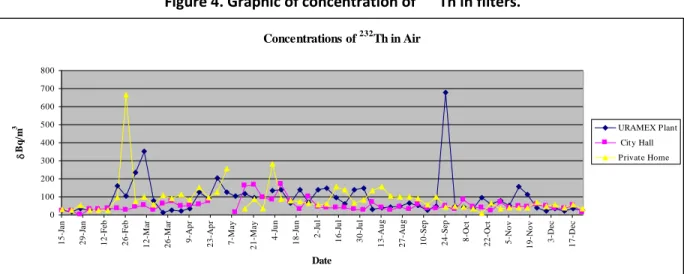
(6) found to exceed the standard in the same months as the URAMEX Plant and also in the months of May to July due perhaps to increased motor vehicle traffic, as it is located in the downtown where the streets are paved. In the private home location, it was discovered that more than half of the filters exceeded the value of the standard because it is located on the outskirts of the city, near the bank of materials from a company that manufactures ceramic floors also that the streets are unpaved. The concentration of PM10 in the filters of the three points and its comparison with the standard is shown in Figure 2. This figure also shows that the filters with higher particle concentration were measured in URAMEX Plant on October 18 with a value of 376 g/m3, at City Hall on November 5 with 265 g/m3 and in the private home on May 3 with 706 g/m3.. Due to high concentrations of airborne particles, especially at the point located in the private home, we need to start taking steps to mitigate them before they start having health problems in the younger population and in older adults. One recommendation is to pave city streets. It would also be important to begin to implement programs to reduce pollution from motor vehicle traffic.. Concentration of Radioisotopes in filters and silts. By analyzing the spectra of the filters was found that for the case of 226Ra values were higher in June 2 at the Private Home with 1701.75 Bq/m3 and September 24 in URAMEX with 3071.16Bq/m3 as seen in Figure 3. 226. Figure 3. Graphic of concentration of Concentrations of. 226. Ra in filters.. Ra in Air. 3500 3000 2500. Bq/m. 3. URAMEX Plant. 2000. City Hall 1500. Private Home. 1000 500. 17-Dec. 3-Dec. 19-Nov. 5-Nov. 8-Oct. 22-Oct. 24-Sep. 10-Sep. 27-Aug. 13-Aug. 30-Jul. 16-Jul. 2-Jul. 18-Jun. 4-Jun. 21-May. 7-May. 9-Apr. 23-Apr. 26-Mar. 12-Mar. 26-Feb. 12-Feb. 29-Jan. 15-Jan. 0. Date. In Figure 4 we can see that the highest concentration values of 232Th were in February 26 at Private Home with 664.17 Be/m3 and URAMEX in March 10 and September 24 with 352.74Bq/m3 and 680.26 Bq/m3 respectively..
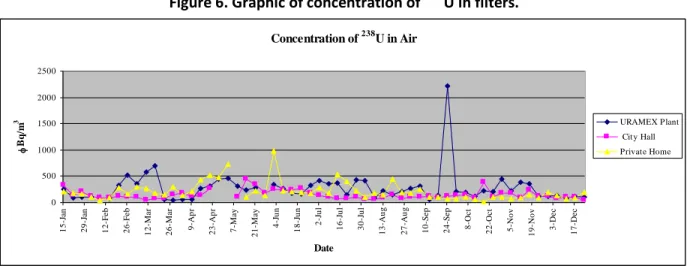
(7) 232. Figure 4. Graphic of concentration of. Th in filters.. Concentrations of 232Th in Air 800 700. Bq/m. 3. 600 500. URAMEX Plant. 400. City Hall. 300. Private Home. 200 100. 17-Dec. 3-Dec. 5-Nov. 19-Nov. 8-Oct. 22-Oct. 24-Sep. 10-Sep. 27-Aug. 13-Aug. 30-Jul. 16-Jul. 2-Jul. 18-Jun. 4-Jun. 7-May. 21-May. 9-Apr. 23-Apr. 26-Mar. 12-Mar. 26-Feb. 12-Feb. 29-Jan. 15-Jan. 0. Date. For the 7Be the highest values were found in URAMEX from February 26 to March 10 when its concentration reached the 36172.0 g/m3 as seen in Figure 5, coinciding with the time of year when the wind speed is higher and higher concentrations of particles were measured.. Figure 5. Graphic of concentration of 7Be in filters. Concentrations of 7 Be in Air 40000 35000. Bq/m. 3. 30000 25000. URAMEX Plant. 20000. City Hall. 15000. Private Home. 10000 5000. 3-Dec. 17-Dec. 19-Nov. 5-Nov. 8-Oct. 22-Oct. 24-Sep. 10-Sep. 27-Aug. 13-Aug. 30-Jul. 16-Jul. 2-Jul. 18-Jun. 4-Jun. 21-May. 7-May. 9-Apr. 23-Apr. 26-Mar. 12-Mar. 26-Feb. 12-Feb. 29-Jan. 15-Jan. 0. Date. For the 238U highest value was found in URAMEX in September 24 with 2214.26 g/m3 and at Private Home in June 2 with 978.68 g/m3 as shown in Figure 6..
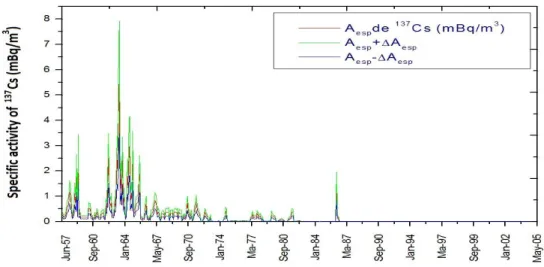
(8) Figure 6. Graphic of concentration of Concentration of. 238. 238. U in filters.. U in Air. 2500. Bq/m. 3. 2000 1500. URAMEX Plant. 1000. Private Home. City Hall. 500. 17-Dec. 3-Dec. 19-Nov. 5-Nov. 8-Oct. 22-Oct. 24-Sep. 10-Sep. 27-Aug. 13-Aug. 30-Jul. 16-Jul. 2-Jul. 4-Jun. 18-Jun. 7-May. 21-May. 9-Apr. 23-Apr. 26-Mar. 12-Mar. 26-Feb. 12-Feb. 29-Jan. 15-Jan. 0. Date. 137. Cs is a completely anthropogenic isotope found throughout the Earth from nuclear explosions at Hiroshima and Nagasaki. Since 1945, the amounts of this isotope is mainly due to a phenomenon known as fallout. Came to a content of 137Cs in the air around the 60’s because of nuclear tests in the United States, Russia, France and China. This can be seen in Figure 5 (Escudero and 2007)14.. Normally, the 137Cs is found in higher or lower concentrations in both air and ground, because once it is captured by the general circulation of the atmosphere from its original source, it spreads across the surface of the Earth, and returns to the air by wind drag. Because 137Cs, has a period of half-life of 30 years, may be present in any of the samples of PM10 or silts. The latest data showed that our laboratory with concentrations of 137Cs, before 2011, were due to accident Chernovil, whose activity in Chihuahua was 2.3 mBq/m3 in air..
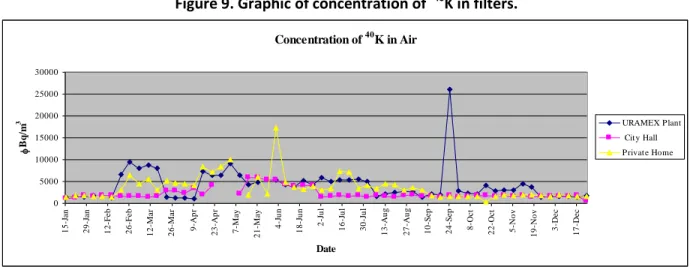
(9) Figure 7. Specific activity of 137Cs in the atmospheric air of Chihuahua since 1957.. By chance, measurements of PM10 and silts of this work were done during the year 2011, coinciding with the accident Fukushima, Japan on March 11. For this reason, we could see the increases in concentrations of this isotope in air in the Figure 8 were the maximum value is in March 28 in the 3 points reaching measured 31.47 mBe/m3 in the Private Home which means that the Fukushima accident released more radioactive material than Chernobyl. Figure 8. Graphic of concentration of Concentration of. 137. 137. Cs in filters.. Cs in Air. 35 30 25. mBq/m. 3. URAMEX Plant. 20. City Hall 15. Private Home. 10 5. 17-Dec. 3-Dec. 238. 19-Nov. 5-Nov. Th and. 8-Oct. 22-Oct. 24-Sep. 10-Sep. 27-Aug. 13-Aug. 30-Jul. 16-Jul. 2-Jul. 18-Jun. 4-Jun. 21-May. 7-May. 9-Apr. 23-Apr. 26-Mar. 12-Mar. 26-Feb. 29-Jan. 12-Feb. 15-Jan. 0. Date. In the Figure 9 we can see that 40k behaves very similar to determine that radioisotopes are related.. 226. Ra,. 232. U so that we could.
(10) Figure 9. Graphic of concentration of. 40. K in filters.. 40. Concentration of K in Air 30000 25000 20000. Bq/m. 3. URAMEX Plant. 15000. City Hall Private Home. 10000 5000. 17-Dec. 3-Dec. 19-Nov. 5-Nov. 8-Oct. 22-Oct. 24-Sep. 10-Sep. 27-Aug. 13-Aug. 30-Jul. 16-Jul. 2-Jul. 4-Jun. 18-Jun. 7-May. 21-May. 9-Apr. 23-Apr. 26-Mar. 12-Mar. 26-Feb. 12-Feb. 29-Jan. 15-Jan. 0. Date. The results of the values of the specific activities (Bq/kg) in each of the 81 vertices sampled were processed using the Surfer V8 200215. Using the values of the isotopic concentration isopleths, we can take an idea of how they were producing dispersions of the material during the uptime of the plant and throughout the period since the year 1987.. Although 10 lines were measured we only showed the results of isotope of uranium for the interest of the work in modeling the emissions in the years when the plant was active and interesting and surprising result of alterations of 137Cs in air.. The values of uranium concentrations in the plant indicate that there was a shift in the material, and therefore of radioactive contamination to the northwest of the plant. Research indicates that once the plant was closed, cleansed tanks or storage hoppers, where they carried out the separation process of the minerals of interest. This cleaning is done with pressure water hoses, so that all contaminated material and dissolved, ran towards areas of lower plant height, resulting in stagnation, later, the wind was in charge of spreading throughout the city. Figure 10 shows as it is distributed specific activity of uranium in the areas surrounding the plant. The specific activity values can reach nearly 2000 Bq/kg in the northwest to the entrance of the plant. Only a few hundred meters from the plant begins the city. All dimensions are decreasing in height towards the direction of Chuviscar River..
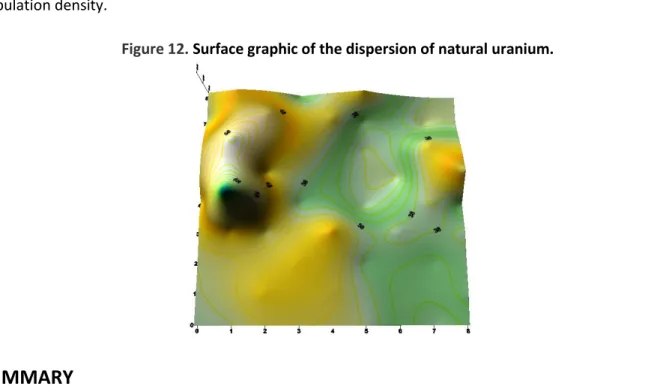
(11) Figure 10. Dispersion of pollutants in the grounds of the plant today.. The overall analysis for the entire city of Aldama shows that higher concentrations of uranium eventually flowed into the region Chuviscar River at the entrance to the city, but the specific activity decreases rapidly in Becquerel per kilogram thousands of dozens. This has been proven in previous works (Colmenero, L. 2004)16. As can be seen in Figure 11. The concentration values can reach nearly 100 Bq/kg in the upper right of the figure just seen some increases in the road leading to the mining areas of extraction of the material. Figure 11. Dispersion of natural uranium on the city of Aldama.. Figure 12 shows more representative values corresponding surface of the material to higher activities. Meteorological data recorded at stations of the Municipal Board of Water and Sanitation indicate that the annual average wind in the area southwest. This coincides with the.
(12) great mass of pollution have been moving toward the northwest of the city where the greatest population density. Figure 12. Surface graphic of the dispersion of natural uranium.. SUMMARY It can be concluded that the composition of the particles measured in the City Hall is determined more by the combustion of vehicles that the presence of radioisotopes. In URAMEX and at Private Home is more important the presence of radioisotopes in the particles presents in the air because its composition is determined by the soil and weather conditions of the place. The most interesting result is the increase in the concentration of Fukuchima.. 137. Cs after the accident of. ACKNOWLEDGMENTS. We thank the authorities of the City Hall of the City of Aldama, and the owners of the private home for allowing placing high-volume collectors in their facilities. It is also recognized CIMAV’s technical staff for helping the sampling filters and silt..
(13) REFERENCES. 1 2. 3. 4 5 6. 7 8. 9 10 11 12 13. 14 15 16. ONSCEAR "Report of the United Nations Scientific Committee on the Effect of Atomic Radiation to the General Assembly, Exposure from Natural Radiation Sources"., NY, 2008. Perea Saenz, A. Explotación del yacimiento uranífero el "Nopal 3" Sierra Peña Blanca Mpio. de Villa Aldama, Estado de Chihuahua. Tesis de Ingenieria. Facultad de Ingenieria. Universidad Autonoma de Chihuahua. Chihuahua, Mex.1979. Arthur S. Rood, Paul G. Voilleque, Susan K. Rope, Helen A. Grogan, John E. Till. Reconstruction of atmospheric concentrations and deposition of uranium and decay products released from the former uranium mill at Uravan, Colorado. Journal of Environmental Radioactivity 99 (2008) 1258–1278. USEPA RFPS-1287-063 Graseby Andersen/GMW Model 1200 High-Volume Air Sampler.2001. WHATMAN. Leadership in separation technology for the life sciences. http://www.whatman.com/products/?pageID=7.30, 2005. NOM-035-ECOL-1993 que Establece los métodos de medición para determinar la concentración de partículas suspendidas totales en el aire ambiente y el procedimiento para la calibración de los equipos de medición. C136 - 06 Standard Test Method for Sieve Analysis of Fine and Coarse Aggregates, 2012. EPA. Environmental Protection Agency. Method IO-2.2: Sampling of Ambient Air for PM10 Using an Andersen Dichotomous Sampler. Compendium of Methods for the Determination of Inorganic Compounds in Ambient Air. Office of Research and Development. US, 1999. EPA Environmental Protection Agency. 1993. Procedures for Laboratory Analysis of Surface/Bulk Dust Loading Samples. AP-42, Appendix C.2.E.U. EPA Environmental Protection Agency. 1993. Procedures for Sampling Surface/Bulk Dust Loading. AP-42, Appendix C.1. E.U. J. Perdomo, C. Trápaga. Programa Spectrum Analyzer. Tesis de Licenciatura. ISCTN, 1997. EGS4 Source Code Availability and Distribution. 2007. NOM-025-SSA1-1993 Criterios para evaluar el valor límite permisible para la concentración de material particulado. Valor límite permisible para la concentración de partículas suspendidas totales PST, partículas menores a 10 micrómetros PM10 y partículas menores de 2.5 micrómetros PM2.5 de la calidad del aire ambiente. Criterios para evaluar la calidad del aire. Escudero Y. Obtención de las concentraciones históricas de 137Cs en la ciudad de Chihuahua utilizando el 7Be como trazador. Tesis de Maestría, CIMAV, 2007. SURFER Version 8, Surface Mapping System. Golden Software Inc. 2002. L. Colmenero Sujo, M.E. Montero Cabrera , L. Villalba ,M. Renterıa Villalobos, E. Torres Moye a, M. Garcıa Leon c, R. Garcıa-Tenorio, F. Mireles Garcıa E.F. Herrera Peraza, D. Sanchez Aroche. Uranium-238 and thorium-232 series concentrations in soil, radon-222 indoor and drinking water concentrations and dose assessment in the city of Aldama, Chihuahua, Mexico. Journal of Environmental Radioactivity 77 (2004) 205–219..
(14) KEYWORDS. PM10, natural radioisotope, cosmogenic radioisotope, anthropogenic radioisotope, filters, silts, health problems..
(15)
Figure

+5

Documento similar