Magnetic and structural characterization of mechanically alloyed Fe 50 Co 50 samples
7
0
0
Texto completo
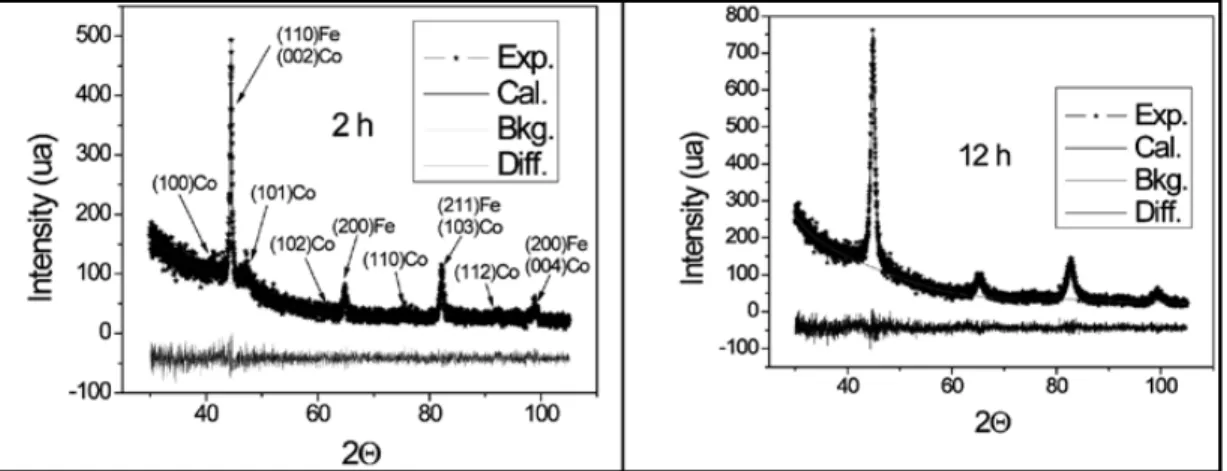
(2) inductors, magnetoelectronic devices [3, 4] and remotely operated magnetoelastic sensors [5]. The optimization of the RF properties of these materials requires the control of theirdesaturation effective anisotropy and resistivity which can be Revista Ciencias magnetization, G. Pérez, L. Zamora, J. Marco, J. Romero, J. González and F. Palomares achieved by modifying their nanostructure and phase distribution. Taking into account that mechanical alloying (MA) is one of the most adequate methods to produce nanostructured metallic alloys, there has been a significant interest in producing FeCo alloys by MA [6-12]). In general, it seems that MA gives place to disordered FeCo solid solutions by diffusion of Co in the BBC Fe lattice [7]. However, more than a decade ago, Collins et al. [8] stated that FeCo forms by a direct reaction of Fe and Co grains at their interfaces. More recently, Moumeni et al. [11] have shown evidence for the formation of dilute Fe solutes in the Co matrix at very short milling times. Also they showed that after 12h the HCP-Co completely dissolves inside the α-Fe matrix to form the BCC-FeCo alloy with crystallite size of 12 nm. The aim of the present work is to study the evolution of the nanostructure, phase distribution and magnetic properties of the equiatomic Fe 50Co50 alloy prepared by MA using different milling times. 2 Experimental Fe and Co elemental powders with purity better than 99.9% were mixed at the equiatomic (Fe50Co50) proportion and mechanically alloyed in a planetary ball mill for 0.5, 2, 4, 8, 12, 24 and 48 h, using a ball mass to powder mass ratio of 15:1. The balls diameter is 10 mm and they and the jails are of stainless steel. The used angular velocity was 280 rev/min. The prepared samples were characterized by XRD, MS and XPS at room temperature (RT). The XRD data were recorded using Cu K radiation and Si standards as internal references and the obtained patterns were refined by the Rietveld method using the GSAS program [13]. Mössbauer spectra were recorded at room temperature using a constant acceleration spectrometer and the isomer shifts referred to the centroid of the spectrum of α-Fe at room temperature. XPS data were recorded with a SPECS Phoibos 150 electron hemispherical spectrometer and a Delay Line Detector in the 9 segments mode, using Mg K radiation, under a vacuum better than 8x10⁻¹⁰ mbar. Wide scan and core level spectra were acquired at constant pass energies of 40 and 20 eV, respectively. 3 results and discussion The XRD data recorded from the powders milled for t=0.5, 2, 4 and 8 h showed the coexistence of Fe BCC and Co HCP phases (Fig.1, left, displays a representative example). However, for the powders milled for t=12, 24 and 48 h the XRD data only showed peaks belonging to a BCC phase (see Figure 1, right). The measured lattice parameter of this BCC phase decreases gradually from 2.867 Ả for the samples milled in the range t=0.5-4 h, down to 2.856 Ả for the 48 hours milled sample. This decrease in the lattice parameter value might reflect the continuous substitution of Fe by Co atoms in the BCC lattice of Fe. From the Rietveld refinement of the patterns it was possible to obtain the mean structural coherence length along two directions (parallel and perpendicular to the incident x-rays direction) which gives an idea of the average anisotropy of the grains present in the samples. For the BCC phase these mean grain size values are nearly the same, showing their isometric nature, with grain sizes decreasing from 50 nm for the 0.5 hours milled sample down to 12 nm for the 8 hours milled one (for longer milling times the grain dimensions remained nearly constant). The grains of the HCP phase changed in shape as the milling process progresses, going from a prolate ellipsoid (with approximate dimensions 30 xpatterns 7 nm)offor the shorter milling Figure of 1 XRD samples milled during 2 andtimes 12 h. to an oblate shape (with dimensions 2 x 20nm) in the sample milled for 8 hours going through an isometric grain shape for a milling time of 4 hours (with an approximate diameter of 20 nm). This 42 disappears after 8h milling. phase The RT Mössbauer spectra recorded from the different milled samples are shown in.
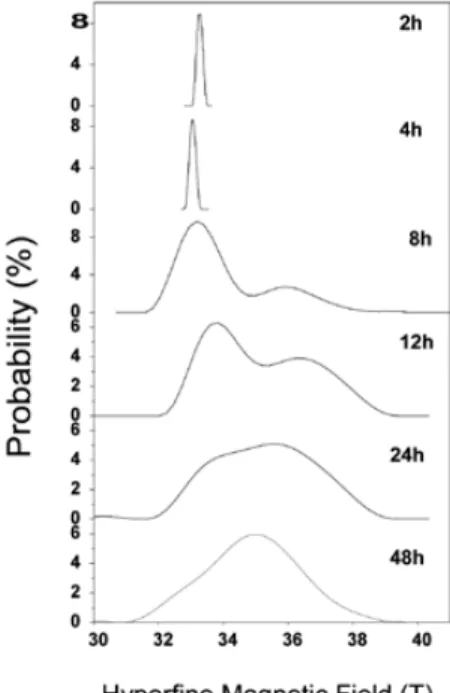
(3) The XRD data recorded from the powders milled for t=0.5, 2, 4 and 8 h showed the coexistence of Fe BCC and Co HCP phases (Fig.1, left, displays a representative Magnetic and structural characterization of mechanically alloyed fe co50 samples example). However, for the powders milled for t=12, 24 and 48 h the XRD50 data only showed peaks belonging to a BCC phase (see Figure 1, right). The measured lattice parameter of this BCC phase decreases gradually from 2.867 Ả for the samples milled in the range t=0.5-4 h, down to 2.856 Ả for the 48 hours milled sample. This decrease in the lattice parameter value might reflect the continuous substitution of Fe by Co atoms in the BCC lattice of Fe. From the Rietveld refinement of the patterns it was possible to obtain the mean structural coherence length along two directions (parallel and perpendicular to the incident x-rays direction) which gives an idea of the average anisotropy of the grains present in the samples. For the BCC phase these mean grain size values are nearly the same, showing their isometric nature, with grain sizes decreasing from 50 nm for the 0.5 hours milled sample down to 12 nm for the 8 hours milled one (for longer milling times the grain dimensions remained nearly constant). The grains of the HCP phase changed in shape as the milling process progresses, going from a prolate ellipsoid (with approximate dimensions of 30 x 7 nm) for the shorter milling times to an oblate shape (with dimensions 2 x 20nm) in the sample milled for 8 hours going through an isometric grain shape for a milling time of 4 hours (with an approximate diameter of 20 nm). This phase disappears after 8h milling. The RT Mössbauer spectra recorded from the different milled samples are shown in Fig. 2. The spectra of the samples milled for 2 and 4h are characteristic of pure -Fe. The spectrum corresponding to the sample milled for 8 h shows two magnetic components: one which is characteristic of -Fe (66%) and a second magnetic component (34%) with parameters =0.05 mms-1, 2=0.01 mms-1 and H=35.7 T. The Mössbauer parameters of this latter component and the increase in broadening of the spectral lines strongly support the formation of a disordered Fe-Co solid solution [10]. The positive isomer shift (0.05 mms-1) of this component and a field higher than 33.0 T, indicates that the formation of the solid solution occurs via the diffusion of Co atoms into the BCC Fe lattice [11]. The lower field component in the spectrum corresponding to the sample milled for 12 h has a hyperfine field (33.9 T) which is higher than that characteristic of -Fe. This indicates that the corresponding phase is no longer pure iron but a bcc phase containing more Co atoms [11]. This correlates well with the XRD results which did not show any pure Co contribution in the sample milled for 12 h. The other component corresponds to the disordered Fe-Co solid solution. The spectra corresponding to the samples milled for 24 and 48h are quite broad and when they are fitted with two sextets we obtain a component with a lower field of 34.6 T (that we associate with equiatomic Fe50Co50) and a component with a higher field of 36.3 T which we associate with a Fe-rich Fe-Co solid solution [8,11,12]. The lower field component represents about 72% of the total spectral area in the spectrum of the sample milled for 48h. Since the spectra are quite broad it seems also appropriate to fit them using hyperfine magnetic field distributions which is a method widely used in the literature. The corresponding distributions are presented in Figure 3. We observe that the distributions corresponding to the samples milled for 2 and 4 h are quite narrow and centred around 33.0 T, which is the value characteristic of pure iron. The distributions corresponding to the samples milled for 8, 12 and 24 h are broad and clearly bimodal with a first maximum that shifts from 33.4 T (t=8h) to 34.0 T (t=24h) and decreases in intensity with increasing milling time and a second maximum centred around 36.4 T for the samples milled for 8 and 12 h that shifts to 35.8 T in the sample milled for 24 h. The results indicate that between t=8 and 24 h the sample has a heterogeneous composition, compatible with the presence of different Fe environments. The lower field component 43 might correspond to 2011 Fe atoms in a local Co-rich environment while the higher field Volumen 15, diciembre component might correspond to Fe atoms in a more Fe-rich local environment [8]. After 48 h of milling the sample presents a more homogeneous composition showing an.
(4) centred around 33.0 T, which is the value characteristic of pure iron. The distributions corresponding to the samples milled for 8, 12 and 24 h are broad and clearly bimodal with a first maximum that shifts from 33.4 T (t=8h) to 34.0 T (t=24h) and decreases in Revista de Ciencias G. Pérez, L. Zamora, J. Marco, J. Romero, J. González and F. Palomares intensity with increasing milling time and a second maximum centred around 36.4 T for the samples milled for 8 and 12 h that shifts to 35.8 T in the sample milled for 24 h. The results indicate that between t=8 and 24 h the sample has a heterogeneous composition, compatible with the presence of different Fe environments. The lower field component might correspond to Fe atoms in a local Co-rich environment while the higher field component might correspond to Fe atoms in a more Fe-rich local environment [8]. After 48 h of milling the sample presents a more homogeneous composition showing an almost symmetric hyperfine magnetic field distribution with the maximum located at H=34.9 T and an average hyperfine field of 35.3 T. These values are compatible with the formation of an equiatomic disordered FeCo solid solution and are very similar to those reported in the literature for samples produced by MA (reported average values are around 34.7T-35.2T) [7, 10-11] We would also mention that the spectra recorded from the samples milled for t=12, 24 and 48 h show a small paramagnetic contribution (<3%). Since the spectra are quite broad there is a large uncertainty in the determination of its Mössbauer parameters but it seems plausible to associate this phase to the formation of a parasite oxide formed during prolonged milling times. At this respect it is interesting to note that the wide scan XPS spectra recorded from the samples milled for 12 and 24 h (not shown here for the sake of brevity) show significant surface oxygen and carbon contributions. Figure 4 shows the Co 2p and Fe 2p spectra recorded from the as-milled sample for 12 h after inelastic background substraction. The main Co 2p3/2 and Co 2p1/2 peaks are located at 781.8 eV and 797.3 eV respectively. These binding energy values and above all the existence of prominent “shake-up” satellites shifted ca. 5.5-6-0 eV from the main photoemission lines are consistent with the presence of a Co2+ phase [14]. The Fe 2p spectrum is broad and it was fitted considering Fe2+ (BE Fe 2p3/2=710.1 eV, Fe 2p1/2=724.2 eV) and Fe3+ (BE Fe 2p3/2=711.9 eV, Fe 2p1/2=726.4 eV) contributions. The peak located at 714.2 eV would account for the multiplet splitting contribution which is known to be associated to Fe3+ phases while the small peak or bump located at 716.2 eV would account for the Fe 2+ shake-up satellitespectra whichrecorded is known tofrom accompany the mainand photoemission Fe sextets. 2p 3/2 line of Figure 2 Mössbauer at RT the different samples fitted with discrete Fe2+ compounds [15]. The results suggest the native oxide layer formed on the as milled samples has a complex composition containing Co2+, Fe3+ and Fe2+ contributions. A. Figure 3 Hyperfine magnetic field distributions corresponding to the spectra shown in Fig. 2.. 44.
(5) H=34.9 T and an average hyperfine field of 35.3 T. These values are compatible with the formation of an equiatomic disordered FeCo solid solution and are very similar to those reported in the literature forstructural samplescharacterization produced by (reported average Magnetic and of MA mechanically alloyed fe50co50 values samples are around 34.7T-35.2T) [7, 10-11] We would also mention that the spectra recorded from the samples milled for t=12, 24 and 48 h show a small paramagnetic contribution (<3%). Since the spectra are quite broad there is a large uncertainty in the determination of its Mössbauer parameters but it seems plausible to associate this phase to the formation of a parasite oxide formed during prolonged milling times. At this respect it is interesting to note that the wide scan XPS spectra recorded from the samples milled for 12 and 24 h (not shown here for the sake of brevity) show significant surface oxygen and carbon contributions. Figure 4 shows the Co 2p and Fe 2p spectra recorded from the as-milled sample for 12 h after inelastic background substraction. The main Co 2p3/2 and Co 2p1/2 peaks are located at 781.8 eV and 797.3 eV respectively. These binding energy values and above all the existence of prominent “shake-up” satellites shifted ca. 5.5-6-0 eV from the main photoemission lines are consistent with the presence of a Co2+ phase [14]. The Fe 2p spectrum is broad and it was fitted considering Fe2+ (BE Fe 2p3/2=710.1 eV, Fe 2p1/2=724.2 eV) and Fe3+ (BE Fe 2p3/2=711.9 eV, Fe 2p1/2=726.4 eV) contributions. The peak located at 714.2 eV would account for the multiplet splitting contribution which is known to be associated to Fe3+ phases while the small peak or bump located at 716.2 eV would account for the Fe 2+ shake-up satellite which is known to accompany the main photoemission Fe 2p 3/2 line of Fe2+ compounds [15]. The results suggest the native oxide layer formed on the as milled samples has a complex composition containing Co2+, Fe3+ and Fe2+ contributions. A similar composition is also observed in the samples milled for 24 h, but a detailed analysis shows better defined line shape with sharper core level emissions which is a direct indication of higher degree of homogeneity in composition, oxidation states and atomic disorder. It is also worth mentioning that the Fe/Co atomic ratio in the samples milled for 12 h before Ar+ sputtering is 0.85 (that means that in this sample the native oxide layer is richer in Co than in Fe) while in the case of the sample milled for 24h the calculated Fe/Co ratio is 0.9. These values were determined from the quantitative analysis of Co 3p and Fe 3p emissions due to the presence of O(KLL) Auger transitions in the Co 2p and Fe 2p energy region. This fact causes some interference and makes it difficult to properly evaluate areas under the core level peaks. All these oxide contributions are totally removed after extensive Ar + ion bombardment and the corresponding Co, Fe 2p and 3p spectra only show peaks characteristic of metallic Co and metallic Fe in equiatomic proportion (Fe/Co1.0). 4 Conclusions The nanostructure, phase distribution and surface composition of equiatomic Fe50Co50 alloy prepared by MA at different milling times have been studied. The results have shown that Co starts diffusing into Fe after 8 h of milling. Between t=8h and t=24 h the sample has a heterogeneous composition, presenting a bimodal hyperfine field distribution with maxima centred at 34.3 T and 35.8-36.2 T which is compatible with the presence of different Fe environments (richer in Co and richer in Fe, respectively). After 48 h of milling the sample presents a more homogeneous composition showing an almost symmetric hyperfine magnetic field distribution centred at H=34.9 T, indicating that a disordered Fe50Co50 solid solution has been already formed. The XPS data indicate that the native oxide layer formed on the freshly milled samples contains Co 2+, Fe3+ phases. Fe2+ and Figure 4 Co 2p and Fe 2p core level XPS spectra recorded from the sample milled for 12 h. acknowledgements. Volumen 15, diciembre 2011. 45. The authors would like to thank the financial support given to this work by Colciencias (Colombian agency) and the Universidad del Valle. G.A.P.A., the.
(6) contributions are totally removed after extensive Ar + ion bombardment and the corresponding Co, Fe 2p and 3p spectra only show peaks characteristic of metallic Co and metallic Fe in equiatomic G. proportion (Fe/Co1.0). Revista de Ciencias Pérez, L. Zamora, J. Marco, J. Romero, J. González and F. Palomares 4 Conclusions The nanostructure, phase distribution and surface composition of equiatomic Fe50Co50 alloy prepared by MA at different milling times have been studied. The results have shown that Co starts diffusing into Fe after 8 h of milling. Between t=8h and t=24 h the sample has a heterogeneous composition, presenting a bimodal hyperfine field distribution with maxima centred at 34.3 T and 35.8-36.2 T which is compatible with the presence of different Fe environments (richer in Co and richer in Fe, respectively). After 48 h of milling the sample presents a more homogeneous composition showing an almost symmetric hyperfine magnetic field distribution centred at H=34.9 T, indicating that a disordered Fe50Co50 solid solution has been already formed. The XPS data indicate that the native oxide layer formed on the freshly milled samples contains Co 2+, Fe2+ and Fe3+ phases. acknowledgements The authors would like to thank the financial support given to this work by Colciencias (Colombian agency) and the Universidad del Valle. G.A.P.A., the Sabbatical Year Grant provided by the Spanish Science Ministery and the Universidad del Valle. references. [1] C. C. Suryanarayana, Bull. Mater. (1994). [1] Suryanarayana, Bull. Mater. Sci.Sci. 17 17 (4)(4) 307307 (1994). [2] E. Jartych, J. K. Zurawicz, D. Oleszack, and M. Pekala, Nanostruct. Mater. 12 927 [2] E. Jartych, J. K. Zurawicz, D. Oleszack, and M. Pekala, Nanostruct. Mater. 12 927 (1999). (1999). [3] K. Shirakawa, “Micro-inductors and transformers,” IEEE Transl. Journal on [3] K.Magnetics Shirakawa, “Micro-inductors and116–124, transformers,” in Japan, vol. 9, no. 3, pp. 1994. IEEE Transl. Journal on Magnetics in Japan, vol. 9, no. 3, pp. 116–124, 1994. [4] M. Yamaguchi et al., “Microfabrication and characteristics of magnetic thin-film inductors in the ultrahigh frequency region”, J. Appl. Phys., vol. 85, no. 11, pp. 7919–7922, 1999. [5]. K. H. Shin, M. Inoue, and K. I. Arai, “Strain sensitivity of highly magnetostrictive amorphous films for use in microstrain sensors,” J. Appl. Phys., vol. 85, no. 8, pp. 5465–5467, 1999.. [6]. Ch. Kuhrt and L. Schultz, J. Appl. Phys. 71 (4) 1896 (1992).. [7]. R. Brüning, K. Samwer, Ch. Kuhrt, and L. Schultz, J. Appl. Phys. 72 (7) 2978 (1992).. [8]. G. S. Collins and B. A. Meevens, Scripta Metall. Mat. 29 1319 (1993).. [9]. V. V. Tcherdynstev, S. D. Kaloshkin. I. A. Tomilin, E. V. Shelekhov, and Y. V. Baldokhin, Mater. Sci. Forum. 269/272 145 (1998).. [10] M. Sorescu and A. Grabias, Intermetallics 10 317 (2002). [11] H. Moumeni, S. Alleg, and J. M. Greneche, J. of Alloys and Comp. 386 12 (2005).. 46.
(7) Magnetic and structural characterization of mechanically alloyed fe50co50 samples. [12] A. Zelenáková, D. Oleksáková, J. Degmová, J. Kovác, P. Kollár, M. Kusý, and P. Sovák, J. Magn. Magn. Mater. (2007), DOI: 10.1016/j.jmmm.2007.03.005. [13] A. C. Larson and R. B. Von Dreele, “General Structure Analysis System (GSAS)”, Los Alamos National Laboratory Report LAUR 86-748 (2000). [14] J.F. Marco, J.R. Gancedo, J. Ortiz and J.L. Gautier, Appl. Surf. Sci. 227 175 (2004) [15] M. Gracia, J.F. Marco, J.R. Gancedo,W. Excel and W. Meisel, Surf. Interface Anal. 29 82 (2000). Author’s address Germán A. Pérez Alcázar Departamento de Física, Universidad del Valle, Cali – Colombia [email protected] Ligia Edith Zamora Departamento de Física, Universidad del Valle, Cali – Colombia [email protected] José Francisco Marco Instituto de Física-Química Rocasolano, Madrid - España [email protected] Juan José Romero Instituto de Magnetismo Aplicado, Madrid - España [email protected] Jesús María González Unidad Asociada ICMM-IMA, Madrid - España [email protected] Francisco Javier Palomares Instituto de Ciencia de Materiales de Madrid CSIC [email protected]. Volumen 15, diciembre 2011. 47.
(8)
Figure

Documento similar