CHARACTERIZATION OF NI CO CR POWDERS OBTAINED BY MECHANICAL ALLOYING
13
0
0
Texto completo
(2) XXII International Materials Research Congress 2013 NACE International Congress-Mexican Section. CHARACTERIZATION OF NI-CO-CR POWDERS OBTAINED BY MECHANICAL ALLOYING Abstract In the present study four compositions of a Ni base alloys were synthesized by mechanical alloying, the compositions were: Ni81Co10Cr9, Ni72Co20Cr8, Ni72Co10Cr18 and Ni64Co20Cr16. Elemental powders with purity higher than 99.5% were used and milled for 0,5,10 and 15h in a high energy Spex 8000 mill. The process control agent used was methanol and the ball to powder ratio was 5:1. Microstructural characterization after the milling process was done by X-ray diffraction technique, using a panalytical X´pert pro diffractometer with Cu Kα radiation (= 1.5406Å) and operated at 40 kV and 35 mA in the 2θ range of 20–110°, the powder morphology and chemical composition in each phase were carried out using a JEOL JSM-5800 scanning electron microscopy equipped with an energy dispersive spectrometer and a High resolution field transmission electron microscopy JEOL JSM2200Fs+CS, 200KV. The density of the powders decreases while the size is heterogeneous and showed an increase in the hardness at higher milling times, which is due to the accumulation of lattice strain introduced by the mechanical alloying process. The microstructure showed a Ni-Co matrix and a segregated dark phase Cr-rich.. Keywords: Mechanical alloying; NiCoCr, Characterization,. Página. 2.
(3) XXII International Materials Research Congress 2013 NACE International Congress-Mexican Section. Introduction NiCoCr alloys have been used in combination with addition of some others elements for high temperature applications, Ni is ideal for its use as a substrate because of the ability to form the Ni3Al (gamma prime) phase that increase its mechanical properties beyond the 800°C [1-3], these Ni base alloys are called oxide disperse strength (ODS) alloys and the core of the ODS processing technology is the milling process, in which metal powders are ball milled in dry, inert atmospheres, whereas not only a fine and homogeneous gamma prime dispersion but also the formation of a solid solution by mechanical alloying is desired[4]. Increasing Co content improves the phase stability and lowers the gamma prime solvus temperature, which allows a large processing temperature range and reduces the stresses induced by controlled cooling and quenching rate during heat treatment [5]. The Cr content is used to prevent early corrosion, since its forms a protective oxide scale in the form of Cr2O3 [6], this oxide scale is useful in bond coats applications for the gas turbines. The amount of Cr and Co used in this four combinations are between the limits of composition used in commercial high temperature Ni base alloys as PWA, RENE, INCOLOY, INCONEL, and some others [7].. Experimental Powders of Ni, Co and Cr with more than 99% purity and < 325 meshes were used as the starting materials to synthesize a Ni base solid solution composite. The powders were obtained by the Mechanical Alloying (MA) technique, which involves the use of a vial (made of D2 hardened steel). In order to diminish contamination from the vial to the powders it was subjected to a coating process consisting in a preliminary milling of a mixture of Ni, Co and Cr in a proportion similar to that of the compositions reported in this article. So, the milling media (balls) and the vial gets coated at the same time, Millings were performed in a high-energy ball mill (SPEX-8000) during 5,10, and 15h periods. A ball-to-powder weight ratio of 5:1 was used, being the weight of samples 8.4 g. The compositions were (Ni90Cr10)90Co10, (Ni90Cr10)80Co20, (Ni80Cr20)90Co10, and (Ni80Cr20)80Co20. As milling conditions, it was used and an inert argon atmosphere (to avoid oxidation) and 1 mL of methanol was added to the powders before the milling to act as a process control agent.. Página. 3.
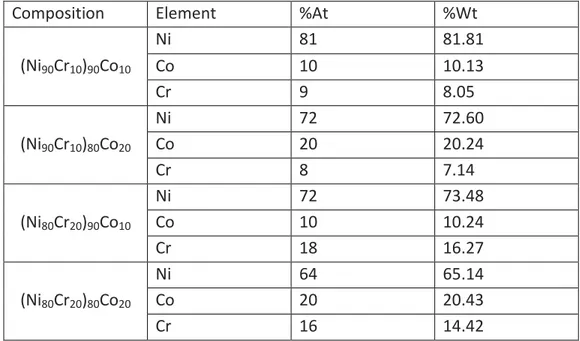
(4) XXII International Materials Research Congress 2013 NACE International Congress-Mexican Section. Fig 1. Ni-Co-Cr ternary diagram at 1200 C isothermal cut Table 1 presents the compositions used in the present work, and the Fig. 1 shows a ternary diagram at 1200 °C isothermal cut with the four compositions selected. The preparation of cross-section milled powders was carried by hot mounting the powders in bakelite and grinded with 800 to 2000 sandpaper. Then, the samples were polished with alumina 1 and 0.3 m to mirror appearance. X-rays diffraction (XRD) analyses were carried out in a Panalytical X'pertPRO diffractometer with Cu Kα radiation (λ=1.5406 Å) operated at 40 kV and 35 mA in the 2θ range of 20-110°. On the other hand, scanning electron microscopy (SEM) characterization was performed using a JEOL JSM5800-LV operated at 15 kV. Composition. Element %At %Wt Ni 81 81.81 (Ni90Cr10)90Co10 Co 10 10.13 Cr 9 8.05 Ni 72 72.60 (Ni90Cr10)80Co20 Co 20 20.24 Cr 8 7.14 Ni 72 73.48 (Ni80Cr20)90Co10 Co 10 10.24 Cr 18 16.27 Ni 64 65.14 (Ni80Cr20)80Co20 Co 20 20.43 Cr 16 14.42 Table1. Chemical composition of prepared powders Página. 4.
(5) XXII International Materials Research Congress 2013 NACE International Congress-Mexican Section. RESULTS AND DISCUSSION Morphology The fig. 2a exhibit the morphology of the initial raw powders showing Co spherical particles < 50 microns and Cr/Ni particles of 20 microns, the composition of these powders is more than 99.0% purity (checked by EDS analyses). With 5h milling time, the particle size is very irregular according to the micrographs of Fig. 2b. When the alloying process begin the first step is ruled by the micro forging of the powders, this mechanical deformation leads to the formation of a multi layered particles. The Fig. 2c presents micrograph of powders milled for 5h, it is noticeable the important proportion of particles > 50 microns, a mapping (Fig. 2c) shows the formation of true alloys by mixing processes of the precursors. Cold welding is predominant, since the particle size is still growing, with 10h of milling time there are plenty particles > 50 microns and it seems that the small particles are getting agglomerated (Fig. 2d). After 15h of milling time there are much less small particles since they have been welding and forming the big ones, and the big ones, reaching an homogeneous size (Fig. 2e). Fig. 2a. (Ni90Cr10)90Co10 0h milling time powders. Fig. 2b. (Ni90Cr10)90Co10 5h milling time powders. Página. 5.
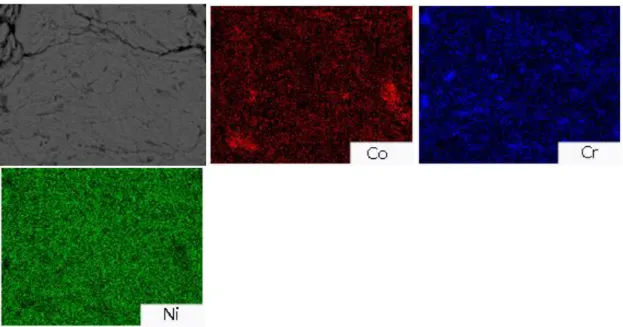
(6) XXII International Materials Research Congress 2013 NACE International Congress-Mexican Section. Fig. 2c. Cross section of a multilayered powder particle of (Ni90Cr10)90Co10 5h milling time composition: Ni-green, Co-red, Cr-blue.. Fig. 2d. (Ni90Cr10)90Co10 10h milling time powders. Fig. 2e. (Ni90Cr10)90Co10 15h milling time powders. Página. 6.
(7) XXII International Materials Research Congress 2013 NACE International Congress-Mexican Section. XRD analysis XRD analysis is used to obtain crystallographic information, in more advanced analysis can be obtained quantitative phase information, in the present study XRD analysis is used to determine crystal size, lattice strain and solid solution formation, the software powdercell was used to determine the position of the characteristic peaks of pure elements according to the SPDS crystallographic tables Ni (01-071-4654), Co (01-089-7373) and Cr (00-0011250) , the software confirmed that simulated peaks corresponds to the actual position of the simulated elemental characteristics peaks, the next step was identify this peaks in the corresponding XRD spectra. Unmilled samples showed the characteristics peaks of three elements but Co and Cr peaks are difficult to distinguish because of their low reflection and overlapping with Ni peaks. Peaks present in these spectra are showed in a zoom area of the simulation spectrum in Fig. 3a, 3b, 3c.. Fig. 3a. Co characteristic peaks and corresponding information about the structure.. Página. 7.
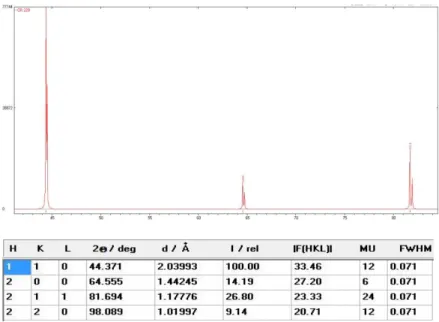
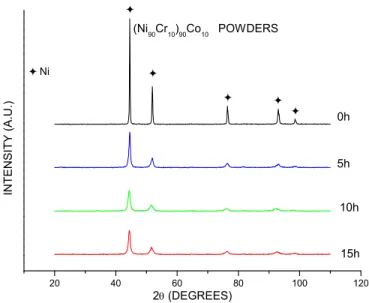
(8) XXII International Materials Research Congress 2013 NACE International Congress-Mexican Section. Fig. 3b. Cr characteristic peaks and the corresponding information about the structure.. 20. 25. 30. 35. 40. 45. 50. 55. 60. 65. 70. 75. 85. 90. 95. 107.11. 98.38. 92.42. 94.56. 90.45. 81.35. 80. 84.05. 75.87. 0. 64.30. 62.51. 41.58. 65913. 51.83. CO 33.3% CR 229 33.3% N I225 33.3%. 47.43. 131826. 44.4744.21. .. 100. 105. Fig. 3c. Ni-Co-Cr simulated peaks in powder cell 2.4. After 5 h of milling time, the Ni characteristic peaks was not shifted but the peak has already decreased in intensity and has become wider revealing that the crystal size has decreased (Fig. 4). From this spectra, we can extract the crystal size and the lattice strain using the Williamson-Hall method [8], plotting crystal size information versus lattice strain (Fig. 6), after this process it is possible to determine how the crystal size decreases while the lattice strain increases (Fig.5)[9]. The Ni characteristic peaks shifted to the left with 10 and 15h of milling time, this is evident from the interplanar distance calculated using the Bragg equation[10], this shifting evidences dissolution of the alloy elements into the Ni lattice. Therefore, the lattice parameter of nickel increases[11], due diffusion of the Co and Cr elements into Ni structure and the formation of a Ni-based solid solution phase. [12].. Página. 8.
(9) XXII International Materials Research Congress 2013 NACE International Congress-Mexican Section. . (Ni90Cr10)90Co10 POWDERS Ni. . INTENSITY (A.U.). . . . 0h. 5h. 10h. 15h 20. 40. 60. 80. 100. 120. 2 (DEGREES). Fig. 4. XRD spectra of (Ni90Cr10)90Co10 samples at several milling times. 1.5 1.4 1.3 1.2 1.1. Equation Adj. R-Square. (Ni90Cr10)90Co10 POLVOS. y = a + b* 0.83219. 0.7714 Value. 0.72348. 15h. 0.845. Standard Error. B. Intercept. 0.0922. 0.05293. B. Slope. 0.3782. 0.09493. D. Intercept. 0.1889. 0.1778. D. Slope. 1.0632. 0.31874. F. Intercept. 0.2364. 0.29633. F. Slope. 1.5878. 0.53379. H. Intercept. 0.0105. 0.26152. H. Slope. 1.9623. 0.47055. 10h. cos. 1.0. 5h. 0.9 0.8 0.7 0.6 0.5 0.4. 0h. 0.3 0.2 0.35. 0.40. 0.45. 0.50. 0.55. 0.60. 0.65. 0.70. 0.75. sen. Fig. 5 (Ni90Cr10)90Co10 powders Williamson-Hall plot. Página. 9.
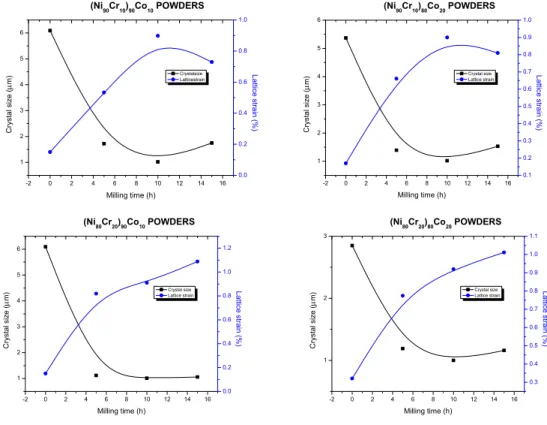
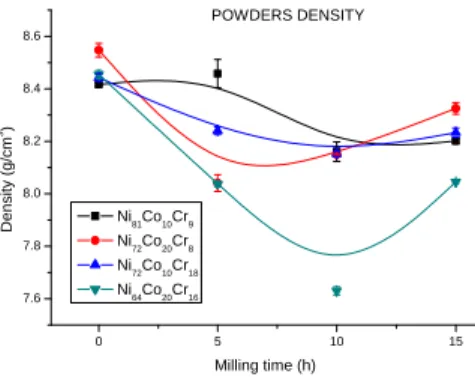
(10) XXII International Materials Research Congress 2013 NACE International Congress-Mexican Section. (Ni90Cr10)90Co10 POWDERS. (Ni90Cr10)80Co20 POWDERS 1.0. 6. 0.8. 5. 1.0. 6. 0.9 0.8. 0.6. 3. 0.4. 2. Crystal size (m). 4. 0.7. Crystal size Lattice strain. 4. 0.6 3. 0.5 0.4. 2 0.3. 0.2. 0.2. 1. 1 0.0 -2. 0. 2. 4. 6. 8. 10. 12. 14. 0.1 -2. 16. 0. 2. 4. 6. 8. 10. 12. 14. 16. Milling time (h). Milling time (h). (Ni80Cr20)90Co10 POWDERS. (Ni80Cr20)80Co20 POWDERS 1.2. 5. 1.0. 0.8. 0.6 3 0.4. 0.9 Crystal size Lattice strain. 2. 0.8 0.7 0.6 0.5. Lattice strain (%). Crystal size Lattice strain. 1.1 1.0. Crystal size (m). 6. Lattice strain (%). Crystal size (m). 3. 4. Lattice strain (%). Crystalsize Latticestrain. Lattice strain (%). Crystal size (m). 5. 2. 1. 0.4. 0.2 1. 0.3 0.0 -2. 0. 2. 4. 6. 8. 10. Milling time (h). 12. 14. 16. -2. 0. 2. 4. 6. 8. 10. 12. 14. 16. Milling time (h). Fig. 6 Crystal size versus lattice strain As the milling time increase the slope of the Williamson-Hall plot increases too (with positive slope) this means that the amount of structural defects that are being introduced into the samples is higher as the milling time increases. The Williamson-Hall method assumes that all broadening of the peaks is mainly to the crystal size and a strain effect, In order to minimize the measurements error, exists an instrumental error from diffractometer which must be corrected, this is reduced running a standard powder under the same conditions and making an algebraic difference between the experimental and the standard peak[11], obtaining the size component from the intercept of Bcosθ versus sinθ and the strain component from the slope (fig. 5). It is noticeable that crystal size of original material decreases in a couple of hours to the nanometric size with milling. Powder density was calculated using a gas pycnometer, The results shows a decrease in density of milled powders with 10h of milling, following of an increase of this property after 15h of processing (fig. 6), The initial density is higher because the initial powders have regular shapes but as the welding process began to control de particle size, the shape of these powders becomes more irregular so the compaction gets difficult, so the density level is lower compared with initial sample. After the first 10h of milling time fracture stage dominates and big particles began to decrease, simultaneously small Página. 10.
(11) XXII International Materials Research Congress 2013 NACE International Congress-Mexican Section. particles began to agglomerate, so particles with different sizes get a homogeneous size, particle shapes become rounded, decreasing the free space among them, so the density increases. POWDERS DENSITY 8.6. 3. Density (g/cm ). 8.4. 8.2. 8.0. Ni81Co10Cr9 Ni72Co20Cr8. 7.8. Ni72Co10Cr18 Ni64Co20Cr16. 7.6 0. 5. 10. 15. Milling time (h). Fig. 6 Density of powders as a direct function of milling time. Powders hardness increases with milling time to 15h milling time (Fig. 7), this behavior is caused by the introduction of plastic deformation as a result of the use of the MA technique [13]. Micro welding process takes the relatively soft powder (ductile) and increases its lattice strain as long as it is being cold worked until it gets saturated. Once saturated, its hardness achieves to a maximum value [13]. While the characteristic peaks of pure powders detected by XRD disappear, resulting in the formation of true alloy. Another reason to this hardness increase may be the formation of a solid solution with a crystal structure harder than pure elements. It is well known the most of the pure metals exhibit better mechanical properties with the presence of small amount of other elements [14] POWDERS MICROHARDNESS. 800. 700. Microhardness (HV). 600. 500. Ni81Co10Cr9. 400. Ni72Co20Cr8 Ni72Co10Cr18. 300. Ni64Co20Cr16 200. 100 0. 5. 10. 15. Milling Time (h). Fig. 7 Microhardness in function of the milling time. Página. 11.
(12) XXII International Materials Research Congress 2013 NACE International Congress-Mexican Section. Conclusions With an increase in the milling time a solid solution can be achieved, the amount of Co and Cr that can be dissolved in the Ni matrix will depend in the solubility of this element and the affinity, as can be seen the Co and Ni have a total solubility but the Cr tends to form isolated dark phases seen with backscattered electrons, also in the highest magnifications can be found this isolated phase, the presence of this phase is also responsible for the micro hardness increase, in low milling time the segregation of this phase wakes the bulk hardness but once it is well distributed the overall properties of the bulks are increased.. References [1] S.C. Deevi, V.K. Sikka, Intermetallics 4 (1996) 357–375. [2] D.P. Pope, S.S. Ezz, Int. Mater. Rev. 29 (1984) 136–167. [3] C. Suryanarayana, Prog. Mater. Sci. 46 (2001) 1–184. [4] J.S. Benjamin: Sci. Am., 1976, vol. 234, pp. 40-48. [5] R. Jarrett, J. Tien, Metall. Mater. Trans. A 13 (1982) 1021. [6] Michael schutze .1997. Protective oxide scales and their breakdown. Wiley and the institute of corrosion, England. [7] Roger C. Reed, the superalloys fundamentals and applications. Cambridge university press, New York, USA.pp27. [8] Martinez V. et al. Evolucion del tamaño nanocristalino en aleaciones Cu-Mo por medio de aleado mecanico, congreso CONAMET/SAM 2004. [9] C.L. Chen, Y.M. Dong, Effect of mechanical alloying and consolidation process on microstructure and hardness of nanostructured Fe-Cr-Al ODS alloys, materials science and engineering A528 (2011) 8374-8330. [10] B.D. Cullity, Elements of x-ray diffraction, Addison-Wesley publishing company, inc. pp95. Página. 12.
(13) XXII International Materials Research Congress 2013 NACE International Congress-Mexican Section. [11] M.N. Samani et. al. Production of a nanocrystalline Ni3Al-based alloy using mechanical alloying, Journal of Alloys and Compounds 500 (2010) 30–33. [12] C. Suryanarayana, Mechanical alloying and milling, mechanism of alloying, Prog. Mater. Sci. 46 (2001) 1–184. [13] H. Zuhailawati, Y Mahani, Effects of milling time on hardness and electrical conductivity of in situ Cu-NbC composite produced by mechanical alloying, Journal of alloys and compounds 476 (2009) 142-146. [14] Aluminum: The Element of Sustainability, The Aluminum Association, September 2011.. Página. 13.
(14)
Figure


+5
Documento similar
obtained, multivariate curve resolution – alternating least squares (MCR-ALS) can be used to resolve the species present in a sample to obtain the spectra and the
reaction yield is clearly displayed and we reached simi- lar conclusions to those obtained in the analysis of vari- ance (ANOVA) study by RSM; the optimum reaction parameters for
The normal mode analysis is carried out by the code (alternatively, the vibrational or vibronic analysis could be read from external files), and Cartesian coordinates are used
Different methods for removing interference by humic substances in the analysis of polar pollutants have been compared in the analysis of environmental water by solid-phase
Resonance fluorescence is, indeed, ideally suited to pioneer a comprehensive analysis of frequency photon correlations since it is obtained in the strong- driving regime of an
Spectral analysis of individual nano-objects is a key aspect for the quantitative comparison to theory 131 , to derive information about the morphology or composition
To the analysis of the goals of the season previous to the changing regulation, it was used the study ‘Analysis of the offensive actions ending goal in the Spanish Professional
In addition, modal analysis can be combined with integral equation formulations, if the spectral representation of the Green’s functions inside a parallel plate waveguide is used
