Development of an improved prediction method for the yield
strength of steel alloys in the Small Punch Test
Jose Calaf Chica, Pedro Miguel Bravo Díez, Mónica Preciado
Calzada
Please cite this article as: Jose Calaf Chica, Pedro Miguel Bravo Díez, Mónica Preciado
Calzada , Development of an improved prediction method for the yield strength of steel
alloys in the Small Punch Test. The address for the corresponding author was captured
as affiliation for all authors. Please check if appropriate. Jmade(2017), doi:10.1016/
j.matdes.2018.03.064
ACCEPTED MANUSCRIPT
Development of an improved prediction method for the yield strength of steel alloys in
the Small Punch Test
Jose Calaf Chica(1), Pedro Miguel Bravo Díez(2), Mónica Preciado Calzada(3)
E-mails: (1) Corresponding author, [email protected] ; (2) [email protected]; (3) [email protected] Postal address: Departamento de Ingeniería Civil, Universidad de Burgos, Avenida Cantabria s/n, E09006 Burgos, Spain
ABSTRACT
The Small Punch Test (SPT) is a miniaturized test to characterize the mechanical properties of the materials. The load-displacement curve obtained by this test does not directly provide the material parameters, and linear correlations between data obtained from SPT curve and each mechanical property are necessary. The main difficulty of these correlation methods is the high level of scattering showed when analyzing a wide set of materials in the same study.
In this paper, a finite element analysis focused on steel alloys was performed to understand the specimen behavior in the early stages of the SPT. Present methods to correlate the material yield strength with the data obtained from the SPT curve were also analyzed via this FEM study to discover the meaning of the current correlation scattering for this mechanical property. This numerical research also proved the accuracy of the proposed correlation method for the yield strength via the SPT. The maximum slope of zone I (Slopeini) of the SPT curve showed an accurate
correlation with this mechanical property.
Focusing on steel alloys, experimental tensile tests and SPT’s were performed to validate the numerical analysis and to demonstrate the suitability of the proposed Slopeini versus yield strength correlation method.
Keywords: Small Punch Test, SPT, yield strength.
Note: This research did not receive any specific grant from funding agencies in the public, commercial, or non-profit sectors.
1
Introduction
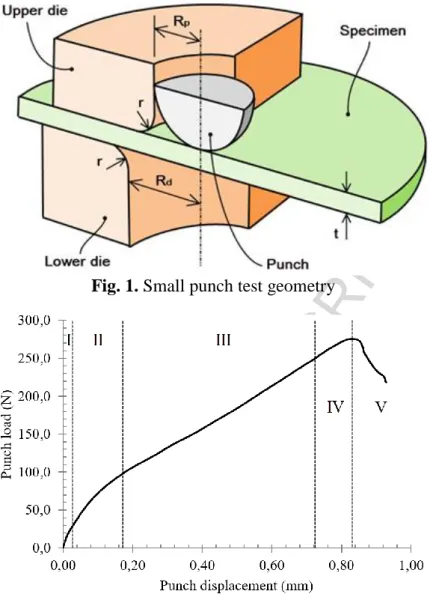
In the early 1980s an innovative Miniaturized Disk Bend Test (MDBT) was developed as a cost-effective method to test the post-irradiated state of materials used in thermonuclear reactor applications [1-2]. Many researchers have investigated and improved this test, developing the Small Punch Test (SPT) as a test method for characterization. It consists of a punch which deforms a firmly gripped specimen between two dies until fracture (see Fig. 1). Research and investigation in the SPT were focused on the evaluation of material properties, including the elastic modulus, yield strength and tensile strength [3-5], ductile-brittle transition [6], fracture properties [7-10], etc. The significant interest shown by researchers in this testing procedure motivated the development of a CEN Code of Practice for the application and use of the small punch test method for metallic materials [11].
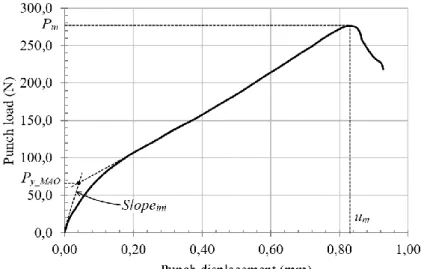
Results data recorded during SPT are the load/displacement curves (see Fig. 2). Zones distinguished in this curve are [12]:
Zone I: elastic bending.
Zone II: transition between elastic and plastic bending. Zone III: plastic hardening.
Zone IV: softening due to material damage initiation.
ACCEPTED MANUSCRIPT
Fig. 2.
Main behavior zones in the SPT curve
Mechanical properties of the material are not directly obtained from the SPT curve, and a previous correlation study between uniaxial tensile tests and SPTs needs to be performed. Yield load Py, maximum load Pm, punch
displacement at maximum load um and initial slope in zone I Slopeini are the most accepted data obtained from the
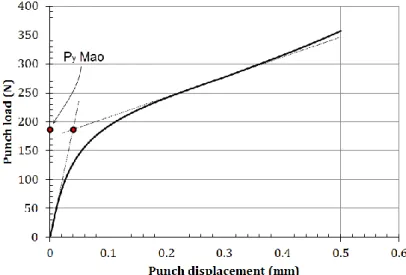
SPT curve for correlation with different mechanical properties (Fig. 3 shows an example of SPT data extraction from load vs. displacement curve) [13]. Mao and Takahashi [7] performed a correlation method between yield strength σy
and the yield load Py (see Fig. 3) with the following empirical equation (1):
(1)
where t represents the thickness of the specimen and α1 and α2 are the correlation factors which are obtained from a
regression analysis of the test results of the different materials or treatments to be correlated.
These correlations show a high level of deviation when a wide set of materials is evaluated in the same analysis: some examples are shown in the literature [13-14], with deviation up to 20% using the yield load Py to obtain the
yield strength σy of the material.
ACCEPTED MANUSCRIPT
Fig. 3.
Data extracted from SPT curve
The causes of the high deviations might be:
a) Misalignments in the setup of all parts in the assembly of the SPT or other assembly parameters (tightening of the dies with the specimen, initial gaps, etc).
b) Geometry dimensions of the specimen out of tolerance. CWA recommends very restrictive tolerances for the specimen thickness (0.495 to 0.505 mm) to ensure repeatability, so very small defects could derivate in a high level of deviations in the SPT behavior.
c) High dependency of the data extracted from SPT curve on more than one mechanical property. This cause could be limited with a search of alternative data with more dependency on the mechanical property to correlate and less dependency on the rest of the material properties.
Points (a) and (b) may be solved testing a set of SPT specimens made of the same material and checking the repeatability of all SPT curves. When deviations between the SPT curves become negligible, the setup is considered to be adjusted and the causes of deviations are reduced to the previous point (c).
In this research, previous point (c) was investigated to obtain an alternative SPT data to correlate the yield strength
σy of the material. The following steps were taken:
a) The analysis of the dependency of the yield load Py obtained from the SPT curve with more than one
mechanical property.
b) The search for an alternative method to correlate the SPT curve data with the yield strength σy of the tested
material. New data were extracted from the SPT curve in search of a high level of dependency on the yield strength and a very low dependency on the other mechanical plastic properties of the material.
2
Methodology and materials
Nowadays, there are four different methods to obtain the yield load Py from the SPT curve:
a) Mao’s method [7]. Also referred to as the “two tangents” method, the yield load Py is obtained from the
ACCEPTED MANUSCRIPT
Fig. 4.
P
yMao calculation from an SPT curve
b) Modified Mao’s method [15]. The point obtained from the previous “two tangents” method is projected vertically to the SPT curve to obtain the yield load Py (see Fig. 5).
Fig. 5.
P
yMao Projected calculation from an SPT curve
c) t/10 method [16]. The yield load Py is obtained in a way that is similar to σy (offset: 0.2%) in standard tensile
tests. A parallel line with the tangent to the elastic zone I of the SPT curve is drawn with an offset equal to t/10 in the displacement axis. The intersection of this line with the SPT curve is identified as the yield load
Py (see Fig. 6).
d) CWA method [11]. Also referred to as the “two secants” method. It is like the “two tangents” or Mao method, except for the use of secants instead of tangents. Yield load Py is calculated by the intersection of
ACCEPTED MANUSCRIPT
Fig. 6.
P
yt/10 calculation from an SPT curve
Fig. 7.
P
yCWA Projected calculation from an SPT curve
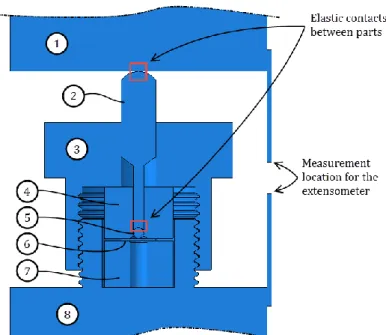
In the early days of SPT research, the SPT curve was performed with the displacement measured using an extensometer installed as shown in Fig. 8 (hereinafter referred to as δext). Later, an LVDT (Linear Variable
Differential Transformer) sensor installed in contact with the lower face of the specimen was used to obtain the displacement data (hereinafter referred to as δlower). The main differences between these two displacements are:
a) The plastic indentation between the punch and the upper face of the specimen in the initial stages of the zone I of the SPT curve is suppressed in δlower. Thus, zone I becomes a pure elastic region.
b) Non-linear contact deformations between all parts involved in the punch configuration influence the displacement measurement δext.
Point (b) is solved with a correction in the extensometer measurement. The lower die of the SPT is substituted by a tungsten cylinder with an outer diameter and height equal to the lower die dimensions. After a first loading step to a maximum load, which should not be surpassed in the subsequent SPTs, some unloading-loading cycles are performed until the stabilization in the load-displacement δext curve is reached. The last loading step of this
calibration test is recorded, and a 5th order polynomial regression from this data is established as a calibration function. This curve is used to correct the δext obtained from the SPT tests, and it results in a new displacement δupper
ACCEPTED MANUSCRIPT
Point (a) is considered by some researchers as the main reason to consider δlower as more reliable data than δupper to
measure the displacement for the SPT curve [15]. The non-linear behavior of the initial stages of zone I of the SPT curve when δupper is used is the main reason to discard this displacement.
1: Upper arm
In this article, a first investigation is focused on FEM analyses to:
a) Demonstrate that the accuracy of the correlation obtained from both displacements (δupper and δlower) is
similar.
b) Perform a detailed analysis of the dependency of the yield load Py of the SPT curve with more than one
plastic property to demonstrate the arbitrary character of the current Py - σy correlations.
c) Validate numerically an alternative method for obtaining the yield strength σy with the SPT which shows a
high level of dependency on the yield strength of the material and no significant alterations with the rest of the plastic properties.
Finally, as a second part of this investigation, experimental tests (uniaxial tensile tests and SPTs) were performed to demonstrate the suitability of the previous numerical study.
FEM simulations were performed with Abaqus FE software, taking into consideration 36 hypothetical materials. The plastic behavior for all materials was simulated with an isotropic hardening model following the Ramberg-Osgood equation (see Equations 7 and 8 [17]):
ACCEPTED MANUSCRIPT
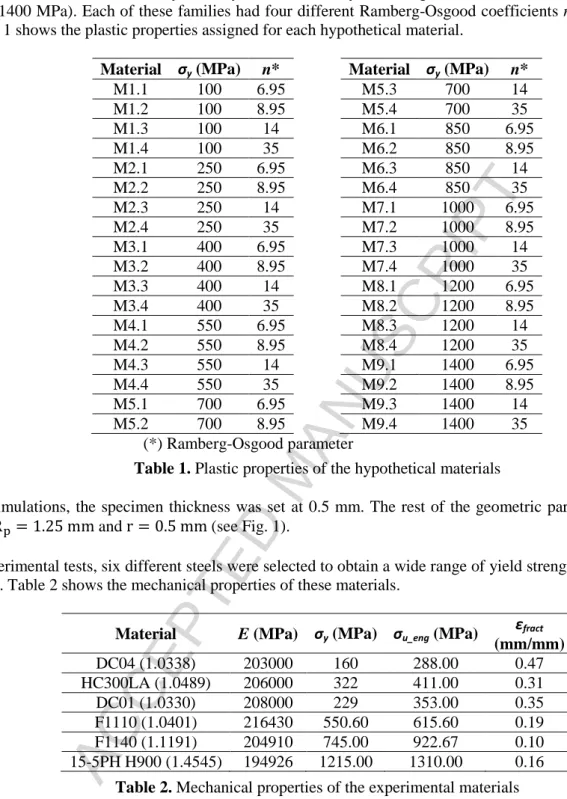
The elastic properties of all these materials were fixed to E = 200000 MPa and υ = 0.3, and plastic properties were selected to have nine families (M1.y to M9.y) with different yield strengths (100, 250, 400, 550, 700, 850, 1000, 1200 and 1400 MPa). Each of these families had four different Ramberg-Osgood coefficients n (6.95, 8.95, 14 and 35). Table 1 shows the plastic properties assigned for each hypothetical material.
Material σy (MPa) n* Material σy (MPa) n*
Table 1. Plastic properties of the hypothetical materials
In FEM simulations, the specimen thickness was set at 0.5 mm. The rest of the geometric parameters were:
, and (see Fig. 1).
In the experimental tests, six different steels were selected to obtain a wide range of yield strengths from 160 MPa to 1215 MPa. Table 2 shows the mechanical properties of these materials.
Material E (MPa) σy (MPa) σu_eng (MPa) εfract
Table 2. Mechanical properties of the experimental materials
3
Numerical analyses
ACCEPTED MANUSCRIPT
Fig. 9.
SPT FE model
This FEM model of the SPT and the goodness of fit for setup calibration to obtain δupper from δext were validated with
experimental tests in a previous published research [5].
3.1
Yield load analysis
Fig. 10 shows the SPT curve for the hypothetical material M2.3. Dashed lines represent the tangent lines for the maximum slope of zone I and the minimum slope for zones II and III. PyMao and PyMaoProj calculations are also
included in Fig. 10. A vertical dashed line situated at a punch displacement of 0.26 mm indicates the position where the minimum slope tangent is located. All data contained until this punch displacement of 0.26 mm are used to calculate PyMao and PyMaoProj.
Fig. 10.
SPT curve for material M2.3 and P
yMao& P
yMaoProjcalculation
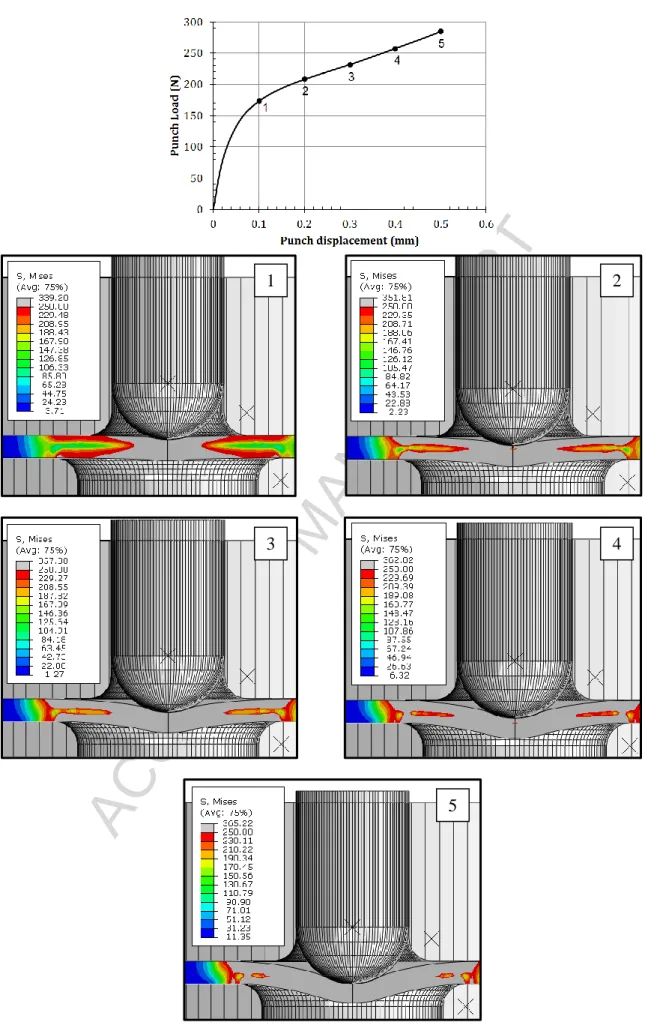
Fig. 11 shows the Von Mises stress distribution in the SPT specimen for hypothetical material M2.3. The color grey represents the area of the specimen which shows Von Mises stresses over the yield strength of the material. The specimen at points 1 to 5 shows a maximum Von Mises stress greater than the yield strength of the material (250 MPa). The hardening coefficient n is the key parameter which controls the strengthening capability of the material over the yield strength. Therefore, n has an important role in the SPT curve. Punch displacements used in PyMao and
PyMaoProj calculations for the material M2.3 were between 0 and 0.26 mm. Thus, the stress field shown in the SPT
specimen for some punch displacements used in PyMao and PyMaoProj calculations was over the yield strength in a
significant area of the specimen. It means that these Py values should be influenced not only by the yield strength σy,
ACCEPTED MANUSCRIPT
Fig. 11.
Von Mises stress for material M2.3
1
2
3
4
ACCEPTED MANUSCRIPT
The remaining methods used for Py calculation showed similar problems, so an alternative method was searched for
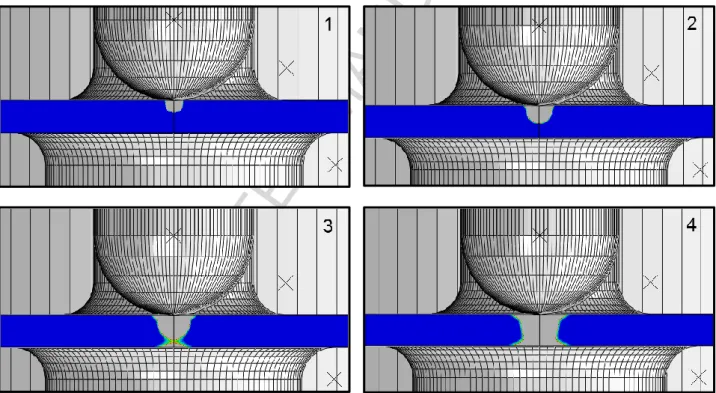
analyzing the behavior of zone I of the SPT curve. Next, Figs. 12 and 13 show a detailed graph of zone I of the SPT curve for the hypothetical material M2.3. Four points were analyzed at punch displacements of 0.002, 0.004, 0.006 and 0.008 mm. Point 3 (punch displacement of 0.006 mm) is located in the same position as Slopeini (the maximum
slope of the zone I).
Fig. 12.
Detailed view of zone I for M2.3 material
Fig. 13.
SPT test (the color grey represents the yielded zone)
The yielding is initiated in the upper face of the specimen just below the punch (see Fig. 13). It grows with the increase of the punch displacement, and point 3, which is the location of the maximum slope of zone I (Slopeini),
matches the scenario where the yielded area completely crosses the specimen thickness. Thus, the Slopeini location is
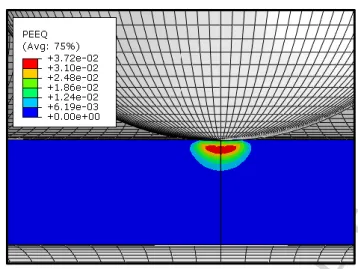
directly related to the yield strength σy. Fig. 14 shows a color-banded field of the equivalent plastic strain for point 3.
Most of the yielded area was below an equivalent plastic strain of 0.00619 mm/mm, so the Slopeini should be mainly
ACCEPTED MANUSCRIPT
Fig. 14.
Equivalent plastic strain at point 3 for M2.3 material
3.2
Hypothetical material analysis
Thirty-six hypothetical materials M1.1 to M9.4 (see Table 1 for the mechanical properties of these materials) were simulated with the same FE model used in the previous section. Fig. 15 represents the load-displacement SPT curves for these hypothetical materials. Two types of SPT curves are shown: left graphs represent the displacement of the punch vs. load; right graphs represent the displacement of the lower face of the specimen vs. load (typical measurement obtained from an LVDT placed in this location).
ACCEPTED MANUSCRIPT
ACCEPTED MANUSCRIPT
Fig. 15.
SPT curves for the hypothetical materials
The four methods currently used to obtain the elastic limit of the material via the SPT curves (Mao, Mao-projected, t/10 and CWA methods) were applied in all of the previous hypothetical materials. Two types of displacement were used: upper (the displacement of the upper face of the specimen center); and lower (the displacement of the lower face of the specimen center). Table 3 shows the yield load Py for each method and each material.
Material Upper (N) Lower (N)
Py_Mao Py_MaoProj Py_t/10 Py_CWA Py_Mao Py_MaoProj Py_t/10 Py_CWA
M1.1 75.62 49.80 75.09 61.71 73.82 30.5 74.44 55.4
M1.2 72.18 47.68 71.12 59.57 70.73 31.69 70.97 53.55
M1.3 70.99 45.74 68.66 59.24 69.59 27.07 68.03 54.07
M1.4 66.71 42.13 64.39 55.53 65.91 26.33 63.83 53.09
M2.1 186.79 127.45 183.53 153.43 182.29 97.35 182.02 139.91
ACCEPTED MANUSCRIPT
Material Upper (N) Lower (N)
Py_Mao Py_MaoProj Py_t/10 Py_CWA Py_Mao Py_MaoProj Py_t/10 Py_CWA
M2.3 171.94 114.73 165.2 140.92 168.75 87.21 164.33 128.34
Table 3. Yield loads of the SPT curves
Figs. 16 and 17 show the correlation between the normalized yield loads (Py/t 2
; where t is the specimen thickness) and the yield strength σy of the material.
Fig. 16.
P
y_Maocorrelation (left) and P
y_Mao Projectedcorrelation (right)
ACCEPTED MANUSCRIPT
Fig. 17.
P
y_t/10correlation (left) and P
y_CWAcorrelation (right)
(upper and lower displacements)
between the upper and lower methods to measure the displacement for the SPT curve showed similar deviations in the linear regression. Thus, both methods are valid for performing the SPT curve. Considering that the upper method shows a simpler setup than the lower method, it is recommended the use of the upper method instead of the lower.The Mao Projected and t/10 methods showed the highest deviation levels in the correlations. The CWA method was in a mid-level dispersion, and the best fitted correlation was for Mao’s method except for the M1 material. SPT curves of the hypothetical materials showed alterations in zones II and III for a fixed value of the yield strength σy
ACCEPTED MANUSCRIPT
Fig. 18.
Yield strength deviation of the hypothetical materials
Fig. 19 shows the Py_Mao geometrical calculations from the SPT curves for materials M2.1 to M2.4 and M9.1 to
M9.4. The reason why Mao’s method showed the best fitted correlation is based on a geometrical cause: for materials M9.1 to M9.4, the tangent lines taken in zone III showed different slopes for different hardening factors n, but all the lines converged in a location near a punch displacement of about 0.05 mm. Although the tangent lines from zone I intersect with the other tangents in a punch displacement near 0.1 mm, the differences between the Py
values are reduced significantly. For materials M2.1 to M2.4, this geometrical behavior is not enough to guarantee a convergence in the obtained Py values. Thus, the better fitting results obtained from Mao’s method are based on a
geometrical coincidence and not on the mechanical behavior of the specimen material.
Fig. 19.
Mao’s method calculation for materials M2.1 to M2.4 and M9.1 to M9.4
As explained in the previous section, the behavior of the specimen around the punch displacement where Slopeini is
located showed stress values near the yield strength. Thus, the Slopeini should show no significant variations due to
changes in the hardening factor n of the material. The method used to obtain the Slopeini was standardized as follows:
a) A variable i = 1 is assumed. A 5th order polynomial regression of SPT curve data, for a range of of the punch displacement, is adjusted to obtain:
1. The maximum slope of zone I (Slopeini_i) and
2. The punch displacement (δini_i) where this Slopeini_i is obtained.
b) Some 80% of the range used to calculate the previous regression obtained: .
c) The amplitude of the range is centered in the punch displacement δini_i , obtaining the new range:
ACCEPTED MANUSCRIPT
d) This previous range is used to perform another 5th order polynomial regression of the SPT curve data, obtaining a new maximum slope for zone I (Slopeini_i+1) and the punch displacement where this slope is
obtained (δini_i+1).
e) If the mismatch between both Slopeini’s is less than in the following the next equation
, Slopeini_i+1 is assumed as the final Slopeini value. Otherwise, the sequence returns to
phase (b) increasing the i value by one.
Next, table 4 shows the Slopeini obtained from the SPT curves of the hypothetical materials, and Fig. 20 shows the
correlation between the normalized Slopeini (Slopeini /t; where t is the thickness of the specimen) and the yield
Table 4. Slopeini of the hypothetical materials
Fig. 20.
Slope
inicorrelation
Slopeini showed a low dispersion, close to the dispersion level reached in Mao’s method. The data matched
accurately with an exponential regression equal to:
(17)
So the proposed equation to be adjusted to empirical data was
(17)
ACCEPTED MANUSCRIPT
Figs 21 and 22 show the real yield strength vs. the calculated yield strength using the regressions obtained previously for Mao, Mao projected, t/10 and CWA methods. The real yield strength vs. the calculated yield strength using the regressions analyzed for Mao (upper displacement) and Slopeini methods are shown together in Fig. 23. All
these figures showed that the most reliable methods were the Mao and the Slopeini methods.
Fig. 21.
Yield strength comparison (P
y_Maomethod (left) and P
y_MaoProjectedmethod (right))
ACCEPTED MANUSCRIPT
Fig. 23.
Yield strength comparison (P
y_Maoand Slope
inimethods)
4
Experimental procedures and results
Six steels, DC01, DC04, HC300LA, F1110, F1140 and 15-5PH H900 were tested using standard tensile tests (ASTM E8M) and small punch tests to verify the numerical results previously shown. Table 2 shows the mechanical properties for all tested materials, and Fig. 24 shows the SPT curves obtained from the experimental tests. The geometry and the setup of the SPT were the same as the one analyzed in the previous numerical calculations.
Fig. 24.
SPT curves of the experimental tests
Table 5 shows the yield loads obtained from the experimental SPT curves by Mao, Mao Projected, t/10 and CWA methods. This table also includes the Slopeini calculation (following the same method explained for the numerical
analysis).
Material Py_Mao (N) Py_MaoProj (N) Py_t/10 (N) Py_CWA (N) Slopeini (N/mm)
DC04 113.57 75.98 126.50 96.89 4188.04
HC300LA 215.26 137.04 212.00 183.82 6016.37
DC01 160.69 108.94 173.07 157.23 4889.10
F1110 262.41 173.98 297.50 259.58 7419.10
F1140 481.39 327.29 485.00 424.02 8200.76
15-5PH H900 691.72 489.64 662.00 598.11 9782.01
ACCEPTED MANUSCRIPT
Figs. 25 to 27 show the correlation between each method and the yield strength of each alloy (obtained from the tensile tests). The obtained correlation equations were:
Mao Method: (18)
Mao Projected Method: (19)
t/10 Method: (20)
CWA Method: (21)
Slopeini Method: (22)
Fig. 25.
Mao’s method correlation (left) and Mao Projected method correlation (right)
ACCEPTED MANUSCRIPT
Fig. 27.
Slope
inimethod correlation
Fig. 28 shows the deviations between the calculated yield strengths from the experimental correlation equations and the yield strengths obtained from the tensile tests. The most precise and reliable method was the proposed Slopeini
method, with the CWA and t/10 methods following far behind.
Fig. 28.
Deviations of the yield strength calculation
5
Conclusions
A numerical analysis and a set of experimental tests (uniaxial tensile tests and SPTs) were performed in this research obtaining following conclusions:
a) There are two methods for measuring the displacement data for the SPT curve: the upper and the lower methods. This research demonstrated numerically that both had the same accuracy level for the yield strength correlation. The upper method is the best method for obtaining the SPT curve considering its simplicity (lower method needs the installation of an LVDT supported in the lower face of the specimen). b) Current methods to correlate the yield strength with the SPT curve showed numerically an important
ACCEPTED MANUSCRIPT
c) An improved correlation method for the yield strength σy was obtained using the Slopeini of the SPT curve.
This method showed, both numerically and experimentally, a lower level of deviations and standard error compared with the current methods (Mao, Mao projected, t/10 and CWA). The “Slopeini method” only needs
the load-displacement data from zone I and the initial part of zone II of the SPT curve to be obtained. This is much less information compared with the current methods, which need data from zones I, II and III of the SPT curve. This adds another advantage for the proposed method for materials which show brittle behavior and premature failures.
6
Data availability
The raw/processed data required to reproduce these findings cannot be shared at this time as the data also forms part of an ongoing study.
7
References
[1] M.P. Manahan, A.S. Argon, O.K. Harling, The development of a miniaturized disk bend test for the determination of postirradiation mechanical properties, Journal of Nuclear Materials 103 & 104 (1981) 1545-1550. DOI: 10.1016/0022-3115(82)90820-0
[2] F.H. Huang, M.L. Hamilton, G.L. Wire, Bend testing for miniature disks, Nuclear Technology 57.2 (1982) 234-242. DOI: 10.13182/NT82-A26286
[3] G.E. Lucas, A. Okada, M. Kiritani, Parametric Analysis of the Disc Bend Test, Journal of Nuclear Materials 141-143 (1986) 532-535. DOI: 10.1016/S0022-3115(86)80096-4
[4] G.E. Lucas, Review of Small Specimen Test Techniques for Irradiation Testing, Metallurgical Transactions A 21A (1990) 1105-1119. DOI: 10.1007/BF02698242
[5] J. Calaf, P. M. Bravo, M. Preciado, Improved correlation for the elastic modulus prediction of metallic materials in the Small Punch Test, International Journal of Mechanical Sciences 134 (2017) 112-122. DOI: 10.1016/j.ijmecsci.2017.10.006
[6] J.M. Baik, J. Kameda, O. Buck, Development of Small Punch Tests for Ductile-brittle Transition Temperature Measurement of Temper Embrittlement Ni-Cr Steels, ASTM STP 888 (1986) 92-111. DOI: 10.1520/STP32997S
[7] X. Mao, H. Takahashi, Development of a further-miniaturized specimen of 3 mm diameter for tem disk small punch tests, Journal of Nuclear Materials 150 (1987) 42-52. DOI: 10.1016/0022-3115(87)90092-4
[8] T. Misawa, T. Adachi, M. Saito, Y. Hamaguchi, Small punch tests for evaluating ductile-brittle transition behavior of irradiated ferritic steels, Journal of Nuclear Materials 150 (1987) 194-202. DOI: 10.1016/0022-3115(87)90075-4
[9] X. Mao, M. Saito, H. Takahashi, Small punch test to predict ductile fracture toughness JIc and brittle fracture toughness KIc, Scripta Metallurgica et Materialia 25 (1991) 2481-2485. DOI: 10.1016/0956-716X(91)90053-4
[10] X. Mao, H. Takahashi, T. Kodaira, Supersmall punch test to estimate fracture toughness JIc and its application to radiation embrittlement of 21/4Cr-1Mo steel, Materials Science and Engineering AI50 (1992) 231-236. DOI: 10.1016/0921-5093(92)90116-i
ACCEPTED MANUSCRIPT
[12] M. Abendroth, M. Kuna, Determination of deformation and failure properties of ductile materials by means of the small punch test and neural networks, Computational Materials Science 28 (2003) 633-644. DOI: 10.1016/j.commatsci.2003.08.031
[13] T.E. García, C. Rodríguez, F.J. Belzunce, C. Suárez, Estimation of the mechanical properties of metallic materials by means of the small punch test, Journal of Alloys and Compounds 582 (2014) 708-717. DOI: 10.1016/j.jallcom.2013.08.009
[14] E. Fleury, J.S. Ha, Small punch tests to estimate the mechanical properties of steels for steam power plant: I. Mechanical strength, International Journal of Pressure Vessels and Piping 75 (1998) 699-706. DOI: 10.1016/S0308-0161(98)00074-X
[15] M.F. Moreno, G. Bertolino, A. Yawny, The significance of specimen displacement definition on the mechanical properties derived from Small Punch Test, Materials and Design 95 (2016) 623-631. DOI: 10.1016/j.matdes.2016.01.148
[16] C. Rodríguez, J. García, E. Cárdenas, C. Betegón, Mechanical properties characterization of heat-affected zone using the small punch test, Welding Research 88 (2009) 188-192.
ACCEPTED MANUSCRIPT
ACCEPTED MANUSCRIPT
HIGHLIGHTS
A new Slopeini correlation method in the small punch tests (SPT) is proposed.
Correlation between Slopeini and yield strength of the material showed high fitness.