Diversidad y funcionamiento de la comunidad epífita eucariota de las hojas de Posidonia oceanica
201
0
0
Texto completo
(2) Agradecimientos En primer lugar me gustaría decir que esta tesis me ha ayudado a madurar, no tan solo desde un punto de vista científico sino, también, y especialmente, en el plano personal. Este trabajo no habría sido posible sin la ayuda y colaboración de un buen número de personas. Me gustaría disculparme de antemano si olvido a alguna de ellas en las próximas líneas. Me gustaría dedicar esta tesis a mi mujer, Teresa, a mi madre, Carmina, a mis hermanas, Marga y Carmina, y al resto de mi familia y amigos. Desearía tener un recuerdo especial para mi ‘padre’, Javier, y para mi abuela, Margarita, los cuales nos dejaron hace unos años. Siempre he encontrado en ellos las palabras, el ánimo y el cariño necesarios para que este trabajo llegara a buen puerto. Esta tesis no hubiera sido posible sin la contribución de mis directores de tesis, el Dr. Jorge Terrados Muñoz y el Dr. Ramón-Rosselló Móra, del Instituto Mediterráneo de Estudios Avanzados (IMEDEA). Me gustaría agradecer la ayuda y el ánimo que me han prestado a lo largo de todo este trabajo, especialmente durante las épocas en las cuales el trabajo no salía y había que repetir una y otra vez los mismos experimentos. Querría agradecer su colaboración en el trabajo de campo y laboratorio, así como sus consejos, sugerencias y ayuda en el diseño y realización de los experimentos, análisis de resultados y discusión de los mismos desde un punto de vista crítico. Asimismo, querría agradecer al Dr. Jorge Terrados el haberme permitido disfrutar de varias campañas en el Parque Nacional de Cabrera, de las cuales guardo un recuerdo especial por el interesante trabajo realizado en ellas, el intercambio de conocimientos y experiencias con otros científicos y la belleza del entorno.. 2.
(3) A lo largo de todo el trabajo que he desarrollado durante estos años, siempre he creído que la ayuda y el buen ambiente que he encontrado entre todos mis compañeros del IMEDEA ha sido clave. Desearía agradecer especialmente la ayuda y colaboración de Inés (¡perdona por esos ratos de música indie con los que te hacía sufrir en el laboratorio!), Edu y Fiona del Grupo de Macrófitos Marinos, así como de Ana, Jocelyn (¡perdona por mis burdas imitaciones del locutor de Radio Infinita de Chile!), Arantxa, Maese Pablo y Mercedes, los cuales me hicieron sentir como uno más en la familia de Microbiología Marina del IMEDEA. Recuerdo con especial cariño las comidas en casa de María José, siempre atenta y amable con todos, además de ser una cocinera espectacular, y la competición de rimas que hacíamos al final de ellas cuando firmábamos en su libro de visitas. Finalmente, desearía agradecer la ayuda imprescindible de la Conselleria de Economia, Hisenda i Innovació del Govern Balear para llevar a cabo esta tesis, al concederme una beca pre-doctoral en el año 2005, así como diversas bolsas de viaje que me permitieron disfrutar de estancias en Barcelona y Aarhus (Dinamarca) y participar activamente en el 8º Congreso Internacional de Angiospermas Marinas (ISBW8) en Bamfield (Canadá). Todo ello ha supuesto unas experiencias tremendamente enriquecedoras desde el punto de vista personal y científico. Desearía agradecer a la Dra. Amelia Gómez Garreta, de la Unidad de Botánica de la Facultad de Farmacia (Universidad de Barcelona (UB)), y a la Dra. Birgit Olesen, del Departamento de Biología Vegetal (Universidad de Aarhus, Dinamarca) haberme aceptado en sus grupos de investigación y haberme permitido usar sus instalaciones durante un período de tiempo de esta tesis.. 3.
(4) Acknowledgements First of all, I would like to say that this PhD thesis have helped me to mature, not just from a scientific point of view but, also, especially in a personal manner. This work would not have been possible without help and support from lots of people. I would previously like to apologize for forgetting someone in next lines. I would like to dedicate this PhD thesis to my wife, Teresa, to my mother, Carmina, to my sisters, Marga and Carmina, and to the rest of my family and friends. I would wish to dedicate it in memory of my ‘father’, Javier, and my grandmother, Margarita, who died some years ago. I have always found on them words, motivation and affection that were necessary to successfully end this work. This PhD thesis would have not been possible without the contribution of my two supervisors, Dr. Jorge Terrados Muñoz and Dr. Ramón Rosselló-Móra, from Mediterranean Institute of Advanced Studies (IMEDEA). I would like to be grateful to them for help and support throughout this PhD thesis, especially those moments in which work was not successful and experiments must be repeated again and again. I would like to than them for supporting me in field and lab work, as well as their advices and analyses and discussion of results from a critical point of view. I would also like to thank Dr. Jorge Terrados for allowing me to enjoy some scientific campaigns in Cabrera National Park. I have happy memories of those because of the interesting work developed, the knowledge and experiences exchanged with other scientists and beauty of the scenery. Throughout the work I have developed during these years, I have always believed that help and nice atmosphere that I have found among my colleagues from IMEDEA have played a key role. I would especially wish to thank help and support of. 4.
(5) Inés (please, excuse for those moments with indie music you suffered in lab!), Edu and Fiona from Marine Macrophyte Group, as well as Ana, Jocelyn (please, excuse me for my bad imitations of the announcer of ‘Radio Infinita’ from Chile), Arantxa, Maese Pablo and Mercedes, who accepted me as another member of Marine Microbiology family from IMEDEA. I have special memories from lunchs in María José house, always nice and kind to everybody, apart from being an incredible cooker, and rhyme competition at the end of lunchs when we signed in her guests’ book. Finally, I would like to be grateful to ‘Conselleria de Economia, Hisenda i Innovació’ from Balearic Government for granting me a PhD fellowship, as well as some funds that allowed me enjoying short stays in Barcelona and Aarhus (Denmark) and actively participate in 8th International Seagrass Biology Workshop (ISBW8) in Bamfield (Canada). All these experiences have been incredibly important from either a scientific or personal point of view. I would like to thank Dr. Amelia Gómez Garreta, from Botany Department in Pharmacy Faculty (University of Barcelona (UB)), and Dr. Birgit Olesen, from Plant Biology Department (University of Aarhus, Denmark) for accepting me in their investigation groups during PhD stays and allowing me to use their facilities during a period of time of this PhD thesis.. 5.
(6) SECTION I – Summary ………………………………………………………………………….…… 7-11 SECTION II – Introduction ………………………………………………………………………….. 12-28 SECTION III – Fundamentals of techniques used …………………………………………………... 29-41 SECTION IV – Chapter 1. Optimisation of a molecular fingerprinting technique (TGGE) to the study of the structure of the macroeukaryotic epiphytic fraction of P. oceanica leaves ……………............. 42-61 Chapter 2. Application of TGGE to monitor changes in the structure of the eukaryotic leaf-epiphytic community of P. oceanica ……………………………………………...…….…………..…… 62-77 Chapter 3. Evaluation of SSU clone library approach to study the diversity of the macroeukaryotic leaf-epiphytic community of the seagrass P. oceanica (L.) Delile ………………...…………... 78-99 Chapter 4. Comparing the summer structure of the macroeukaryotic leaf-epiphytic community in two P. oceanica (L.) Delile meadows by means of TGGE molecular approach and classical microscopy techniques …………………….………………………………………………… 100-119 Chapter 5. Seasonal variability of the structure of the macro-eukaryotic leaf-epiphytic assemblage of P. oceanica (L.) Delile applying TGGE and classical microscopy approach ……..………… 120-139 SECTION V – Chapter. 6.. NR. activity. in. seagrass. (P.. oceanica). leaf-epiphytic. macroalgae. ……………………………………………………………………………………….….……. 140-156 SECTION VI – General Discussion ………………………………………………………….…… 157-161 SECTION VII – References ………………………………………………………………….…… 162-188 ANNEX I – Glossary ……………………………………………………………………….……... 189-192 ANNEX II – Images of selected taxa of the macroeukaryotic leaf-epiphytic assemblage of P. oceanica …………………….……………………………………………………………………...…………...…. 193-201. 6.
(7) SECTION I - Summary. Detail of epiphyte encrusting Rhodophyta on Posidonia oceanica leaf. 7.
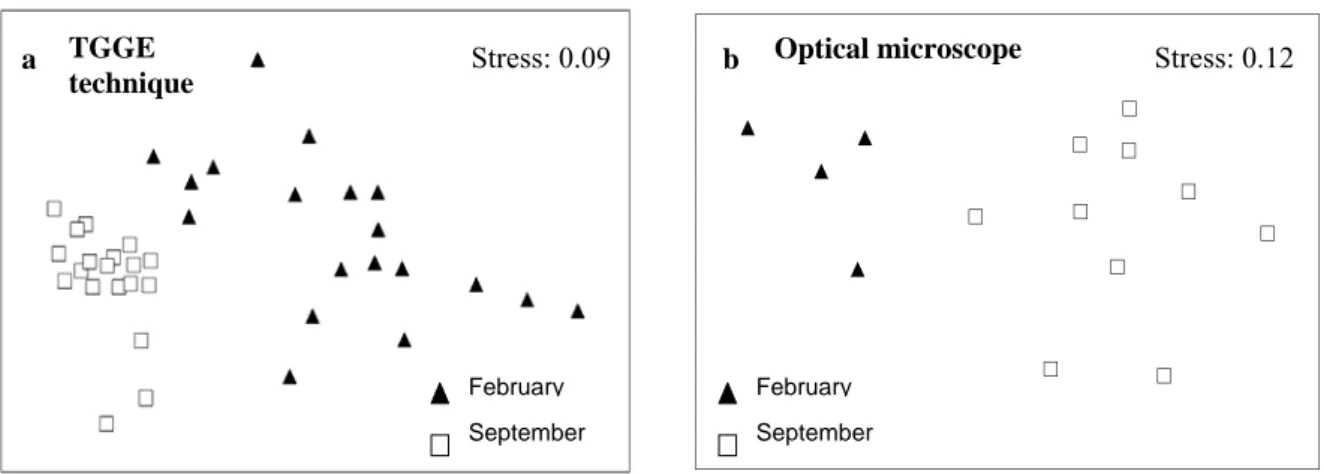
(8) SECTION I - Summary. The macroeukaryotic leaf-epiphytic fraction of the seagrass Posidonia oceanica is a highly dynamic assemblage that significantly contributes to biomass, nutrient cycling, sediment carbonate and productivity of the ecosystem. The structure of this assemblage is characterized by showing variability in a relatively short period of time and by being influenced by abiotic and biotic factors and disturbances (natural and anthropogenic). Spatio-temporal variability in the structure of the macroeukaryotic epiphytic fraction of P. oceanica leaves has been previously described in a wide variety of studies under optical microscope or dissecting microscope (classical microscopy approach). Our first objective was testing the sensitivity of two molecular techniques (Temperature gradient gel electrophoresis (TGGE) and small ribosomal subunit (SSU) clone libraries), as an alternative to classical microscopy method, to detect variability in the structure of that epiphytic assemblage and, therefore, to evaluate if it was feasible to use those molecular techniques to study this epiphytic community. TGGE was optimized to study the structure of the macroeukaryotic leafepiphytic assemblage of P. oceanica (Chapter 1), allowing to observe variability in the structure of that assemblage between two stages (February vs. September) of the seasonal succession (Chapter 2), between the mature stage (summer) in two different locations (Chapter 4) and between different stages of the seasonal succession of this community (Chapter 5). The mature stage of the assemblage (September) was characterised by showing the highest richness (the highest Operational Taxonomic Units (OTUs)), according to previous studies. The composition of the assemblage differed between all stages, with the exception of spring stages (April and June), when the community has been described as highly homogeneous because of the relative abundance and biomass of Phaeophyta in relation to the whole assemblage.. 8.
(9) SECTION I - Summary. SSU clone libraries were also able to detect variability in the structure of three different stages of the macroeukaryotic epiphytic assemblage (February, June and September) (Chapter 3). On the one hand, SSU clone libraries resulted to be more timeconsuming than TGGE, but on the other hand they allowed the putative identification of epiphyte taxa. Results suggested that molecular approaches were able to detect more differences than microscopy method. It could be explained for different reasons: (1) underestimation of the real diversity: leaf-macroeukaryotic epiphytic assemblage description based on microscopy could be biased by the taxonomical expertise of the researcher, (2) taxonomic impediment: some individuals (juvenile, broken,…) were difficult to determine under microscope and (3) molecular techniques could detect the presence of taxa even with low relative abundance in the assemblage. We. were. also. interested. in. studying. the. relationship. between. diversity/composition of the leaf-epiphytic macroalgae and Nitrate Reductase (NR) activity (as a measure of nitrogen assimilation capacity from water column, which is an ecosystem key process) (Chapter 6). Macroalgal epiphytes were selected because they are the most abundant and diverse component of the macroeukaryotic leaf-epiphytic fraction and they show variability in biomass, species composition and richness thorough seasonal succession. Results suggested that the diversity and composition of the epiphytic macroalgal component is a relevant factor to explain differences in NR activity between two stages of the assemblage (winter vs. summer). Main conclusions of this PhD thesis can be summarized in: •. TGGE resulted to be an excellent parallel approach to monitor changes in the structure of the macroeukaryotic epiphytic fraction of P. oceanica leaves. This. 9.
(10) SECTION I - Summary. molecular technique was able to detect variability in the structure of the epiphytic assemblage between two stages of the seasonal succession, between the mature stage in two different locations and between the different stages of the seasonal succession. •. SSU clone libraries also constituted an alternative method to study the structure of the macroeukaryotic epiphytic fraction of P. oceanica leaves. This technique showed variability in the structure of that assemblage between three stages of the seasonal succession.. •. TGGE and SSU clone libraries were suitable to simultaneously analyse large amounts of samples. Both methods overcame some disadvantages of the classical microscopy approach: (1) underestimation of the real diversity: leafmacroeukaryotic epiphytic assemblage description based on microscopy could be biased by the taxonomical expertise of the researcher, (2) taxonomic impediment: some individuals (juvenile, broken,…) were difficult to determine under microscope and (3) low abundant taxa: molecular techniques were able to detect the presence of taxa even with low relative abundance in the assemblage.. •. Comparing the two molecular techniques, TGGE resulted to be less timeconsuming than SSU clone libraries, but the later approach was more appropriate than the former one to putatively identify epiphytic taxa explaining variability in the structure of that assemblage. TGGE could be more recommended than SSU clone libraries to quickly assess the variability of the structure of the macroeukaryotic leaf-epiphytic assemblage.. •. Diversity/composition of the macroalgae epiphytic component was linked to variability in NR activity of the assemblage, reinforcing the relationship between. 10.
(11) SECTION I - Summary. diversity and ecosystem functioning found in other communities. The composition of the assemblage suggested playing a relevant role in determining nitrogen assimilation rates in different stages of the epiphytic assemblage.. 11.
(12) SECTION II - Introduction. Detail of epiphyte Bryozoa on P. oceanica leaf. 12.
(13) SECTION II - Introduction. 1. Seagrasses: Posidonia oceanica Seagrasses are macrophytes distributed along coastal areas worldwide (with the exception of polar coasts). They mainly colonize unconsolidated substrata (sandy or muddy), although some species are able to establish on rocky bottoms (Procaccini et al. 2003; Spalding et al. 2003). Seagrasses are clonal plants1 that share a common architecture based on a repetition of units (ramets). Each ramet is composed of a horizontally growing rhizome portion, a vertically growing rhizome portion in some species, a leafy shoot, a root system, and sometimes flowers or inflorescences and fruits. Seagrasses provide ecological services in coastal areas, which can be summarized in a high productivity, promotion of marine biodiversity, regulation of the quality of waters and protection of the shore line (Marbà et al. 2004; Terrados and Borum 2004). Posidonia oceanica (L.) Delile is an endemic2 Mediterranean seagrass that forms monospecific meadows with a shoot density ranging from 150 - 300 shoots m-2 (low density meadows) to more than 700 shoots m-2 (high density meadows) in shallow waters (< 10 m depth) (Spalding et al. 2003; Gobert et al. 2006). P. oceanica vegetative structure is composed of highly lignified horizontal (plagiotropic) and vertical rhizomes (ortotropic), leafy shoots and a root system (Fig. 1a). Plagiotropic rhizomes horizontally expand by means of terminal apexes, allowing substrata colonization and interconnection between different ramets, maintaining plant integrity. Ortotropic rhizomes are attached to plagiotropic rhizomes and support leafy shoots that avoid sediment burial as a consequence of the vertical growth of rhizomes. Shoots are composed of 5 – 10 linear broad leaves (5 - 12 mm) with lengths, generally, from 20 to 40 cm, whereas roots are generally largely branched and are 3 to 4 mm thick and up to 40 cm long, respectively. Progressive accumulation of particulated organic matter from P. oceanica. 13.
(14) SECTION II - Introduction. and sediment inside the meadow, together with the very slow decay of the rhizomes and roots forms a typical structure called “matte” composed of rhizomes, roots and sediment (Fig. 1b). Flowering period goes from August to November, although P. oceanica shoots rarely flower (about 0.007 inflorescences shoot-1 year-1 in Western Mediterranean meadows) (Díaz-Almela et al. 2006). The flowers are large and produce a large fruit (10 mm). Young individuals originating from seeds (seedlings) are rarely found and spreading of this seagrass primarily occurs vegetatively by branching of the plagiotropic rhizomes (Borum and Greve 2004; Marbà et al. 2004). P. oceanica has a long life span and a very slow growth rate in comparison with other seagrass species (Table 1) (Marbà et al. 2004).. a. Leaf. Shoot Roots Plagiotropic rhizome. b. Ortotropic rhizome. Fig. 1. General structure (a) and “matte” (b) of P. oceanica. Adapted from Massutí Pascual et al. (2000).. 14.
(15) SECTION II - Introduction. Table 1. Average architectural features and growth rates of P. oceanica and the other three European seagrasses. Variables are in rows and seagrass species in columns. nd: no available data; NP: ortotropic rhizomes are not present in Zostera marina and Zostera noltii. Adapted from Marbà et al. (2004). Cymodocea nodosa. P. oceanica. Zostera marina. Zostera noltii. Shoot elongation rate (cm shoot-1 day-1). 1.3. 0.8. 3.2. 0.7. Plagiotropic rhizomes elongation rate (cm apex-1 year-1). 40. 2. 26. 68. Ortotropic rhizomes elongation rate (cm apex-1 year-1). 1.4. 1. NP. NP. Leaf life span (days). 79. 295. 88. 86. Shoot life span (days). 876. 4,373. 554.8. nd. P. oceanica requires stable environmental conditions, being mainly found over sandy carbonated sediments, although it can also colonize rocky substrata. This seagrass is stenohaline3, not resistant to desiccation and tolerates a wide range of temperatures (9ºC – 29ºC). Its bathymetric distribution goes from a few meters to 40 meters depth in very clean waters, being light availability and wave exposure the main factors determining lower and upper limit, respectively (Greve and Binzer 2004; Gobert et al. 2006; Infantes et al. 2009). Light availability, substratum and wave exposure, together with nutrient availability (specially, nitrogen and phosphorus) are the most relevant abiotic factors that control P. oceanica growth and distribution (Greve and Binzer 2004; Gobert et al. 2006). This seagrass often appears in sediments with low nutrient content that might constrain its growth rate. However, there are several reasons that explain how P. oceanica can survive in those habitats: (1) nutrient uptake can be performed either from water column or pore water sediment, (2) nutrient requirements are lower than in macroalgae and phytoplankton, (3) nutrients can be stored in rhizome and (4) nutrient. 15.
(16) SECTION II - Introduction. retranslocation4 is possible among different parts of the plant (Romero et al. 1994; Alcoverro et al. 2000; Invers et al. 2002; Lepoint et al. 2002a; Lepoint et al. 2002b). Experimental nutrient addition to water column has shown a positive relationship with filamentous and epiphyte5 algae development in summer season that can negatively affect P. oceanica growth (Leoni et al. 2006; Prado et al. 2008). Grazing affecting P. oceanica distribution and growth, mainly caused by sea urchins (Paracentrotus lividus) and fishes (Sarpa salpa), has been traditionally considered as relatively low (Cebrián et al. 1996), although recent studies have concluded that it might have been underestimated (Tomas et al. 2005a; Prado et al. 2007a). Some authors have suggested an indirect and positive effect of fishes, sea urchins and mesograzers (Crustacea, Mollusca Gasteropoda,…) on P. oceanica because they would control epiphyte accumulation on their leaves (Alcoverro et al. 1997; Peirano et al. 2001; Tomas et al. 2005b; Prado et al. 2007b; Gacia et al. 2009). P. oceanica meadows are highly relevant for the functioning of Mediterranean coastal areas because they provide some ecological services: •. Marine biodiversity promotion. P. oceanica meadows provide habitat for a large number of species belonging to a wide variety of taxonomic groups (Van der Ben 1971; Ballesteros 1987; Mazzella et al. 1989).. •. High productivity (Romero 1989; Pergent et al. 1994; Cebrián et al. 1997).. •. Protection of the shore line from erosion caused by waves (Granata et al 2001).. •. Regulation of the quality of coastal waters through the trapping of suspended particles and the absorption of nutrients (Gacia and Duarte 2001; Gacia et al. 2002).. 16.
(17) SECTION II - Introduction. A high number of studies have used different parameters of P. oceanica (nitrogen and phosphorus rhizome content, shoot density, leaf area,…) as a multivariate indicator of the quality of coastal waters related to Water Framework Directive (2000/60/CE) (Romero et al. 2007; Fernández-Torquemada et al. 2008; Montefalcone 2009). The usefulness of this seagrass as a bioindicator of the status of Mediterranean coastal waters has been recognised because of four main reasons: (1) high sensitivity to perturbations (Ruiz et al. 2001; Cancemi et al. 2003; Pérez et al. 2008), (2) wide distribution along mediterranean coasts (Procaccini et al. 2003), (3) long life span allowing the identification of temporal changes in environmental conditions that affect growth rate (Marbà et al. 2004) and (4) high knowledge about biology and ecology of this species (Massutí Pascual et al. 2000; Gobert et al. 2006).. 17.
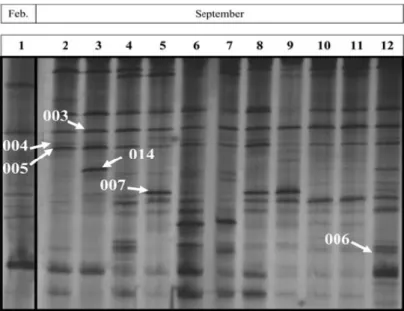
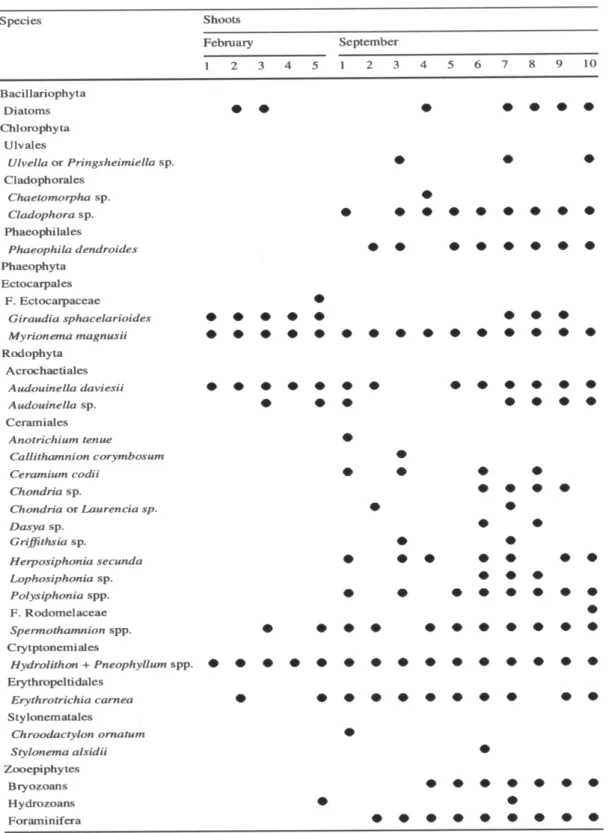
(18) SECTION II - Introduction. 2. The macroeukaryotic epiphytic fraction of P. oceanica leaves 2.a) Temporal succession and factors determining the structure of the macroeukaryotic epiphytic fraction of P. oceanica leaves Leaves of P. oceanica and other seagrasses provide excellent conditions for the establishment of micro- and macroepiphytes. These leaves are exposed to higher light availability, lower sedimentation rates and higher hydrodynamics6 than the rhizomes (Trautman and Borowitzka 1999; Borowitzka et al. 2006) (Fig. 2).. Fig. 2. Epiphytic community of P. oceanica leaves. Photography by E. Infantes.. Seasonality of growth and high renovation rates of P. oceanica leaves determine a seasonal succession of the macroeukaryotic epiphytic fraction that starts in autumn (related to the annual maximum of production of new leaves) and finishes in summer (related to the annual maximum of fallen leaves) (Ott 1980; Pergent and PergentMartini 1993). Significant changes in the structure of this fraction (biomass, species composition and richness) have been observed along this seasonal succession (Van der Ben 1971; Ballesteros 1987; Romero 1988; Mazzella et al. 1989). The first stage of the sucesssion is typically composed of an encrusting layer of Phaeophyta (mainly, Myrionema magnusii) and Rhodophyta (basically, Hydrolithon spp. and Pneophyllum. 18.
(19) SECTION II - Introduction. spp.). This encrusting layer, which is present through the entire succession, is generally covered by zooepiphytes (mainly, Bryozoa) in winter, by filamentous Phaeophyta (especially, Giraudia sphacelarioides and Cladosiphon spp.) in spring and by filamentous Rhodophyta in summer (basically, species belonging to Ceramiales Order) (Van der Ben 1971; Ballesteros 1987; Romero 1988). The highest biomass values along the succession are found in spring and summer because of the important abundance of filamentous Phaeophyta and Rhodophyta, respectively (Ballesteros 1987; Romero 1988). Epiphyte species richness generally increases along the succession, reaching a maximum at the end of summer, when the highest similarity in epiphytic species composition among different shoots is also found (Ballesteros 1987). The structure of the macroeukaryotic epiphytic fraction of P. oceanica leaves and other seagrasses is the result of the interaction of several abiotic (mainly, light, nutrient availability and water column hydrodynamics) and biotic factors (basically, grazing) that operate at different scales. Some authors have suggested that the interaction among phenomena that operate at large spatial scales (such as hydrodynamics or nutrient availability) and at local scale (such as light attenuation by self-shading among shoots) is relevant to explain the spatial variability in the structure of the macroeukaryotic epiphytic fraction of P. oceanica leaves. Results obtained in those studies indicate that the highest variability in the structure of this fraction is found at small (shoots separated 10s-100s cm from each other) and large spatial scales (shoots separated some km from each other) (Piazzi et al. 2004; Pardi et al. 2006; Balata et al. 2007; Piazzi et al. 2007). The most studied abiotic factor related to the structure of the macroeukaryotic epiphytic fraction of P. oceanica leaves has been nutrient availability. Different studies. 19.
(20) SECTION II - Introduction. have concluded a positive relationship in summer between nutrient availability and epiphytic biomass over P. oceanica leaves and changes in specific composition mainly related to the abundance of filamentous Phaeophyta (Leoni et al. 2006; Balata et al. 2008; Prado et al. 2008). However, Terrados and Medina-Pons (2008) did not observe significant differences in epiphytic biomass when comparing locations with different loading rates of anthropogenically-derived nutrients which suggested that this positive relationship might occur when differences in nutrient availability exceed a specific threshold. Light availability has been suggested as a key factor to explain the variability in the structure of the macroeukaryotic epiphytic fraction of P. oceanica leaves along depth gradients (Mazzella et al. 1989; Lepoint et al. 1999; Nesti et al. 2009). Lepoint et al. (1999) observed that the epiphytic fauna/flora ratio in P. oceanica leaves increased with depth because of the increase in relative abundance of Bryozoa and Hydrozoa against algae. Mazzella et al. (1989) and Nesti et al. (2009) showed a higher relative abundance in encrusting Rhodophyta against Phaeophyta in P. oceanica shoots located in depth, which could be explained by the fact that the former group exhibited a higher tolerance to variations in light availability (Figueiredo et al. 2000). The influence of hydrodynamics in the structure of the macroeukaryotic epiphytic fraction of seagrasses has been basically studied in Posidonia sinuosa (Kendrick and Burt 1997; Lavery et al. 2007). Kendrick and Burt (1997) and Lavery et al. (2007) observed a negative relationship between hydrodynamics and epiphytic algae biomass in P. sinuosa leaves, because only encrusting algae were able to establish in locations exposed to a higher effect of waves and currents. However, Schanz et al. (2002) found an indirect and positive relationship between hydrodynamics and. 20.
(21) SECTION II - Introduction. epiphytic biomass in Z. marina, because higher hydrodynamics negatively affected the abundance of the invertebrate Hydrobia ulvae, which was a relevant epiphyte grazer in those seagrass meadows. Among relevant biotic factors determining the structure of the macroeukaryotic epiphytic fraction of seagrass leaves, grazing has been much studied. Prado et al. (2007b) and Nesti et al. (2009) showed an indirect and negative relationship between epiphytes in P. oceanica leaves and the relative abundance of macrograzers (S. salpa and P. lividus) along a depth gradient. Those studies concluded that in shallow P. oceanica meadows (0 – 10 m) relative abundance of macrograzers S. salpa and P. lividus was higher, inducing a higher leaf consumption and a reduction in leaf area for epiphytic colonization (Alcoverro et al. 1997; Tomas et al. 2005a; Prado et al. 2007b). The number of studies about effects of mesograzers and the structure of the macroeukaryotic epiphytic fraction of P. oceanica leaves is significantly lower (Gacia et al. 2009), although mesograzers have shown that can significantly influence specific composition and biomass of this epiphytic fraction in other seagrasses (Duffy and Harvilicz 2001; Duffy et al. 2001). 2.b) Methodology to study the structure and diversity of the macroeukaryotic epiphytic fraction of P. oceanica leaves. The study of the structure and diversity of the macroeukaryotic fraction of P. oceanica leaves has been traditionally performed by means of optical microscopy techniques and/or dissecting microscope and has been mainly focused in macroalgae that are the most abundant and diverse component of the epiphytic assemblage (Van der Ben 1971; Cinelli et al. 1984; Antolic 1985; Antolic 1986; Ballesteros 1987) (Fig. 3). A significant number of studies based on different zooepiphytic taxonomic groups are also found in. 21.
(22) SECTION II - Introduction. literature (Hayward 1975; Boero 1981; Pansini and Pronzato 1985). However, studies about the structure and diversity of the whole macroeukaryotic epiphytic fraction are significantly lower (Casola et al. 1987; Mazzella et al. 1989). This fact probably reflects the difficulty to identify the wide variety of taxonomic groups colonizing P. oceanica leaves.. Fig. 3. Relative abundance of the different taxonomic groups of macroalgae over P. oceanica leaves. Chlorophyta (Chlor.), Phaeophyta (Phaeophycées), Rhodophyta is composed of Order Ceramiales (Céramiales) + Bonnemaisoniales (Bonnem.) + Cryptonemiales (Crypt.) + Rhodymeniales (Rhodym.) + Gigartinales (Gigart.) + Acrochaetiales (Acroch.) + Bangiales. Adapted from Van der Ben (1971).. The description of the structure, diversity and dynamics of microbial communities by means of molecular biology has progressively replaced the use of classical techniques from mid 80s (Giovannoni et al. 1990; DeLong 1992; Head et al. 1998). The evaluation of diversity from a molecular perspective has been based on the inference of phylogenetic relationships among organisms that compose a community. Most of these molecular approaches have been performed using codifying genes7 for small ribosomal subunit (16S ARNr in prokaryotes / 18S ARNr in eukaryotes, hereafter abbreviated as SSU) (Head et al. 1998; Fuhrman 2008). The usefulness of these genes to infer phylogenetic relationships have been mainly explained by three reasons (Van de Peer et al. 1993; Head et al. 1998; Eickbush and Eickbush 2007): 1) They are homologous genes8 that exist in all cellular organisms.. 22.
(23) SECTION II - Introduction. 2) They share a high identity in nucleotide sequence among individuals belonging to the same species, and less with different taxa. Multiple copies of these genes occurring within the genome9 of an individual (paralogous genes) also share a high identity in nucleotide sequence. 3) Primary structure of these genes is composed of a mosaic of highly conserved and highly variable regions. In addition, they have a high percentage of complementary sequences that are responsible of matchings inside the same nucleotide chain determining a functional secondary structure (Fig. 4).. Development of molecular techniques based on SSU has been primarily performed to study diversity and dynamics of prokaryotic communities. They have allowed overcoming limitations of classical culture techniques of microorganisms (Head et al. 1998; Fuhrman 2008), discovering an unknown diversity in different environments (Giovannoni et al. 1990; DeLong 1992; Bruemmer at al. 2004). Recently, these molecular approaches have also shown to be useful to study the structure of microeukaryotic communities (Díez et al. 2001; López-García et al. 2001; Massana et al. 2002). These approaches have allowed obtaining diversity estimations independent from the knowledge of the taxonomy of groups composing a community. However, the application of molecular approaches in macroeukaryotic assemblages has been basically restricted to the description of the diversity of terrestrial nematodes (Floyd et al. 2002; Foucher and Wilson 2002), the diet of some species (Blankenship and Yayanos 2005; Passmore et al. 2006) and paleoecological10 studies (Willerslev et al. 2003; Willerslev et al. 2007).. 23.
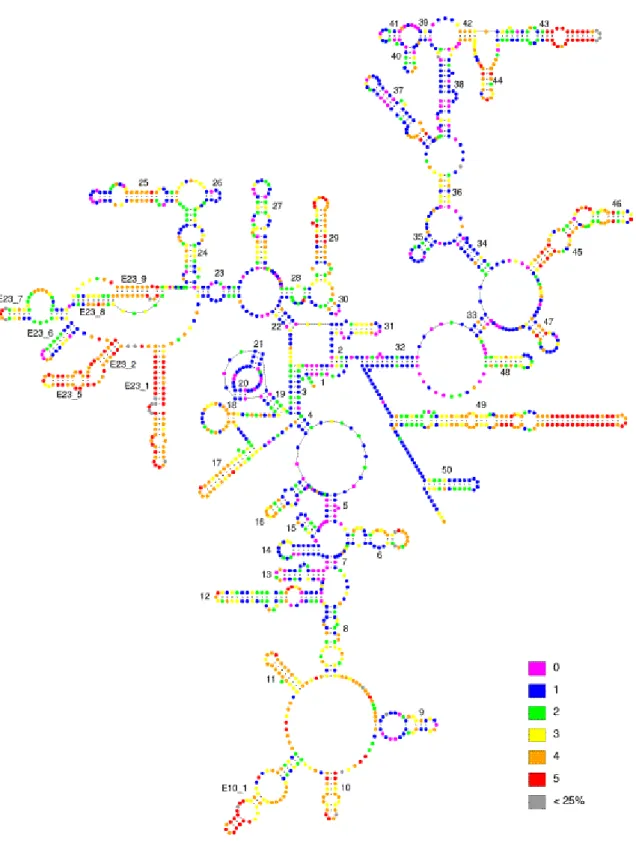
(24) SECTION II - Introduction. Fig. 4. Secondary model structure of SSU in Saccharomyces cerevisiae yeast. Different positions inside the molecule has been divided in 5 groups of variability (from totally conserved (pink) to highly variable (red)). Positions in grey colour either represent nucleotides present in S. cerevisiae but only present in less than 25% of other selected 500 eukaryotic SSU sequences, or not well-aligned regions. Variability of different positions is calculated by means of nucleotide substitution rate (Van de Peer et al. 1993) based on the alignment of 500 eukaryotic SSU sequences. Variability map adapted from Van de Peer et al. (1997).. 24.
(25) SECTION II - Introduction. 2.c) Relationship between structure/diversity/identity of species of the macroalgal epiphytic component of P. oceanica leaves and ecosystem functioning. The study of diversity/structure/identity of species composing a community has been traditionally descriptive. However, recent studies have focused in the relationship between diversity/structure/species identity and key processes of ecosystem functioning (Bengtsson 1998; Loreau et al. 2001). Most of these studies in aquatic environments have found a significant relationship between the community structure and productivity (McGrady-Steed et al. 1997; Downing and Leibold 2002), resource consumption (Cardinale et al. 2002), nitrogen uptake from water column (Lepoint et al. 2007), resistance to alien species colonization (Stachowicz et al. 1999) and the ecosystem stability against disturbances (Aoki and Mizushima 2001). Although different studies have suggested a significant effect of the whole epiphytic community of different seagrasses in key processes of ecosystem functioning such as productivity (Morgan and Kitting 1984; Moncreiff et al. 1992), light availability (Sand-Jensen 1977; Sand-Jensen et al. 1985; Drake at al. 2003), oxygen exchange (Sand-Jensen et al. 1985) and nitrogen uptake from water column (Cornelisen and Thomas 2002; Lepoint et al. 2004; Cornelisen and Thomas 2006), the effect of diversity/specific composition of this epiphytic community in these processes has received less attention (Lepoint et al. 2007). Lepoint et al. (2007) concluded that encrusting epiphytic Rhodophyta exhibited significantly higher values of nitrogen uptake from water column than epiphytic Phaeophyta in P. oceanica leaves. Nitrogen assimilation is a key process in coastal ecosystems dominated by seagrasses, where the most common nitrogen form is nitrate (NO3-) (Romero et al. 2006). The capacity of autotrophic organisms to assimilate nitrogen from water column. 25.
(26) SECTION II - Introduction. strongly depends on the enzyme Nitrate Reductase (NR), which is responsible of the initial reduction of NO3- to nitrite (NO2-). NO2- is subsequently reduced to ammonia (NH4+) and finally assimilated into aminoacids (Solomonson and Barber 1990; Romero et al. 2006) (Fig. 5). The activity of the NR enzyme, measured as NO2- production along the time, has been widely used as an estimation of nitrogen assimilation capacity in different species of phytoplankton (Berges and Harrison 1995), vascular plants (Doddema and Howari 1983; Scheible et al. 1997) and macroalgae (Davison and Stewart 1984; Lartigue and Sherman 2002), showing a significant relationship with abiotic (mainly, temperature, light and NO3- availability) and biotic factors (interspecific differences) (Gao et al. 2000; Lartigue and Sherman 2002; Young et al. 2007). However, the application of NR activity to estimate nitrogen assimilation capacity in communities is very scarce and has been limited to the macroalgal epiphytic component of Amphibolis antarctica and P. sinuosa seagrass species (Young et al. 2005). Contrasting to seagrasses, such as P. oceanica, epiphytic algae are characterized by (1) high nutrient requirements, (2) nutrients are exclusively uptaken from water column and (3) a reduced capacity to store nutrients (Williams and Ruckelshaus 1993; Alcoverro et al. 1997; Terrados and Williams 1997; Romero et al. 2006; Lepoint et al. 2007). Because of that, epiflora productivity and growth is frequently more limited than in P. oceanica in oligotrophic11 environments, such as Mediterranean Sea. Although a progressive increase in nutrient availability (eutrophication) has been recently observed in Mediterranean Sea (Turley 1999) and the effects of this environmental change have been mainly related to increases in abundance and biomass of epiphytic opportunistic algae (Cancemi et al. 2000; Prado et al. 2008), no relationship has been established in. 26.
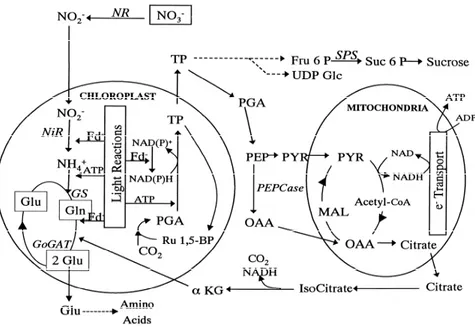
(27) SECTION II - Introduction. literature between eutrophication and nitrogen uptake depending on community structure and diversity.. Fig. 5. Nitrogen uptake and assimilation in autotrophic organisms. NO3- uptake and NH4+ assimilation primarily occurs in cytosol and plasts (chloroplasts and mitochondria), respectively. NO3- can be stored in vacuoles inside cells or can be reduced in cytosol by means of NR enzyme. After that, NO2- produced from NO3- reduction enters in GS/GOGAT cycle, where glutamine synthetase (GS) catalyzes the transformation of glutamate in glutamine. The addition of carbon skeletons (a-ketoglutarate) produces two glutamate molecules, which is catalyzed by the enzyme glutamate synthetasa (GOGAT). One of these molecules can be recycled through GS/GOGAT cycle, whereas the other one can be used to form complex aminoacids. Adapted from Touchette and Burkholder (2000).. 27.
(28) SECTION II - Introduction. 3. Main objectives of the PhD thesis The present PhD thesis had two main goals: 1. Describe the diversity and structure of the macroeukaryotic epiphytic fraction of P. oceanica leaves and its spatio-temporal variability applying molecular techniques as an alternative to classical microscopy/dissecting microscope techniques. Macroeukaryotic epiphytic fraction of P. oceanica leaves has been selected as a community model because of different reasons: (1) its significant contribution to biomass, nutrient cycling, sediment carbonate and productivity of the ecosystem (Ballesteros 1987; Romero 1988; Canals and Ballesteros 1997; Lepoint et al. 2007), (2) a relatively short period of time is enough to detect significant changes in its structure and (3) its structure can be influenced by abiotic and biotic factors and disturbances (natural or anthropogenic). 2. Evaluate the relationship between species identity/diversity/structure of macroalgal epiphytic component of P. oceanica leaves and NR activity (as a measure of nitrogen assimilation capacity from water column, which is an ecosystem key process). Macroalgal epiphytes were selected because they are the most abundant and diverse component of the macroeukaryotic epiphytic fraction and they show changes in biomass, species composition and richness thorough seasonal succession (Borowitzka et al. 2006).. Different techniques used to accomplish these objectives are explained in Section III.. 28.
(29) SECTION III – Fundamentals of techniques used. Detail of epiphytes on old P. oceanica leaf. 29.
(30) SECTION III – Fundamentals of techniques used. 4. Molecular techniques used to describe the structure of the macroeukaryotic epiphytic fraction of P. oceanica leaves 4.a) Desoxirribonucleic acid (DNA) preparation of the macroeukaryotic epiphytic fraction of P. oceanica leaves Molecular approaches used in the present PhD thesis involve the preparation of desoxirribonucleic acid (DNA) from the macroeukaryotic epiphytic fraction of P. oceanica leaves. DNA preparation consists in its isolation from the rest of cell components (polysaccharides, proteins,...) and the amplification or copy of the isolated DNA (DNA template) applying Polymerase chain reaction (PCR). PCR molecular technique allows obtaining multiple copies of the entire DNA or, more frequently, a desired DNA portion (target DNA) and is composed of the repetition of three basic stages: I. Denaturation. Heating causes DNA melting of the DNA template by disrupting the hydrogen bonds between complementary bases, yielding two singlestranded DNA molecules. II. Annealing. Two designed primers (short length DNA sequences) anneal to complementary sequences of each of the single-stranded DNA molecules. It allows, in the final stage, synthesizing new and complementary single-stranded DNA molecules which contains the target DNA. III. Extension. The enzyme Taq DNA polymerase attaches to primers and synthesizes the new strands containing the target DNA. Final number of copies of the target DNA is dependent on the number of repetitions of the three stages of the PCR (2n, n = number of cycles) (Sambrook and Russell 2001a).. 30.
(31) SECTION III – Fundamentals of techniques used. The present PhD thesis assessed the structure of the macroeukaryotic epiphytic fraction of P. oceanica leaves amplifying the whole or a portion of SSU by means of PCR. SSU was selected because of its characteristics and advantages that offer against other DNA regions (see Section II-2.b). Amplification of SSU produced multiple copies of the target DNA with the same length but different sequence, mirroring the complexity of the studied sample. DNA isolated and amplified was visualized by means of agarose gel electrophoresis. Agarose gel electrophoresis is a technique that, in the presence of an electric field, allows separating DNA molecules depending on its size. Under these circumstances, DNA molecules migrate from the negative (anode) to the positive pole (cathode) because of the presence of fosfate (PO43-) groups in its structure. Migration velocity of the different DNA molecules is inversely related to its size. Migration front was observed by adding a dye to DNA molecules and the results of the electrophoresis were visualized under an ultraviolet lamp (UV) with ethidium bromide (EtBr) staining. In order to determine that DNA fragment obtained by means of PCR was the desired, we used a DNA marker that consisted on a mix of DNAs with different size. One of these DNAs had a similar size to DNA fragment obtained by PCR and their migration velocity in agarose gel should be similar if PCR was correctly developed. 4.b) Barcoding or fingerprinting techniques Barcoding or fingerprinting techniques are molecular approaches frequently applied to the study of the structure, dynamics and diversity of communities. They are based on the separation of DNA fragments, previously amplified with PCR, with the same size but different sequence in acrilamide/formamide gels either with a temperature gradient (Temperature gradient gel electrophoresis (TGGE)) or a denaturing chemicals gradient. 31.
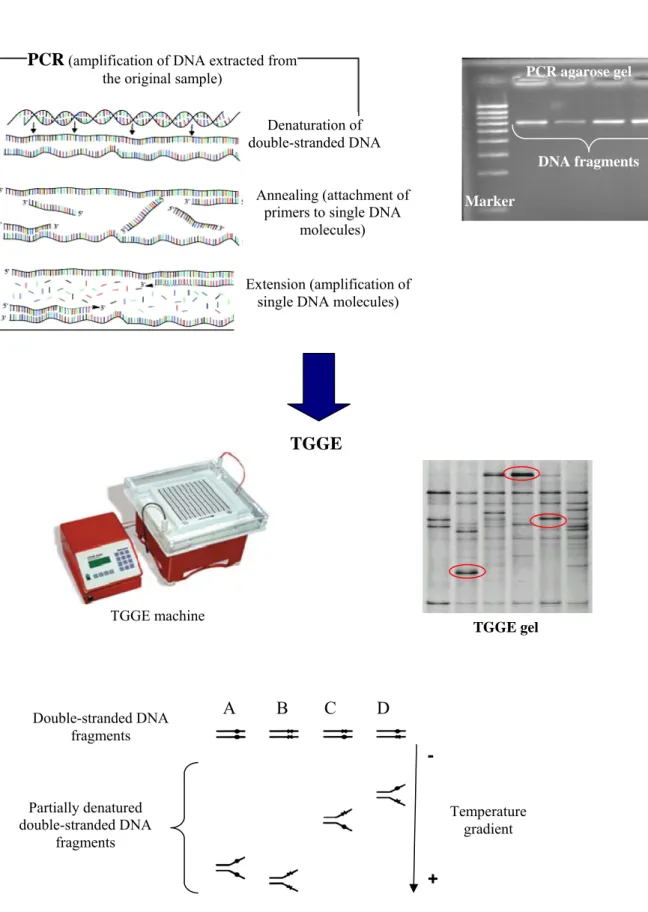
(32) SECTION III – Fundamentals of techniques used. (Denaturing gradient gel electrophoresis (DGGE)) (Muyzer and Smalla 1998; Muyzer 1999). In the present PhD thesis we amplified DNA fragments from SSU of about 600 base pairs (bp) with different sequence in TGGE gels. We chose TGGE against DGGE (analogous techniques) because the former approach allowed obtaining a clear separation of DNA fragments. TGGE is based on the fact that DNA molecule structure and, therefore, its migration velocity in agarose gels with an electric field are affected by temperature. Double-stranded DNA molecules progressively denature (depending on the composition of nitrogenised bases on its sequence) and reduce its migration velocity as they migrate to the cathode because of the temperature gradient. DNA molecules with a sequence rich in nitrogenised bases guanine (G) and cytosine (C) require a higher temperature to denature and migrate quicker in the gel. The presence of a tail rich in G and C in designed primers for PCR avoids the total denaturation of the double-stranded DNA molecules. Each of those molecules is visualized in the gel as an unique band representing a partially denatured double-stranded DNA fragment (Muyzer 1999; Gadanho and Sampaio 2004) (Fig. 6). In the present PhD thesis, bands obtained in TGGE gels were revealed using silver staining because it has proven to be more sensitive and less toxic in comparison with other methods such as EtBr staining (Radojkovic and Kusic 2000). Diversity measurements calculated from the application of TGGE (or DGGE) are based on the analysis of the band patterns obtained. These bands are commonly named molecular operational taxonomic units ((MOTUs or OTUs) (Rosselló-Móra and López-López 2008; Valentini et al. 2008), and the OTUs pattern complexity depends on the diversity of the studied community (Muyzer 1999).. 32.
(33) SECTION III – Fundamentals of techniques used. PCR (amplification of DNA extracted from. PCR agarose gel. the original sample) Denaturation of double-stranded DNA. DNA fragments Annealing (attachment of primers to single DNA molecules). Marker. Extension (amplification of single DNA molecules). TGGE. TGGE machine. Double-stranded DNA fragments. TGGE gel. A. B. C. D -. Partially denatured double-stranded DNA fragments. Temperature gradient. + Fig. 6. TGGE molecular technique diagram. A, B, C and D represent different samples. Red ellipses are different OTUs detected in TGGE gel.. 33.
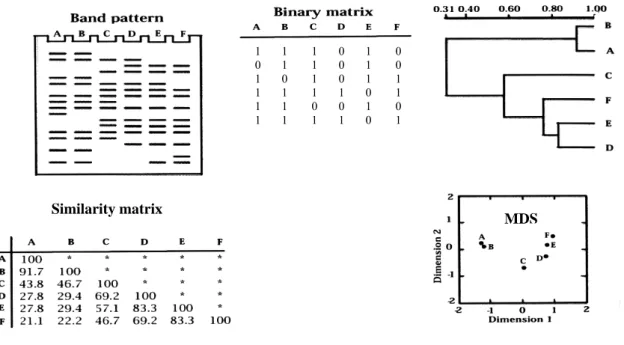
(34) SECTION III - Fundamentals of techniques used. Because of the fact that SSU are present in all living organisms (homologous genes) and in multiples copies within the genome of an individual (paralogous genes), OTUs obtained with fingerprinting techniques could hypothetically reflect the diversity of paralogous and homologous genes of a community. However, it has been observed that SSU interspecific diversity is higher than SSU intraspecific diversity (Hebert et al. 2003), and, therefore, OTUs pattern mirror taxa richness from the original sample (Muyzer 1999). Similarity among OTUs pattern from different samples in a TGGE (or DGGE) gel is calculated constructing a presence (1) – absence (0) matrix (columns = samples, rows = OTUs) and is graphically represented using a cluster or a non-metric multidimensional scaling (MDS) (Schäffer and Muyzer 2001) (Fig. 7).. Cluster. 1 0 1 1 1 1. 1 1 0 1 1 1. 1 1 1 1 0 1. Similarity matrix. 0 0 0 1 0 1. 1 1 1 0 1 0. 0 0 1 1 0 1. MDS. Fig. 7. OTUs pattern analyses. A, B, C, D, E and F represent different samples. Similarity matrix represent OTUs percentage (%) shared between two samples (from 0 (no OTUs shared) to 100 (the same OTUs pattern)). Cluster scale represents the similarity in OTUs pattern. MDS is a non-dimensional representation in which samples that are close share a high similarity of their OTUs pattern. Adapted from Schäffer and Muyzer (2001).. 34.
(35) SECTION III - Fundamentals of techniques used. 4.c) DNA libraries DNA libraries are collections of DNA sequences that represent a portion or the whole genome from an organism or a group of organisms. DNA libraries construction, as in the case of barcoding techniques, involves DNA isolation and amplification by means of PCR. The presence of universally conserved regions in 5’ and 3’ ends of DNA molecules allows the amplification of the almost complete sequence of SSU (Head et al. 1998), which offers some advantages discussed above. For those reasons, the DNA fragment selected in this PhD thesis for the construction of DNA libraries was almost the entire SSU (about 1.800 bp long). DNA libraries construction starts with the ligation phase, where DNA fragments from SSU are inserted in a vector (a DNA molecule, generally from a phage12 or a plasmid13), forming recombinant vectors by means of an enzyme ligase. Because of the fact that the percentage of recombinant vectors is never 100%, some non-recombinant vectors (DNA fragments from SSU not inserted in vector) are obtained. After that, in cloning phase, vectors (either recombinant or non-recombinant) are introduced in host cells14, where they are amplified producing a large number of copies. Each of the vectors introduced in a host cell produce a clone colony (group of clones with the same DNA sequence) and some of them are selected after a screening phase. Screening consists in selecting only clones with DNA from SSU, which allows describing the community structure. Screening is, generally, based on the fact that chosen vectors present in their structure some genes codifying for the resistance against different antibiotics or for the synthesis of different enzymes. In the present PhD tesis we used pGEM-T Easy Vector plasmid (Promega), which presented in its structure a gen codifying for the resistance against ampiciline antibiotic and the lacZ gen, codifying for. 35.
(36) SECTION III - Fundamentals of techniques used. the synthesis of β-galactosidase enzyme. When inserted in vectors, DNA fragment from SSU, avoided the lacZ gen expression, inhibiting β-galactosidase synthesis. Because of that, clones obtained were screened by means of cultures (LB as culture medium) with ampiciline, Isopropyl β-D-1-thiogalactopyranoside (IPTG) and 5-bromo-4-chloro-3indolyl-β-D-galactopyranoside (X-gal). IPTG is responsible of inducing the transcription of β-galactosidase enzyme and X-gal is a substratum hydrolyzed in the presence of that enzyme producing indoxil, which is oxidized by exposure to the air and converted in indigo (blue colour) (Sambrook and Russell 2001b). Three possibilities were possible in screening clones in this PhD thesis: 1) Clones from host cell without vector were sensitive to ampiciline and were not able to grow in LB cultures. 2) Clones from host cell with non-recombinant vector were able to grow in LB cultures because they were resistant to ampiciline. They formed blue clone colonies because of the production of indigo in the reaction catalyzed by βgalactosidase enzyme. 3) Clones from host cell with recombinant vector were able to grow in LB cultures because they were resistant to ampiciline. They formed white clone colonies because of β-galactosidase enzyme was not synthesized and indigo was not produced.. When screening is ended, sequencing and aligning of selected clones is developed. Sequence aligning is performed to compare sequences from the studied gene to detect similarities and establish evolutive or functional relationships. The construction and analyses of a phylogenetic tree with aligned sequences is the final. 36.
(37) SECTION III - Fundamentals of techniques used. phase of DNA libraries. A phylogenetic tree is a graphic representation composed of branches and nodes in which evolutive relationships among sequences from the studied gene are shown, allowing obtaining a measure of the diversity in the sample studied. Branches are lines that connect two nodes, which can be external (representing the end of a branch where sequences are located) or internal (points representing a common ancestor of two or more nodes) (Fig. 8). PCR. Long DNA fragments from SSU. DNA extraction form the original sample Recombinant vector (with DNA fragment from SSU). + Ligation Vector. Clone screening No-recombinant vector (without DNA fragment from SSU) Clones without Clones with recombinant recombinant vector vector. DNA fragment insertion on host cells (JM109 (Promega)). Sequencing (only clones with recombinant vector) Branch Internal node. Sequence alignment, phylogenetic tree construction and phylogenetic relationship analyses. External node Fig. 8. DNA library construction and analyses based on SSU used in this PhD thesis.. 37.
(38) SECTION III - Fundamentals of techniques used. Methods most frequently used for phylogenetic trees construction are: •. Distance methods, such as “Neighbor-Joining” (NJ).. •. “Maximum Parsimony” (MP).. •. “Maximum Likelihood” (ML).. NJ is the most used distance method. Distances calculated among sequences using NJ are commonly based on Jukes-Cantor evolutive model. Jukes-Cantor model assumes that (i) the frequencies of the different nucleotides in a sequence is the same and (ii) nucleotide substitution rate is the same and independent of the identity of the nucleotide. To obtain a distance value d (d = -3/4 Ln [1-(4p/3)]) between two sequences applying Jukes-Cantor correction, firstly it is necessary to calculate distance p, which is the combination of the number of differences between two sequences divided by total number of positions considered in the sequence. Distance matrix is used by NJ algorithm to generate the phylogenetic tree. However, MP and ML methods are more powerful and accepted in scientific community. MP method takes all the sequences and generates multiple phylogenetic trees, which are evaluated following the criterion that the best explanation is the most simple. The final topology is the one that requires less number of evolutive changes (such as nucleotide substitutions or mutations) to explain differences observed among different sequences. In the same way, ML method uses original nucleotide sequences data to generate and evaluate multiple trees. A likelihood value, which is inversely related to accumulated evolutive changes, is calculated for each topology. For a determined topology, the total probability is calculated as a product of the likelihood in each. 38.
(39) SECTION III - Fundamentals of techniques used. alignment position (taking into account the frequency of each nucleotide and the probabilities of transition15 / transversion16 according to the chosen evolutive model). Contrasting to other methods, ML assumes that each sequence position can independently evolve and the evolution rate can vary from some lineages to others. The exhaustive evaluation of all possible topologies (for instance, 2.8x1074 trees with only 50 sequences) is generally impossible and ML represents, in most of the cases, the best approach to the optimal topology (Head et al. 1998; Sambrook and Russell 2001b; Hall 2004; Fuhrman 2008). 4.d) Advantages and limitations of molecular barcoding techniques and DNA libraries construction in the description of community structure. Molecular barcoding techniques and DNA libraries construction present some advantages and limitations related to study the community structure. On the one hand, barcoding methods are more appropriated to study community succession because they simultaneously allow processing an elevated number of samples being less timeconsuming and more economic. DNA fragments belonging to SSU for barcoding techniques must contain phylogenetically informative regions (regions with a nucleotide sequence variable among species) to detect the presence of different taxa in the original sample (Valentini et al. 2008). On the other hand, DNA library construction is a more powerful approach because it is phylogenetically more informative (as they generally works with longer and more quality DNA sequences) (Head et al. 1998; Muyzer 1999; Fuhrman 2008), being more appropriated to analyse deeply the community structure.. 39.
(40) SECTION III - Fundamentals of techniques used. 5. Relationship between structure/ diversity of macroalgal epiphytic component of P. oceanica and NR activity (as a measure of nitrogen assimilation capacity) NR activity measurements in scientific literature have been performed following “in vivo” or “in vitro” methods. The main difference between them is that the former one is based on the tissue permeabilization to allow the contact of a buffer solution containing NO3- with cells, where NO3- is reduced to NO2- using endogenous nicotinamide adenine dinucleotide (NADH) in a reaction catalysed by NR enzyme. On the contrary, “in vitro” method consists on tissue homogenising allowing the release of the NR enzyme in a buffer solution, and the subsequently NR activity measurement with a colorimetric method in an assay solution containing NO3- and NADH. Extraction buffer is the responsible of this tissue homogenisation and NR release, whereas assay solution contains the necessary reagents (NO3- and NADH) to reduce NO3- to NO2-. After the incubation phase, reagents inhibiting NR enzyme activity are added and NO2concentration is measured in a spectrophotometer with a colorimetric method, obtaining NR activity as a function of NO2- concentration, biomass and time (Fig. 9). The major limitation of “in vivo” against “in vitro” methods is the unknown NO3- diffusion rates from outside to inside cells and NO2- diffusion rates from inside to outside the cells (Lartigue and Sherman 2002). In the present PhD thesis, we adapted an “in vitro” method to measure NR activity (Scheible et al. 1997), because it allowed us controlling some factors, such as temperature, that can modify this enzymatic activity.. 40.
(41) SECTION III - Fundamentals of techniques used. A. B. C. D. Fig. 9. Colorimetric method to measure NR using an “in vitro” technique. After incubating samples with a buffer solution containing NO3- and NADH, reagents are added to measure NO2concentration in a spectrophotometer with a colorimetric method. A, B and C are three replicates from a sample and D is a control used to determine NO2- concentration present in tissues previously to perform the assay. NR activity is expressed as the average of NO2- concentration in A, B and C tubes (substracting that from control tube) per biomass and time.. 41.
(42) SECTION IV – Chapter 1. Detail of old P. oceanica leaf. Optimisation of a molecular fingerprinting technique (TGGE) to the study of the structure of the macroeukaryotic epiphytic fraction of P. oceanica leaves. 42.
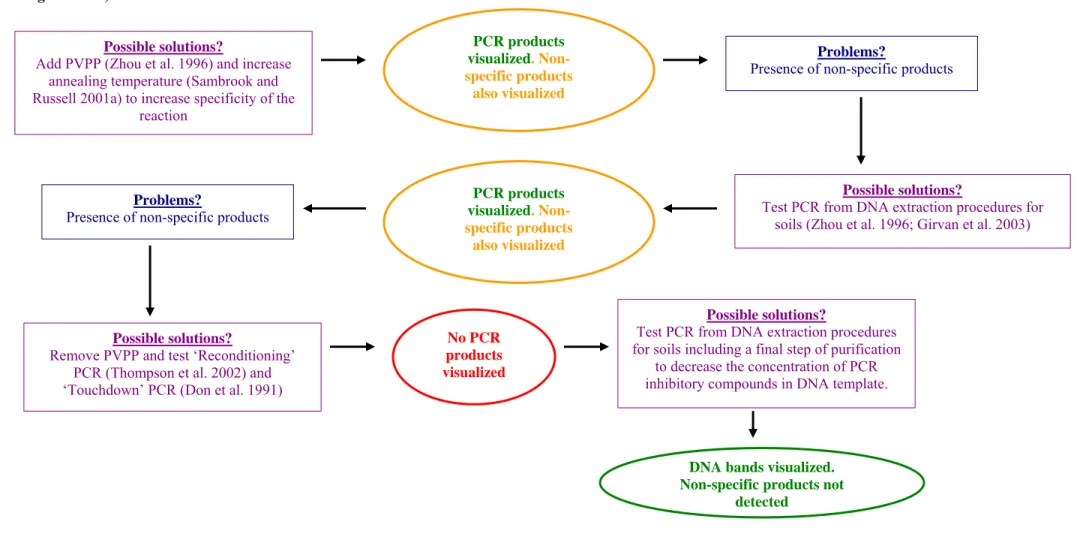
(43) SECTION IV – Chapter 1. Optimisation of a molecular fingerprinting technique (TGGE) to the study of the structure of the macroeukaryotic epiphytic fraction of P. oceanica leaves. Background The application of a molecular fingerprinting technique to the study of the structure of a community requires the previous extraction of DNA of enough quality and quantity. This has been recognised to be a major achievement in order to guarantee successful results (Head et al. 1998). There are many published procedures for extracting DNA from different communities, which use different physical (i.e. freezing, thawing, bead beating) and/or chemical treatments (lysis with detergents) to release DNA (Díez et al. 2001; Foucher and Wilson 2002; Gadanho and Sampaio 2004). The selection of an appropriate DNA extraction procedure from the macroeukaryotic epiphytes of P. oceanica leaves must take into account that macroalgae are the most abundant and diverse component of this fraction (Lepoint et al. 1999; Borowitzka et al. 2006). DNA extraction of enough quality and quantity from different macroalgae has previously proven to be difficult because of the co-extraction of polysaccharides and secondary metabolites that can inhibit the subsequent PCR reaction (Hong et al. 1997; Vidal et al. 2002; Varela-Álvarez et al. 2006). Furthermore, a procedure that allows obtaining successful results with one macroalgae group often fail with others, probably because of the differences in their cell wall composition, and that of storage and secondary compounds (Doyle 1990; Hong et al. 1997). The optimisation of the subsequent PCR is another relevant matter to obtain successful results. It includes the selection of the adequate target regions within the SSU genes, designing of the primers targeting the selected regions and identification of the. 43.
(44) SECTION IV – Chapter 1. PCR conditions that are appropriate to detect the diversity from the studied sample. The selection of the SSU gene regions to amplify must follow some criteria: (1) they must contain regions nearly identical among individuals of the same species, but different between species, and other regions highly conserved between species, (2) they must be phylogenetically informative and (3) they must have the correct size to apply the subsequent molecular approach that allows detecting the diversity from the studied sample (Valentini et al. 2008). The design of primers complementary to the selected target regions inside SSU is another key point to obtain an optimal amplification. Ideally, designed PCR primers should have between 40-60% GC content and both should be similar in size (18-25 bp), in melting temperatures (Tm)17 and in nucleotide ratios. For fingerprinting techniques (DGGE and TGGE), one of both primers should contain a 3'-terminal GC clamp (at least one or two 3' G’s and/or C’s nucleotides). In addition, they should be free of repetitive motifs18, palindromes19, excessive degeneracy20, and long stretches of polypurines21 or polypyrimidines22 (Roux 1995). Although slight deviations from these recommendations are allowed, several useful computer programs have been developed to design efficient PCR primers (PrimerBLAST,. National. Center. for. Biotechnology. Information. (NCBI),. http://www.ncbi.nlm.nih.gov/tools/primer-blast/). Other factors that could be necessary to optimize for amplification purposes are the DNA template quantity and magnesium (Mg2+) concentration in the amplification buffer, pH and cycling conditions (i.e. changes in annealing temperature, which is dependant on primer Tm values and in number of cycles). On the one hand, the increase in DNA template may increase number of amplicons (or PCR products) obtained but it also may increase the presence of inhibitors of the PCR. In addition, a decrease in annealing temperature and an. 44.
(45) SECTION IV – Chapter 1. increase in number of cycles may also increase in number of amplicons obtained but it also might produce a decrease in the specificity of the reaction (Roux 1995). Finally, the addition of different reagents, such as dimethyl sulfoxide (DMSO), glycerol, non-ionic detergents and formamide, have also showed to increase the specificity of the PCR (Roux 1995; Sambrook and Russell 2001a). Some factors also need to be optimized in the selected fingerprinting technique (in this PhD thesis, TGGE). The most important are the temperature gradient, the quality and quantity of DNA fragments used, and the staining method of the gel. The optimisation of the temperature gradient is relevant to obtain a clear resolution of the amplicons in TGGE gel (i.e. a narrow gradient may produce a better segregation between bands than a wide one, but wide gradients may show more defined bands) (TGGE Maxi System Manual, Biometra, http://www.biometra.com). The staining method of the gel is also a relevant factor that should be optimized. The most used nucleic acids-staining procedures in literature have been silver-staining, EtBr, SYBR Green and SYBR Gold methods (Muyzer et al. 1993; Heuer et al. 1997; Muyzer et al. 1997; Harper et al. 2006). The silver-staining procedure has been found as the most sensitive method in the detection of DNA bands in fingerprinting gels (Felske et al. 1996; Radojkovic and Kusic 2000). In addition, this method has been shown to be more economic than EtBr staining procedure (Radojkovic and Kusic 2000). SYBR Green/Gold staining methods, which are economically more expensive, have been recognised as alternative procedures to silver-staining and EtBr methods because of the lack of background staining and the detection of DNA bands even at very low concentrations (Muyzer and Smalla 1998).. 45.
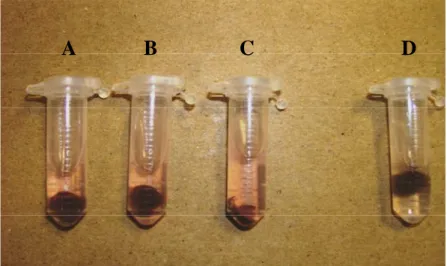
(46) SECTION IV – Chapter 1. Our main goal is the optimization of the complete molecular fingerprinting protocol (DNA extraction, PCR, TGGE and staining method) to study the structure of the macroeukaryotic epiphytic fraction of P. oceanica leaves. The obtained molecular protocol could be used as an alternative approach to classical dissecting microscope/optical microscope methods to study this epiphytic fraction. Materials and methods 1.- DNA extraction with DNeasy Plant Mini Kit and subsequent PCR. P. oceanica shoots collected in the field were gently scraped with a clean razorblade and filtered with sterile seawater to isolate the macroeukaryotic epiphytic fraction. Before that, these shoots were distributed in three different methods of preservation after arrival to the lab: i.e. directly frozen at -20ºC, stored in 4% formaldehyde seawater and stored at 4ºC. Epiphytic DNA was extracted using a commercial kit for DNA extraction from terrestrial plants (DNeasy Plant Mini Kit (Qiagen)). First assay. Epiphyte cells (about 0.1 g Fresh weight (FW)) were broken following two procedures: (1) using pipette tips followed by a cycle of freezing (15 min at -80ºC) and thawing (5 min at 65ºC); and (2) vortexing the cell material with 5 mm stainless steel beads for 3 min (Qiagen). Simultaneously, DNA extractions from fresh cypress leaves (Cupressus sempervirens) and from fresh different Rhodophyta (Spiridea spp., Padina pavonica, Peyssonellia spp.) were done as controls following the same assayed procedure. DNA extractions were run in 1% (wt/v) agarose gel, stained with EtBr at least during 10 min and visualized under an UV light. Second assay. Fresh cypress leaves, fresh Rhodophyta and epiphytes were disrupted following a more aggressive procedure: two cycles of freezing (15 min at -80ºC) and thawing (5 min at 65ºC) followed by three ultrasonication cycles (5 min at 40 KHz), and. 46.
(47) SECTION IV – Chapter 1. finally vortexing with 5 mm stainless steal beads for 3 min. DNA extractions were visualized as above mentioned. For both assays, PCR was done using 1 µl DNA template in a final volume of 20 µl using Master Mix (Eppendorf) according to manufacturer’s instructions. 5% DMSO was also added to the reaction. The two universal primers designed for eukaryotic SSU amplification, Euk1A/516r-GC and EukA/B, were tested (Díez et al. 2001). We also tested two different PCR programs. The first one included an initial denaturation at 94°C for 130 s, followed by 30 cycles of denaturation at 94°C for 30 s, annealing at 55°C for 45 s, and extension at 72°C for 130 s, with a final extension step of 72°C for 10 min. The second PCR program included an initial denaturation at 94°C for 3 min, followed by 30 cycles of denaturation at 94°C for 30 s, annealing at 55°C for 1 min, and extension at 72°C for 3 min, with a final extension step of 72°C for 10 min. PCR products were visualized under an UV light in a 2-3% (wt/v) MS-8 agarose gel (Pronadisa) after staining with EtBr. Molecular weight DNA marker used was λ/HindII-Eco RI (Durviz). 2.- DNA extraction following procedures designed for samples with high concentrations of secondary compounds (aromatic plants and algae) and subsequent PCR First assay. DNA extraction from epiphytes was performed following Wattier et al. (2000) procedure. Samples were broken by means of agitation (11.000 rpm during 6 min at room temperature) followed by vortexing with 5 mm stainless steel beads for 3 min. Two parallel tests were done, the first one strictly following the DNA extraction procedure from Wattier et al. (2000), and the second just changing centrifuging conditions (to 3900 rpm for 30 min) of the same procedure. DNA extractions were visualized as above mentioned.. 47.
(48) SECTION IV – Chapter 1. Second assay. DNA extraction from epiphytes was performed following Khanuja et al. (1999) procedure. Samples were broken using liquid nitrogen followed by mixing with vortex and 5 mm stainless steel beads. The composition of cethyl trymethylammonium bromide (CTAB) buffer cited in Khanuja et al. (1999) was slightly modified (2% CTAB, 2% polyvinylpirrolidone (PVP), 1.4 M sodium chloride (NaCl), 20 mM ethylenediaminetetraacetic acid (EDTA) (pH = 8), 100 mM Tris-hydrochloric acid (Tris-HCl) (pH = 8), 2% 2-mercaptoethanol). DNA extractions from leaves of terrestrial plants (Brassica oleracea, C. sempervirens and Rosmarinus officinalis) were also done as controls. DNA extractions were visualized as above mentioned. 3.- DNA extraction following procedures designed for soils and subsequent PCR First assay. DNA extraction from epiphytes and terrestrial plants (B. oleracea, C. sempervirens and R. officinalis) was performed following Girvan et al. (2003) procedure. A higher amount of sample was used (about 1 g FW) in comparison with assays explained above. Samples were broken using two different protocols: (1) two cycles of freezing (10 min at -80ºC) and thawing (10 min at 65ºC) followed by vortexing with 5 mm stainless steel beads for 3 min; and (2) freezing the sample with liquid nitrogen followed by vortexing with 5 mm stainless steel beads for 3 min. DNA extractions were visualized as above mentioned. Second assay. DNA extraction from epiphytes was performed following Girvan et al. (2003) procedure. This procedure was modified using two alternatives: (1) addition of 0.1 g PVP g-1 epiphyte FW and (2) addition of a CTAB buffer (1 ml CTAB buffer g-1 epiphyte FW). CTAB buffer composition was 2% CTAB, 2% PVP, 1.4 M NaCl, 20 mM EDTA (pH = 8), 100 mM Tris-HCl (pH = 8), 2% 2-mercaptoethanol. Samples were broken using two cycles of freezing (10 min at -80ºC) and thawing (10 min at 65ºC). 48.
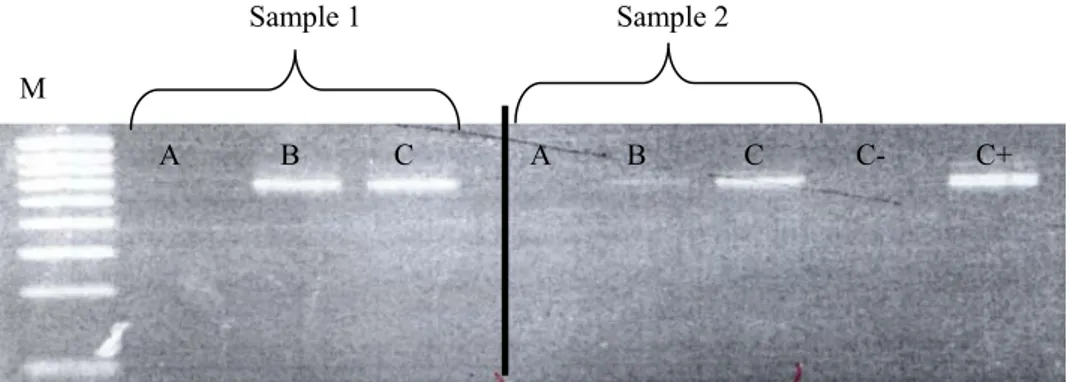
(49) SECTION IV – Chapter 1. followed by mixing with vortex and 5 mm stainless steel beads. DNA extraction was visualized as above mentioned. Third assay. DNA extraction from epiphytes and different algae (Udotea spp. and Corallina spp.) was performed following Zhou et al. (1996) procedure. Samples were broken using liquid nitrogen followed by agitation with vortex and 5 mm stainless steel beads. DNA extraction was visualized as above mentioned. A PCR was performed using DNA extracted using protocols optimised for soils. PCR was done using 1 µl DNA template in a final volume of 20 µl using Master Mix (Eppendorf) according to manufacturer’s instructions. 5% DMSO was also added to the reaction. Sets of primers used were EukA/B and Euk1A/516r-GC (Díez et al. 2001) and PCR program included an initial denaturation at 94°C for 3 min, followed by 30 cycles of denaturation at 94°C for 30 s, annealing at 55°C for 1 min, and extension at 72°C for 3 min, with a final extension step of 72°C for 10 min. PCR products were visualized as above mentioned. Fourth assay. DNA extraction from epiphytes was performed following Zhou et al. (1996). Samples were broken using liquid nitrogen followed by agitation with vortex and 5 mm stainless steel beads. Finally, a step of purification using DNeasy Plant Mini Kit (Qiagen) was performed. DNA extraction was visualized as above mentioned. A PCR was performed using DNA extracted from the fourth assay using a protocol optimised for soils. PCR was done using a Master Mix (Eppendorf) in a final volume of 20 µl according to manufacturer’s instructions. A total of 5% DMSO was also added to the reaction and DNA template was increased (2 µl) in comparison with previous PCR. We used the set of primers EukA/B (Díez et al. 2001) and Euk1A/New 516r-GC. Euk/New 516r-GC resulted as a modification of primer Euk 516r-GC (Díez et. 49.
(50) SECTION IV – Chapter 1. al. 2001), in which the nitrogenised base at the 3’ position was removed. ARB-SILVA database (http://www.arbsilva.de, Pruesse et al. 2007) from ARB package (http://www.arb-home.de, Ludwig et al. 2004) allowed us to design that new primer, which was more appropriated to detect a wider spectrum of Rhodophyta, a relevant component of the macroeukaryotic epiphytic fraction of P. oceanica leaves (Van der Ben 1971; Ballesteros 1987). PCR program included an initial denaturation at 94°C for 130 s, followed by 30 cycles of denaturation at 94°C for 30 s, annealing at 54°C for 45 s, and extension at 72°C for 130 s, with a final extension step of 72°C for 10 min. PCR products were visualized as above explained. A new PCR was tested in order to diminish the concentration of PCR inhibitors. PCR was done using a Master Mix (Eppendorf) in a final volume of 20 µl according to manufacturer’s instructions. A total of 5% DMSO and polyvinylpolyipirrolidone (PVPP) (about. 0.12 μg μl-1) (Zhou et al. 1996) were also added to the reaction. DNA template was 2 µl. Sets of primers used were EukA/B (Díez et al. 2001) and Euk1A/New 516r-GC. PCR program included an initial denaturation at 94°C for 3 min, followed by 30 cycles of denaturation at 94°C for 30 s, annealing at 44°C for 60 s, and extension at 72°C for 2 min, with a final extension step of 72°C for 10 min. PCR products were visualized as above mentioned. We finally tested another modification of PCR, in where different dilutions (1:10, 1:50, 1:100) of DNA template were used in order to diminish the concentration of PCR inhibitors. Sets of primers, PCR conditions and PCR program was the same as above. PCR products were visualized as above mentioned. We discarded set of primers Euk A/B as the combination Euk1A/New 516r-GC allowed an optimal DNA fragment (about 600 bp long) for the application of a. 50.
Figure
+7
Documento similar
The concentration values are given in percentage and they are calculated as Fraction extracted (mg compound in extract/mg compound in dry tea leaves), extraction yield (mg compound/g
In particular, the fact that the energy and the momentum are not functions of the helicity does not con- tradict our main theorem, because they are conserved by the evolution
Functional diversity is a component of biodiversity and expresses the degree of functional differences among species (i.e., the way in which they use resources). Even though
The differing responses of the roots to drought and infection were reflected in the early reduction of photosynthetic activity and relative changes in biomass allocation under
it is most unlikely that they were written anywhere but where they were found; and we can therefore be sure that the Palace of Thebes falls into the pattern of other Mycenaean
establish, partly because few studies are designed to cover a signifi cant fraction of species spatio-temporal variability. In the present work we analyze variation in vital rates
Heterogeneous catalysts are the most used in industry because they present several advantages such as easy post reaction separation, high
The majority of Hox genes of the a, b and c clusters are preferentially expressed in HSC-enriched subpopulations and in immature progenitor compartments and they are down-
