1
DIFFERENTIAL ANALYSIS OF GENOME-WIDE METHYLATION AND GENE EXPRESSION IN MESENCHYMAL STEM CELLS OF PATIENTS WITH FRACTURES
AND OSTEOARTHRITIS
Alvaro del Real1*, Flor M. Pérez-Campo 1,2*, Agustín F. Fernández3, Carolina Sañudo1, Carmen G. Ibarbia1, María I. Pérez-Núñez4, Wim Van Criekinge5, Maarten Braspenning6, María A. Alonso4, Mario F. Fraga3 and Jose A. Riancho1
* Alvaro del Real and Flor M. Pérez-Campo contributed equally to this study.
1 Department of Medicine and Psychiatry, University of Cantabria, and Service of Internal Medicine,
Hospital U.M. Valdecilla-IDIVAL, Santander, Spain.
2 Present address: Department of Molecular Biology. University of Cantabria, Santander, Spain. 3 Cancer Epigenetics Laboratory, Institute of Oncology of Asturias (IUOPA), HUCA, University of
Oviedo, Oviedo. Spain.
4 Service of Traumatology and Orthopedic Surgery, Hospital U.M. Valdecilla, University of Cantabria,
Santander, Spain.
5 Mathematical Modelling, Statistics and Bio-informatics, Faculty Bioscience Engineering, University
Ghent, Coupure Links 653, 9000 Gent, Belgium.
6 NXT-Dx, Fr. Rooseveltlaan 349/B.43, 9000 Gent, Belgium.
ADDRESS CORRESPONDENCE TO:
José A. Riancho, Department of Medicine and Psychiatry, University of Cantabria. Av Valdecilla sn. 39008 Santander, Spain
Tel +3442201990 Fax +34942201695 Email: [email protected]
2
ABSTRACT
Insufficient activity of the bone-forming osteoblasts leads to low bone mass and predisposes to fragility fractures. The functional capacity of mesenchymal stem cells (hMSCs), the precursors of osteoblasts, may be compromised in elderly individuals, in relation with the epigenetic changes associated with aging. However, the role of hMSCs in the pathogenesis of osteoporosis is still unclear. Therefore we aimed to characterize the genome-wide methylation and gene expression signatures and the differentiation capacity of hMSCs from patients with hip fractures. We obtained hMSCs from the femoral heads of women undergoing hip replacement due to hip fractures and controls with hip osteoarthritis. DNA methylation was explored with the Infinium 450K bead array. Transcriptome analysis was done by RNA sequencing. The genomic analyses revealed that most differentially methylated loci were situated in genomic regions with enhancer activity, distant from gene bodies and promoters. These regions were associated with differentially-expressed genes enriched in pathways related to hMSC growth and osteoblast differentiation. hMSCs from patients with fractures showed enhanced proliferation and up-regulation of the osteogenic drivers RUNX2/OSX. Also, they showed some signs of accelerated methylation aging. When cultured in osteogenic medium, hMSCs from patients with fractures showed an impaired differentiation capacity, with reduced alkaline phosphatase and poor accumulation of a mineralized matrix. Our results point to two areas of potential interest for discovering new therapeutic targets for low bone mass disorders and bone regeneration: the mechanisms stimulating MSCs proliferation after fracture and those impairing their terminal differentiation.
RUNNING TITLE: Transcriptome and Methylome Analysis of MSCs in Fractures and
Osteoarthritis.
3
INTRODUCTION
Osteoporotic hip fractures have a particularly negative impact on the patients’ quality of life and life expectancy. The pathogenetic mechanisms of osteoporosis are not completely understood, but they imply an imbalance in bone remodelling, with a predominance of bone resorption over bone formation. Osteoblasts are the cells responsible for bone formation. Human mesenchymal stem cells (hMSCs) are pluripotent cells capable of differentiating into osteoblasts, chondrocytes, adipocytes and myoblasts. Therefore, hMSCs are the subject of considerable interest from a double perspective. On the one hand, hMSC malfunction may be involved in the pathogenesis of osteoporosis 1,2. Thus,
elucidating the mechanisms involved in hMSCs proliferation and differentiation could point to new drug targets to improve osteoblast function in osteoporotic patients. On the other hand, the infusion of hMSCs could theoretically improve bone formation systemically or locally. A few studies tried to characterize hMSCs from patients with osteoporosis, but the results are controversial 3–5. Therefore, much more basic research is needed to characterize hMSCs in osteoporosis prior to use them for the treatment of skeletal disorders.
Epigenetic mechanisms play an important role in skeletal biology. In particular, DNA methylation has been shown to modulate the differentiation of cells towards the osteoblastic lineage 6,7. Thus, it is tempting to speculate that changes in DNA methylation influence the differentiation capability of hMSCs in osteoporosis. However there are only scarce data about the methylation signature of skeletal hMSCs. Therefore, we aimed to perform a genome-wide methylome analysis of hMSCs from patients with hip fractures and explore the functional consequences at the transcriptome level and the ability to proliferate and differentiate in vitro.
4
RESULTS
Isolation and characterization of hMSCs
We had similar success rate in establishing an hMSC culture with samples obtained from patients with fractures (27 out of 41, 66%) or with OA (22 out of 32, 69%). The hMSC phenotype was confirmed by flow cytometry using a combination of markers (CD45-, CD34-, CD90+, CD73+, CD105+) that define the phenotype of bone marrow hMSCs 2(Supplemental Fig. S1).
DNA methylation profiling
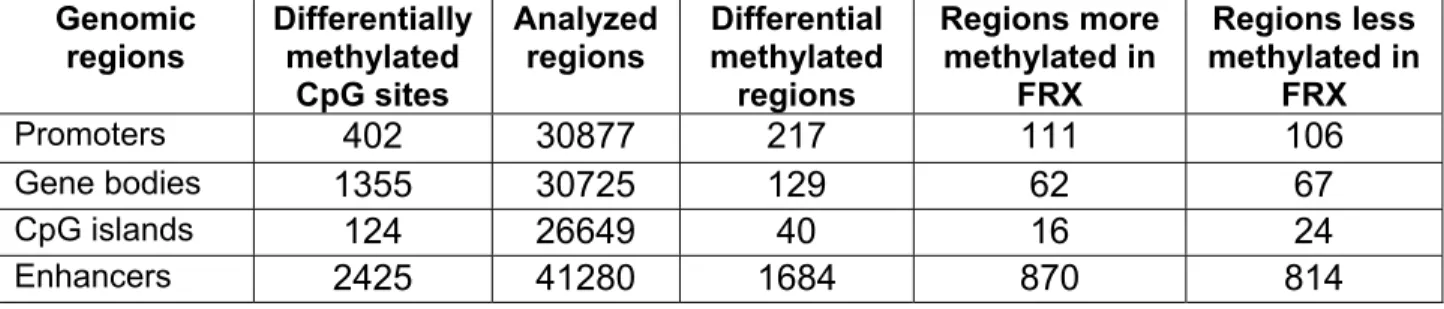
When the interrogated CpGs were grouped according to their genomic position, gene bodies were more methylated than CG islands or gene promoters (Supplemental Figs. S2 and S3). The average methylation level was similar in both study groups. Nevertheless, among the 477708 sites explored, we found 9038 differentially methylated CpG sites. Of them, 4417 were more methylated and 4621 were less methylated in samples obtained from osteoporotic patients with hip fracture (FRX). Among the differentially methylated CpG sites, 1586 sites were located in CpG islands, 1105 in shores, 353 in shelves and 5994 sites in open sea.
The analysis at the region level revealed 217 out of 30877 gene promoters with differential methylation, which correspond to 71 protein coding genes, of a total of 21191 different genes, including 111 more methylated and 106 less methylated in FRX. Regarding gene bodies, 62 were found more methylated and 67 less methylated in FRX. Among CG islands, 16 were more methylated and 24 less methylated in FRX (Table 1 and Supplemental Fig. S4).
5
Differential methylated sites were enriched in enhancers regions (which included 2425 of the 9038 differentially methylated CpGs). The distances to the transcription start sites (TSSs) are shown in Supplemental Figure S5. The region level analysis revealed 1684 differential methylated gene enhancer regions; 870 regions (associated with 722 protein-coding genes) were hypermethylated and 814 (678 genes) were hypomethylated in FRX in comparison with OA (Supplemental Table S1 and Figure 1A). Most FRX and OA samples tended to be grouped in common clusters, but there was some degree of overlapping, as shown in Fig. 1B. Genes with differentially-methylated enhancers were overrepresented among pathways related to stem cell development and bone-related pathways, like the Wnt receptor signaling pathway (p=4.5x10⁻⁸ binomial test), regulation of osteoblast differentiation (p=9.1x10⁻⁵), regulation of hMSCs proliferation (p=7.6x10⁻⁶) and bone mineralization (p=7.6x10⁻⁴) pathways (Supplemental Fig. S6).
Gene expression analysis
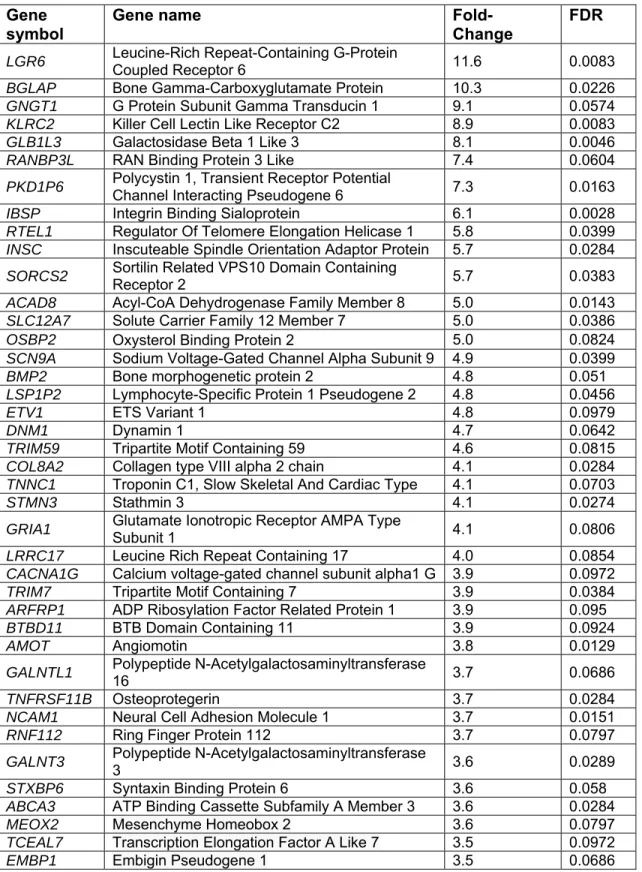
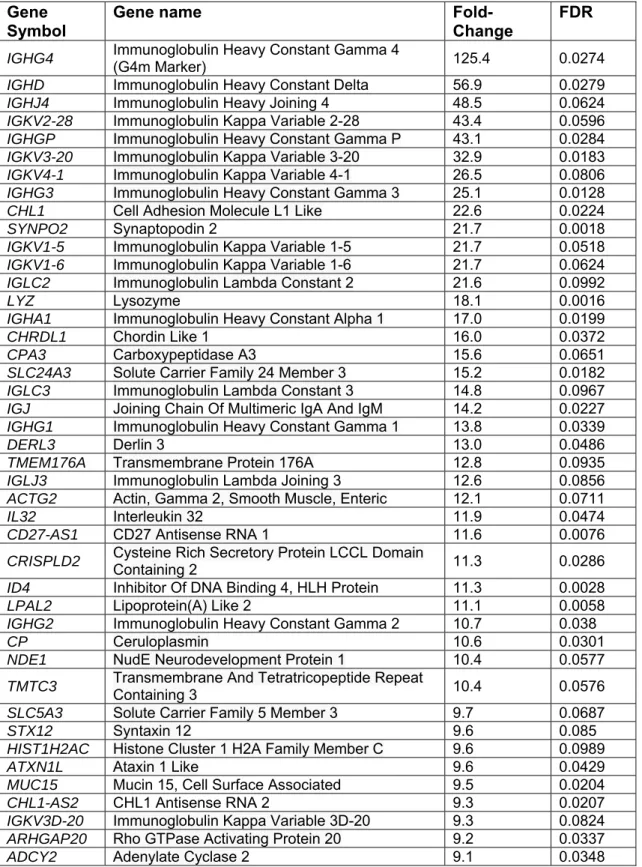
Overall, 11390 genes were expressed in both FRX and OA samples, whereas 496 genes were expressed only in FRX and 1695 in OA. As expected, the gene expression signature was typical of hMSCs (Supplemental Table S2). Overall, 99 protein-coding genes were up-regulated in FRX (FDR<0.10 and fold-change>2), whereas 239 were down-regulated (Supplemental Fig. S7 and Supplemental Table S3). The top 50 up- or down-regulated genes are shown in Tables 2 and 3.
Among genes with differential expression, those up-regulated in FRX were enriched in pathways related to hMSCs differentiation and bone formation, whereas those down-regulated in FRX were enriched in pathways related to the immune response, among others (Supplemental Table S4).
6
Genes with differentially methylated enhancers were overrepresented among those showing differential expression (19.8% versus 9.2% in those without differential expression; p=1.2x10⁻¹⁰). The direction of the association was variable, but there was a trend for an inverse correlation between enhancer methylation and expression (Odds Ratio [OR] 0.3; 95% confidence interval 0.12-0.99;
p=0.05). This is schematically depicted in Fig. 2A, showing that 18 genes up-regulated in FRX had
differentially methylated enhancers, 8 hypermethylated and 10 hypomethylated. On the other hand, 55 genes down-regulated in FRX had differentially methylated enhancers; 39 hypermethylated and 16 hypomethylated. Examples of the individual values of expression and methylation of some genes are shown in Supplemental Fig. S8. The comparative Gene Ontology Enrichment analysis revealed that genes with hypomethylated enhancers and up-regulated expression in fractures were overrepresented in pathways related to hMSCs proliferation, osteoblast differentiation and bone mineralization, as well as some neuron-related pathways (Figure 2B and Supplemental Figure S9).
Validation of expression and methylation differences across groups
We confirmed, by qPCR, the expression pattern of 10 genes among those that showed differential expression in the RNAseq analysis (SPARC, LOXL2, FOXP2, LAMC1, SLC5A3, OPG, ID2, LASP1,
IGFBP4 and UNC5B), including 8 samples previously analysed by RNAseq and 19 new samples.
There were strong correlations in the individual results obtained with both techniques (Supplemental Figs S10 and S11). Similarly, to validate the results obtained with the 450k array, we analysed by pyrosequencing four genes showing differential methylation according to array data analysis (Supplemental Figure S12).
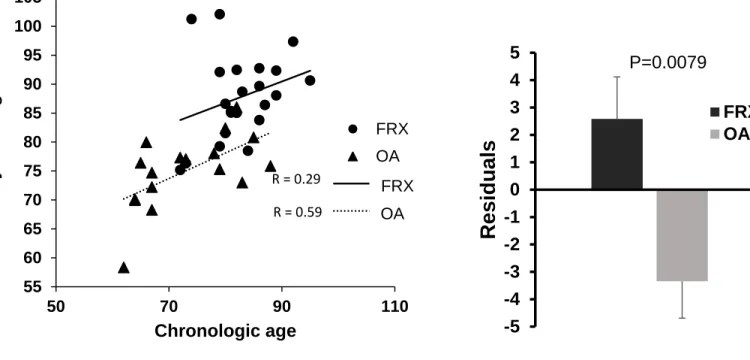
7
We studied the DNA methylation aging in our samples by using a software based on Illumina DNA Infinium 450K data that analyses a set of genes showing age-related changes in methylation. There was a significant correlation between the epigenetic age and the chronological age (r=0.64, p=1.357e-05). The slopes of the regression lines were similar in both patient groups (Figure 3, left panel), but the lines were vertically displaced. Therefore, when the regression was computed with both groups combined, the deviations of the epigenetic age from the chronological age were higher in the FRX group than in the OA group, thus suggesting accelerated epigenetic aging in the former (Fig. 3, right
panel).
Proliferative capability of hMSCs
Interestingly, the proportion of actively-dividing, Ki-67 positive cells was significantly higher among hMSCs grown from patients with FRX (Figure 4A). These results agreed with those obtained from a MTT assay, which confirmed a higher proliferation rate in hMSCs cultures established from patients with fractures (Figure 4B).
Transcriptional signature and bone differentiation capacity of hMSCs
Analysis of the gene expression levels of a set of osteogenic and adipogenic markers showed significant differences in the expression levels of key osteogenic genes (Figure 4C), such as OSX,
ALPL, SPP1 and BGLAP, between patients with osteoporotic fractures and OA. These data agreed and
validated the previously shown results from the RNAseq analysis. Interestingly, OSX, a key transcription factor expressed in the first stages of osteoblast development was significantly up-regulated in hMSCs from patients with FRX whereas collagen expression was similar in both groups. Markers, such as ALPL and SPP1, normally expressed later on during the osteogenic differentiation process, were down-regulated in hMSCs isolated from patients with osteoporotic fractures. On the
8
other hand, adipogenic markers, such as PPARG and LPL, were expressed less abundantly in patients with fractures than in those with OA (Fig. 4C).
In line with their hMSC phenotype, the cells were able to differentiate normally into adipocytes and osteoblasts (Fig. 5A). However, there were marked differences between groups and the capacity to form a mineralized matrix was markedly diminished in hMSCs from patients with FRX (p=0.00015; Fig. 5B). The alkaline phosphatase activity in hMSC cultures from FRX was also much lower than in cultures of OA origin (Fig. 5C), and there was a correlation between alkaline phosphatase activity and matrix mineralization (Spearman’s rho 0.84, p<0.001). On the other hand, there was a tendency for enhanced OSX and RUNX2 expression in FRX cells (Fig. 5D).
DISCUSSION
We have previously shown that modifications in DNA methylation play a central role in the differentiation of cells along the osteoblastic lineage and that genes related to skeletal development are differentially methylated in bone samples of patients with osteoporotic fractures 8. In the present study,
we explored the epigenome of hMSCs in patients with fractures. To our knowledge, this is the first study combining epigenome-wide and transcriptome-wide analyses of hMSCs in osteoporosis. We established that the methylation signatures of hMSCs from patients with fractures and OA show significant differences at the enhancer regions of a number of genes related to cell proliferation and differentiation.
Our study has some limitations. The method used does not allow distinguishing methylated and hydoxymethylated cytosines. Due to practical reasons, we isolated hMSCs from the bone marrow of OA patients rather than normal bone marrow as comparison controls. Nevertheless, it has been suggested that MSCs from OA patients have similar proliferation and osteogenic differentiation
9
capacity to MSCs from healthy donors 9. Also, we removed the subchondral region, thus trying to avoid the potential influence of the changes taking place in the subchondral bone 10. Aging is associated with methylation differences in some genes 11 and patients with fractures were somewhat
older than those with OA. Nevertheless, we adjusted the results including age as a covariate to avoid any age-related bias. Also, due to the low percentage of hMSCs in bone marrow (less than 1/10,000 to 1/100,000) hMSCs needed to be expanded in vitro prior to the analysis. However, to avoid changes in the epigenome signature that could bias the results, in vitro expansion was kept to a minimum and only cells at first passage were used for the analyses.
The classical view of DNA methylation tended to associate increased methylation with decreased gene expression and vice versa. However, our results confirm that the relationship between methylation and expression is indeed variable. Although increased methylation was associated with a decreased expression of many genes, the opposite was also true. In fact, that seems to be the case in other cell types 12,13. Additionally, as previously reported in other conditions, including the osteoarthritic
cartilage 14,15, most differentially methylated regions do not appear to be at the gene bodies or at promoter regions, but at genomic regions with enhancer activity distant from the promoter. Thus, changes in methylation at regulatory regions may influence the expression of genes situated several hundred kilobases away. Also, as shown in our genomic region analysis, most regions showing differential methylation between groups appear to be outside CpG islands.
Rather unexpectedly, hMSCs from patients with hip fractures tended to display up-regulation of genes linked to cell proliferation pathways, in parallel with a decreased methylation of their enhancer regions. Those genes were over-represented in important pathways, such as those regulating cell proliferation, osteoblast differentiation or vasculogenesis. This translated into an increased proliferation of these cells, in comparison with cells from patients with OA, in line with the concept
10
that fractures activate and mobilize hMSCs and are consistent with previous reports showing a mobilization of MSCs into the circulation in response to fracture 16. The mechanisms involved remain to be elucidated, but may include the release of activating cytokines and activation of the Wnt pathway, as suggested by our enrichment analysis. Wnt ligands promote the proliferation of osteoblasts precursors 17,18. In line with this, Baht et al. recently reported that hematopoietic cells of young mice are able to stimulate the osteoblastic responses in aged animals by a mechanism that involves β-catenin, a critical signaling mediator of the canonical Wnt pathway 19. Neural-mediated
mechanisms may also be included, as suggested by the enhanced bone formation shown by patients with head trauma 20 and the differential methylation and expression of some genes in nervous tissue-related pathways also found in the present study.
MSCs from fracture patients showed an up-regulation of the genes driving osteogenic differentiation, such as RUNX2 and OSX. The expression of some genes such as BGLAP and IBSP, usually considered as characteristic of the osteoblastic phenotype and targets of RUNX2, was also increased in hMSCs from fracture patients in basal conditions. However, those hMSCs showed a reduced ability to from a mineralized matrix when cultured in osteogenic medium. This could be related to a decreased activity of alkaline phosphatase, which plays a critical role in mineralization, or to the persistent up-regulation of RUNX2. RUNX2 is a master driver of osteoblast precursor differentiation 21. Specific epigenetic marks contribute to the regulation of RUNX2 expression 22. RUNX2 controls bone development and osteoblast differentiation by regulating the expression of a significant number of bone-related target genes, including collagen, osteocalcin, osteopontin, bone sialoprotein and osteoprotegerin. Thus, it plays a critical role in the early stages of differentiation of hMSCs into pre-osteoblasts. However, after this initial step, RUNX2 expression must be turned down to allow terminal differentiation of osteoblasts 23.
11
Recent experiments in rodent models of osteoporosis have shown that the MSC transplantation may have a positive effect on bone mass locally and even systemically 24,25. Additionally, molecules helping to target deliver MSCs into bone are being developed 26. This raises the possibility of using
MSCs for bone regeneration, fracture consolidation or treating widespread bone loss. Since allogenic transplants of MSCs pose difficulties related to histocompatibility, in clinical practice autologous transplants would be preferable. In this line, our results are encouraging because they show that, despite some accelerated epigenetic aging, hMSCs from patients with fragility fractures are activated and maintain a good proliferation capacity, rendering them potentially useful for autologous transplants. Indeed, these cells were able to express genes encoding several proteins present in bone matrix in quantities similar to those expressed by cells from OA patients, which have been reported to behave similarly to MSCs from healthy subjects 9. However, their ability for terminal differentiation and the formation of a mineralized matrix appear to be compromised, at least in vitro. Hence, it would be highly desirable to reach a better understanding of the mechanisms impairing that ability in order to circumvent them with the final objective of optimizing bone matrix formation in vivo.
In summary, the epigenome-wide signature of hMSCs from fracture patients shows differentially methylated regions in comparison with hMSCs derived from OA patients. Most differences are in genomic regions with enhancer activity, distant from gene bodies and apart from CpG islands. They are associated with up-regulation of a number of genes involved in MSC proliferation and differentiation, including an up-regulation of genes such as RUNX2/OSX driving the differentiation towards an osteoblastic phenotype. However, their ability to form a mineralized matrix appears to be impaired. These results point to two areas of potential interest for discovering new therapeutic targets for low bone mass disorders and bone regeneration: the mechanisms stimulating MSCs after fracture and the mechanisms impairing the terminal differentiation of MSCs. Additionally, these results
12
emphasize the concept that modifications of DNA methylation may have a cis-influence on rather distant genes.
MATERIALS AND METHODS
Human Mesenchymal Stem Cells (hMSCs) isolation and culture
Bone marrow hMSCs were obtained from the femoral heads of patients undergoing replacement surgery due to osteoporotic hip fractures (FRX; n=25, age 62 to 88 yrs) or hip osteoarthritis (OA;
n=17, age: 72 to 92 yrs). They included female patients with osteoporotic hip fractures or hip
osteoarthritis. Patients with high-impact fractures, secondary osteoporosis or secondary OA were excluded. All patients gave informed written consent. The study protocol was approved by the institutional review board (Comité de Etica en Investigación Clínica de Cantabria). Cylinders of trabecular bone were extracted with a trephine, after removing the subchondral and subfracture edges, they were washed with 50 mL of phosphate-buffered saline (PBS). Cells were subjected to a density Ficoll gradient. Then, 2 x10⁶ per cm2 were cultured on polystyrene culture flasks in MesencultTM MSC Basal media completed with 10% of Mesenchymal Stem Cell Stimulatory supplements (Stem Cell Technologies®, Vancouver, Canada). Representative samples were characterized by staining for surface markers in a FACSCanto II flow cytometer (Becton Dickinson, New Jersey, USA) after labelling with antibodies against CD45, CD34, CD73, CD90 and CD105.
Genome-wide methylation analysis
Since only MSCs at first passages were used for the experiments, there had a limited number of cells to perform all experiments with some of the hMSC lines. Thus, only 22 FRX and 17 OA samples of all the samples initially harvested were used for the analyses of DNA methylation (patients age: 62 to 95
13
yrs). DNA was extracted with Phenol:Chloroform:Isoamyl Alcohol and bisulfite-converted prior to genome-wide analysis of methylation with the Infinium Human Methylation450 BeadChip array (Illumina®, San Diego, CA, USA) in the Spanish “Centro Nacional de Genotipado” (CEGEN-ISCIII).
Raw data files were pre-processed using R/Bioconductor package RnBeads, 27 and methylation was described as β value, which ranges between 0 (no methylation) to 1 (full methylation).Analyses were conducted at the single CpG site level and at various region levels, including age as a covariate. Regions with FDR<0.05 and an absolute difference in methylation higher than 10% (Δβ>0.10) were considered as differentially methylated. Annotation data for the genomic enhancers' study were retrieved from the H1 embryonic stem cell line from the UCSC Table Browser.
The methylation level of selected CpGs was replicated by pyrosequencing (PyromarkQ24 Advanced System®). Primers used for PCR amplification and sequencing were designed with the PyroMark assay designer (Supplemental Table S5). The statistical significance of the differences between FRX and OA patients was tested by Mann-Whitney tests, with a significance threshold of 0.05.
Transcriptome analysis
RNA was isolated from hMSCs (n=10 FRX and n=10 OA) using Trizol® (Thermofisher Scientific, Waltham, MA, USA). After quality check and quantitation, the samples were prepared using the NEBNext Ultra Directional RNA Library Protocol. Samples were sequenced on an Illumina Hi-seq 2000 sequencer (NTX-Dx, Gent, Belgium). Sample reads were mapped to the human reference genome build GRCh37. Expression analysis was done with cufflinks v2.1.1 on Gencode Annotation v15. FPKM values were calculated for each annotated gene and transcript. RNAseq analysis was carried out at the transcript level with Altanalyze software 28 and at the gene level with the
14
Bioconductor package EdgeR 29. Genes with FDR<0.10 and fold-changes >2 were regarded as differentially expressed.
Enrichment analyses of the genes with differentially-methylated enhancers were obtained from the output of GREAT software 30. The overrepresentation of genes with differential expression in different cell pathways (Wikipathways) was obtained from the output of WEBGESTALT software 31, which incorporates information from different public resources. The Gene Ontology enrichment analyses from the common terms between differentially-methylated enhancers and differential expression were done with ArrayTrack software 32.
RNAseq data and expression of selected genes were confirmed by using real-time quantitative PCR (qPCR), after reverse-transcription of RNA into cDNA, using the housekeeping genes GAPDH and
RPL13A for normalization. Assay details are given in Supplemental Table S5. DNA methylation age
The epigenetic age was calculated from the methylation level of a set of 353 CpGs which has been shown to change with aging in a wide variety of tissues 33. The relationship of the epigenetic age and the chronological age was explored by linear regression analysis.
Proliferation Analysis
The proliferation status of hMSCs was assessed by immunocytochemistry using an anti-Ki-67 antibody, a nuclear protein associated with cell proliferation. The results were confirmed by a cell proliferation colorimetric assay based on the reduction of the tetrazolium dye MTT.
15
hMSCs were cultured in osteogenic induction medium (low glucose Dulbecco Modified Eagle Medium (DMEM) with 10% FBS, 50 µM ascorbic acid, 10 mM β-glycerophosphate, 100 nM dexamethasone) or adipogenic induction medium (DMEM, supplemented with 1.0 M dexamethasone, 0.2 mM indomethacin, 0.5 mM 3-isobutyl-1-methylxanthine, 10% FBS). hMSCs were plated in a 24 wells plate and incubated for up to 3 weeks, prior to staining or RNA extraction. The formation of mineralized matrix was assessed by Alizarin Red staining. The staining was evaluated semiquantitatively by two independent observers who were blind of the culture origin. Other wells were used to determine alkaline phosphatase activity in cell lysates by a colorimetric method based on the ability of ALPL to hydrolyze p-nitrophenylphosphate, 34. Oil Red was used to visualize the presence of lipid droplets.
AUTHORSHIP AND ACKNOWLEDGMENT
We thank the skillful technical assistance of Jana Arozamena. This study was supported by a grant from Instituto de Salud Carlos III (PI12/615), through a program potentially co-funded by FEDER Funds from the European Union. Carolina Sañudo was partially supported by IDIVAL. The methylation analysis service was carried out at CEGEN-PRB2-ISCIII; it is supported by grant PT13/0001, ISCIII-SGEFI / FEDER
Authors´roles: Study design: JAR, FMPC; Clinical data Collection: CGI, MIPN, MAA; Experimental
data collection: FMPC, AR, CS, WVC, MB, AFF; Data analysis and interpretation: WVC, MB, AR, FMPC, MFF, JAR; Drafting Manuscript: AR, FMPC, JAR; Revising Manuscript Content: AR, FMPC, JAR; Approving final version of manuscript: All authors. JAR takes responsibility for the integrity of the data analysis.
16
DISCLOSURE OF CONFLICTS OF INTEREST
WVC and MB are employees of NTX, the company that performed RNA sequencing. Other authors do not have conflicts of interest relevant to this paper.
REFERENCES
1. Liu H, Xia X, Li B. Mesenchymal stem cell aging: Mechanisms and influences on skeletal and non-skeletal tissues. Exp Biol Med (Maywood) 2015; 240:1099–106.
2. Donoso O, Pino AM, Seitz G, Osses N, Rodríguez JP. Osteoporosis-associated alteration in the signalling status of BMP-2 in human MSCs under adipogenic conditions. J Cell Biochem 2015; 116:1267–77.
3. Haasters F, Docheva D, Gassner C, Popov C, Böcker W, Mutschler W, Schieker M, Prall WC. Mesenchymal stem cells from osteoporotic patients reveal reduced migration and invasion upon stimulation with BMP-2 or BMP-7. Biochem Biophys Res Commun 2014; 452:118–23.
4. Liu W, Qi M, Konermann A, Zhang L, Jin F, Jin Y. The p53/miR-17/Smurf1 pathway mediates skeletal deformities in an age-related model via inhibiting the function of mesenchymal stem cells. Aging (Albany NY) 2015; 7:205–18.
5. Prall WC, Haasters F, Heggebö J, Polzer H, Schwarz C, Gassner C, Grote S, Anz D, Jäger M, Mutschler W, et al. Mesenchymal stem cells from osteoporotic patients feature impaired signal transduction but sustained osteoinduction in response to BMP-2 stimulation. Biochem Biophys Res Commun 2013; 440:617–22.
6. Delgado-Calle J, Sañudo C, Bolado A, Fernández AF, Arozamena J, Pascual-Carra MA, Rodriguez-Rey JC, Fraga MF, Bonewald L, Riancho JA. DNA methylation contributes to the regulation of sclerostin expression in human osteocytes. J Bone Miner Res 2012; 27:926–37.
17
7. Perez-Campo F, Riancho J. Epigenetic Mechanisms Regulating Mesenchymal Stem Cell Differentiation. Curr Genomics 2015; 16:368–83.
8. Delgado-Calle J, Fernández AF, Sainz J, Zarrabeitia MT, Sañudo C, García-Renedo R, Pérez-Núñez MI, García-Ibarbia C, Fraga MF, Riancho JA. Genome-wide profiling of bone reveals differentially methylated regions in osteoporosis and osteoarthritis. Arthritis Rheum 2013; 65:197–205.
9. Stiehler M, Rauh J, Bünger C, Jacobi A, Vater C, Schildberg T, Liebers C, Günther K-P, Bretschneider H. In vitro characterization of bone marrow stromal cells from osteoarthritic donors. Stem Cell Res 2016; 16:782–9.
10. Li G, Yin J, Gao J, Cheng TS, Pavlos NJ, Zhang C, Zheng MH. Subchondral bone in osteoarthritis: insight into risk factors and microstructural changes. Arthritis Res Ther 2013; 15:223.
11. Roforth MM, Farr JN, Fujita K, McCready LK, Atkinson EJ, Therneau TM, Cunningham JM, Drake MT, Monroe DG, Khosla S. Global transcriptional profiling using RNA sequencing and DNA methylation patterns in highly enriched mesenchymal cells from young versus elderly women. Bone 2015; 76:49–57.
12. Shakhbazov K, Powell JE, Hemani G, Henders AK, Martin NG, Visscher PM, Montgomery GW, McRae AF. Shared genetic control of expression and methylation in peripheral blood. BMC Genomics 2016; 17:278.
13. van Eijk KR, de Jong S, Boks MPM, Langeveld T, Colas F, Veldink JH, de Kovel CGF, Janson E, Strengman E, Langfelder P, et al. Genetic analysis of DNA methylation and gene expression levels in whole blood of healthy human subjects. BMC Genomics 2012; 13:636.
18
Genome-wide DNA methylation profile implicates potential cartilage regeneration at the late stage of knee osteoarthritis. Osteoarthritis Cartilage 2016; 24:835–43.
15. Jeffries MA, Donica M, Baker L, Stevenson M, Annan AC, Humphrey MB, James JA, Sawalha AH. Genome-wide DNA methylation study identifies significant epigenomic changes in
osteoarthritic subchondral bone and similarity to overlying cartilage. Arthritis Rheumatol 2016; 68(6):1403-14
16. Alm JJ, Koivu HMA, Heino TJ, Hentunen TA, Laitinen S, Aro HT. Circulating plastic adherent mesenchymal stem cells in aged hip fracture patients. J Orthop Res 2010; 28:1634–42.
17. Qiang Y-W, Barlogie B, Rudikoff S, Shaughnessy JD. Dkk1-induced inhibition of Wnt signaling in osteoblast differentiation is an underlying mechanism of bone loss in multiple myeloma. Bone 2008; 42:669–80.
18. Maupin KA, Droscha CJ, Williams BO. A Comprehensive Overview of Skeletal Phenotypes Associated with Alterations in Wnt/β-catenin Signaling in Humans and Mice. Bone Res 2013; 1:27–71.
19. Baht GS, Silkstone D, Vi L, Nadesan P, Amani Y, Whetstone H, Wei Q, Alman BA. Exposure to a youthful circulaton rejuvenates bone repair through modulation of β-catenin. Nat Commun 2015; 6:7131.
20. Yang T-Y, Wang T-C, Tsai Y-H, Huang K-C. The effects of an injury to the brain on bone healing and callus formation in young adults with fractures of the femoral shaft. J Bone Joint Surg Br 2012; 94:227–30.
21. Lian JB, Gordon JA, Stein GS. Redefining the activity of a bone-specific transcription factor: novel insights for understanding bone formation. J Bone Miner Res 2013; 28:2060–3.
19
Allende ML, Montecino M. Epigenetic Control of the Bone-master Runx2 Gene during
Osteoblast-lineage Commitment by the Histone Demethylase JARID1B/KDM5B. J Biol Chem 2015; 290:28329–42.
23. Bruderer M, Richards RG, Alini M, Stoddart MJ. Role and regulation of RUNX2 in osteogenesis. Eur Cell Mater 2014; 28:269–86.
24. Antebi B, Pelled G, Gazit D. Stem cell therapy for osteoporosis. Curr Osteoporos Rep 2014; 12:41–7.
25. Kiernan J, Hu S, Grynpas MD, Davies JE, Stanford WL. Systemic Mesenchymal Stromal Cell Transplantation Prevents Functional Bone Loss in a Mouse Model of Age-Related
Osteoporosis. Stem Cells Transl Med 2016; 5:683–93.
26. Yao W, Lane NE. Targeted delivery of mesenchymal stem cells to the bone. Bone 2015; 70:62– 5.
27. Assenov Y, Müller F, Lutsik P, Walter J, Lengauer T, Bock C. Comprehensive analysis of DNA methylation data with RnBeads. Nat Methods 2014; 11:1138–40.
28. Emig D, Salomonis N, Baumbach J, Lengauer T, Conklin BR, Albrecht M. AltAnalyze and DomainGraph: analyzing and visualizing exon expression data. Nucleic Acids Res 2010; 38:W755–62.
29. Robinson MD, McCarthy DJ, Smyth GK. edgeR: a Bioconductor package for differential expression analysis of digital gene expression data. Bioinformatics 2010; 26:139–40.
30. McLean CY, Bristor D, Hiller M, Clarke SL, Schaar BT, Lowe CB, Wenger AM, Bejerano G. GREAT improves functional interpretation of cis-regulatory regions. Nat Biotechnol 2010; 28:495–501.
20 update 2013. Nucleic Acids Res 2013; 41:W77–83.
32. Xu J, Kelly R, Fang H, Tong W. ArrayTrack: a free FDA bioinformatics tool to support emerging biomedical research--an update. Hum Genomics 2010; 4:428–34.
33. Horvath S. DNA methylation age of human tissues and cell types. Genome Biol 2013; 14:R115. 34. Delgado-Calle J, Sañudo C, Sánchez-Verde L, García-Renedo RJ, Arozamena J, Riancho JA.
Epigenetic regulation of alkaline phosphatase in human cells of the osteoblastic lineage. Bone 2011; 49:830–8.
21
FIGURE LEGENDS
Fig 1. Methylation analysis of hMSCs. (A) Volcano plots of DNA methylation differences in enhancer
regions of hMSCs obtained from fractures and OA. Coloured in green, plots with a FDR<0.05 and absolute beta differences larger than 0.1 (B) Heat-map showing beta values of enhancer regions. In red more methylated and in green less methylated. Samples are named with a lab identifier code (JAR).
Fig 2. Relationship between methylation and gene expression signatures. (A) Venn diagram
summarizing the association between differential DNA methylation and differential gene expression (comparisons of hMSCs from fractures over hMSCs from controls). (B) Pathways enrichment analysis of genes with hypomethylated enhancers that were up-regulated in fractures.
Fig 3. Epigenetic aging of hMSCs. Left: Comparison of epigenetic and chronological age. Regression
lines for each patient group are shown. Right: Deviation from the overall regression line with the two groups combined (mean and SE residuals in each patient group).
Fig 4. Proliferation capacity and expression of selected genes by hMSCs from patients with fractures
(FRX) and osteoarthritis (OA). (A) Proliferation assessed by Ki67 staining. (B) Proliferation by a MTT assay. (C) Expression of osteogenic markers by hMSCs from FRX and OA. (D) Expression of adipogenic markers by hMSCs.
Fig 5. Differentiation capacity of hMSCs. (A) Osteogenic and adipogenic differentiation of hMSCs, as
revealed by Alizarin red staining and Oil red staining, respectively. (B) Osteogenic differentiation of hMSCs from patients with fractures (FRX) and with osteoarthritis (OA), semiquantitative analysis. (C) Alkaline phosphatase activity in hMSC maintained in osteogenic medium. (D) Expression of the
22
osteoblastic differentiation drivers OSX and RUNX2 in hMSCs from patients with FRX and OA maintained in osteogenic medium.
B
A
Figure 1
Beta differences logFD RA
Hypomethylation Down-regulated Up-regulated Hypermethylation 1 10 100 Angiogenesis Negative regulation of transcription, DNA-…Osteoblast differentiation Synaptic transmission Skeletal system development Axon guidance Regulation of bone mineralization Vasculogenesis Negative regulation of osteoclast differentiation Epithelial to mesenchymal transition Positive regulation of mesenchymal cell…
Endochondral bone morphogenesis
-logP
logP Hypomethylation logP Overexpressed
B
Figure 2
Figure 3
-5 -4 -3 -2 -1 0 1 2 3 4 5Residu
als
FRX OA P=0.0079 R = 0.29 R = 0.59 55 60 65 70 75 80 85 90 95 100 105 50 70 90 110 DN A m ethy lati on age Chronologic age FRX OA Linear (FRX) Linear (OA) FRX OA0 20 40 60 80 OP OA % Ki67 Posi tiv e hMS Cs p=0.0003
A
0 0.5 1 1.5 2 D3 D5 D7 D9 D Abs orbance OP OAB
Re lativ e Expre s s ion P=0.024 P=0.37 P=0.8 P=0.002 P=0.08 P=0.01C
D
Figure 4
Re lativ e Expre s s ion FRX FRX OA 0 0.5 1 1.5 2 2.5 3 OP OA COL1a1 0 0.01 0.02 0.03 0.04 OP OA RUNX2 0 E+0 1 E-4 2 E-4 3 E-4 4 E-4 5 E-4 6 E-4 OP OA OSX FRX FRX FRX 0 0.1 0.2 0.3 OP OA IBSP P=0.087 0 0.01 0.02 0.03 0.04 0.05 0.06 OP OA BGLAP 0 0.2 0.4 0.6 0.8 1 1.2 OP OA SSP1 Re lativ e Expre s s ion P=0.016 FRX FRX FRX 0 E+0 2 E-3 4 E-3 6 E-3 8 E-3 OP OA PPARG 0 E+0 2 E-6 4 E-6 6 E-6 8 E-6 1 E-5 OP OA LPL FRX FRX 0 0.02 0.04 0.06 0.08 OP OA ALPL P=0.046 FRXA
B
C
P=0.0096 ALPL Activity 0 1 2 3 4 5 OP OA ALP L (uM/ml)Alizarin Red Staining
hMS Cs li nes (n) 0 2 4 6 8
-
+
++
+++
OP OA Oil Red Os teo genic Diff er en tia tion x40 x20 Ad ipog en ic Diff er en tia tion Alizarin Red Fat Vesicles Calcium Deposits x40 x20D
0 0.025 0.05 0.075 0.1 OP OA RUNX2 0.0E+0 2.5E-5 5.0E-5 7.5E-5 OP OA OSX P=0.043 P=0.34Figure 5
FRX FRX Re lativ e Ex pres sion FRX FRXTable 1. Distribution of differentially methylated CpGs between MSCs from
fracture patients (FRX) and patients with osteoarthritis in various genomic regions.
Genomic regions Differentially methylated CpG sites Analyzed regions Differential methylated regions Regions more methylated in FRX Regions less methylated in FRX Promoters 402 30877 217 111 106 Gene bodies 1355 30725 129 62 67 CpG islands 124 26649 40 16 24 Enhancers 2425 41280 1684 870 814
Table 2. Top 50 up-regulated expressed genes in fractures. Gene symbol
and complete gene name are shown. Each gene with their corresponding fold change value and corrected p-value (FDR).
Gene symbol
Gene name
Fold-Change
FDR
LGR6 Leucine-Rich Repeat-Containing G-Protein Coupled Receptor 6 11.6 0.0083
BGLAP Bone Gamma-Carboxyglutamate Protein 10.3 0.0226
GNGT1 G Protein Subunit Gamma Transducin 1 9.1 0.0574
KLRC2 Killer Cell Lectin Like Receptor C2 8.9 0.0083
GLB1L3 Galactosidase Beta 1 Like 3 8.1 0.0046
RANBP3L RAN Binding Protein 3 Like 7.4 0.0604
PKD1P6 Polycystin 1, Transient Receptor Potential Channel Interacting Pseudogene 6 7.3 0.0163
IBSP Integrin Binding Sialoprotein 6.1 0.0028
RTEL1 Regulator Of Telomere Elongation Helicase 1 5.8 0.0399
INSC Inscuteable Spindle Orientation Adaptor Protein 5.7 0.0284
SORCS2 Sortilin Related VPS10 Domain Containing Receptor 2 5.7 0.0383
ACAD8 Acyl-CoA Dehydrogenase Family Member 8 5.0 0.0143
SLC12A7 Solute Carrier Family 12 Member 7 5.0 0.0386
OSBP2 Oxysterol Binding Protein 2 5.0 0.0824
SCN9A Sodium Voltage-Gated Channel Alpha Subunit 9 4.9 0.0399
BMP2 Bone morphogenetic protein 2 4.8 0.051
LSP1P2 Lymphocyte-Specific Protein 1 Pseudogene 2 4.8 0.0456
ETV1 ETS Variant 1 4.8 0.0979
DNM1 Dynamin 1 4.7 0.0642
TRIM59 Tripartite Motif Containing 59 4.6 0.0815
COL8A2 Collagen type VIII alpha 2 chain 4.1 0.0284
TNNC1 Troponin C1, Slow Skeletal And Cardiac Type 4.1 0.0703
STMN3 Stathmin 3 4.1 0.0274
GRIA1 Glutamate Ionotropic Receptor AMPA Type Subunit 1 4.1 0.0806
LRRC17 Leucine Rich Repeat Containing 17 4.0 0.0854
CACNA1G Calcium voltage-gated channel subunit alpha1 G 3.9 0.0972
TRIM7 Tripartite Motif Containing 7 3.9 0.0384
ARFRP1 ADP Ribosylation Factor Related Protein 1 3.9 0.095
BTBD11 BTB Domain Containing 11 3.9 0.0924
AMOT Angiomotin 3.8 0.0129
GALNTL1 Polypeptide N-Acetylgalactosaminyltransferase 16 3.7 0.0686
TNFRSF11B Osteoprotegerin 3.7 0.0284
NCAM1 Neural Cell Adhesion Molecule 1 3.7 0.0151
RNF112 Ring Finger Protein 112 3.7 0.0797
GALNT3 Polypeptide N-Acetylgalactosaminyltransferase 3 3.6 0.0289
STXBP6 Syntaxin Binding Protein 6 3.6 0.058
ABCA3 ATP Binding Cassette Subfamily A Member 3 3.6 0.0284
MEOX2 Mesenchyme Homeobox 2 3.6 0.0797
TCEAL7 Transcription Elongation Factor A Like 7 3.5 0.0972
LOXL4 Lysyl Oxidase Like 4 3.5 0.0979
PCDH10 Protocadherin 10 3.5 0.0284
FBXL13 F-Box And Leucine Rich Repeat Protein 13 3.4 0.0183
SYT12 Synaptotagmin 12 3.3 0.0686
LRRC15 Leucine Rich Repeat Containing 15 3.3 0.0884
DNAJC22 DnaJ Heat Shock Protein Family (Hsp40) Member C22 3.1 0.0586
P2RX6 Purinergic Receptor P2X 6 3.1 0.051
CXorf57 Chromosome X Open Reading Frame 57 3.1 0.0284
ENPP1 Ectonucleotide Pyrophosphatase/Phosphodiesterase 1 2.9 0.028
Table 3. Top 50 down-regulated expressed genes in fractures. Gene
symbol and complete gene name are shown. Each gene with their corresponding fold change value and corrected p-value (FDR).
Gene Symbol
Gene name
Fold-Change
FDR
IGHG4 Immunoglobulin Heavy Constant Gamma 4 (G4m Marker) 125.4 0.0274
IGHD Immunoglobulin Heavy Constant Delta 56.9 0.0279
IGHJ4 Immunoglobulin Heavy Joining 4 48.5 0.0624
IGKV2-28 Immunoglobulin Kappa Variable 2-28 43.4 0.0596
IGHGP Immunoglobulin Heavy Constant Gamma P 43.1 0.0284
IGKV3-20 Immunoglobulin Kappa Variable 3-20 32.9 0.0183
IGKV4-1 Immunoglobulin Kappa Variable 4-1 26.5 0.0806
IGHG3 Immunoglobulin Heavy Constant Gamma 3 25.1 0.0128
CHL1 Cell Adhesion Molecule L1 Like 22.6 0.0224
SYNPO2 Synaptopodin 2 21.7 0.0018
IGKV1-5 Immunoglobulin Kappa Variable 1-5 21.7 0.0518
IGKV1-6 Immunoglobulin Kappa Variable 1-6 21.7 0.0624
IGLC2 Immunoglobulin Lambda Constant 2 21.6 0.0992
LYZ Lysozyme 18.1 0.0016
IGHA1 Immunoglobulin Heavy Constant Alpha 1 17.0 0.0199
CHRDL1 Chordin Like 1 16.0 0.0372
CPA3 Carboxypeptidase A3 15.6 0.0651
SLC24A3 Solute Carrier Family 24 Member 3 15.2 0.0182
IGLC3 Immunoglobulin Lambda Constant 3 14.8 0.0967
IGJ Joining Chain Of Multimeric IgA And IgM 14.2 0.0227
IGHG1 Immunoglobulin Heavy Constant Gamma 1 13.8 0.0339
DERL3 Derlin 3 13.0 0.0486
TMEM176A Transmembrane Protein 176A 12.8 0.0935
IGLJ3 Immunoglobulin Lambda Joining 3 12.6 0.0856
ACTG2 Actin, Gamma 2, Smooth Muscle, Enteric 12.1 0.0711
IL32 Interleukin 32 11.9 0.0474
CD27-AS1 CD27 Antisense RNA 1 11.6 0.0076
CRISPLD2 Cysteine Rich Secretory Protein LCCL Domain Containing 2 11.3 0.0286 ID4 Inhibitor Of DNA Binding 4, HLH Protein 11.3 0.0028
LPAL2 Lipoprotein(A) Like 2 11.1 0.0058
IGHG2 Immunoglobulin Heavy Constant Gamma 2 10.7 0.038
CP Ceruloplasmin 10.6 0.0301
NDE1 NudE Neurodevelopment Protein 1 10.4 0.0577
TMTC3 Transmembrane And Tetratricopeptide Repeat Containing 3 10.4 0.0576
SLC5A3 Solute Carrier Family 5 Member 3 9.7 0.0687
STX12 Syntaxin 12 9.6 0.085
HIST1H2AC Histone Cluster 1 H2A Family Member C 9.6 0.0989
ATXN1L Ataxin 1 Like 9.6 0.0429
MUC15 Mucin 15, Cell Surface Associated 9.5 0.0204
CHL1-AS2 CHL1 Antisense RNA 2 9.3 0.0207
IGKV3D-20 Immunoglobulin Kappa Variable 3D-20 9.3 0.0824
ARHGAP20 Rho GTPase Activating Protein 20 9.2 0.0337
SLC22A3 Solute Carrier Family 22 Member 3 8.6 0.0274
PMP22 Peripheral Myelin Protein 22 8.3 0.0358
CDKN1C Cyclin Dependent Kinase Inhibitor 1C 8.3 0.037
CD38 CD38 Molecule 8.2 0.0972
ENTPD1 Ectonucleoside Triphosphate Diphosphohydrolase 1 8.1 0.0158
TFRC Transferrin Receptor 7.9 0.0483