Dendrohydrology and water resources management in south central Chile: lessons from the Rio Imperial streamflow reconstruction
15
0
0
Texto completo
(2) 2922. A. Fernández et al.: Dendrohydrology and water resources management in south-central Chile. drought episodes have been linked to a significant decreasing trend in regional precipitation (Pezoa, 2003; Aravena and Luckman, 2009; González-Reyes and Muñoz, 2013), with amounts 40 % below the 1901–2005 mean (Trenberth et al., 2007). SCC is expected to undergo important climate changes. Analysis of the multimodel ensemble for the scenario RCP4.5 presented in the Atlas of Global and Regional Climate Projections (IPCC, 2013) indicates 10 to 30 % reduction in spring and summer (October to March) precipitation by 2016–2035 and 2046–2065 relative to 1986–2005. The same projection forecasts 0.5 to 2 ◦ C warming for summer (December–February). Drier and warmer summers may make SCC more vulnerable to water scarcity, given that this is the season of highest water demand in this region (Garreaud, 2015). Current and projected increases in water demand in this region are likely a source of high uncertainty for future scenarios of water use (Lara et al., 2003). However, the lack of long-term observational records of hydrometeorological variables makes difficult the development of accurate estimations of natural variability, useful for determining the severity of the recent observed deficit in streamflow (Lara et al., 2008). Therefore, there is a need to extend the observational record to better understand long-term (e.g., centuries to millennia) variability and trends in streamflow, thus providing useful information for hydrological assessment of governmental and private planning initiatives within watersheds of SCC (Lara et al., 2015; Muñoz et al., 2016). The Río Imperial, a major river in SCC, drains an area of 12 763 km2 , extending from ∼ 37 ◦ 400 S to ∼ 38 ◦ 500 S (CADE-IDEPE, 2004) (Fig. 1). The river begins at the confluence between the Cholchol and Quepe rivers, in the ninth Chilean administrative region, known as Araucanía. Summer streamflow is controlled by rainfall, as most snowmeltdominated discharge (usually occurring in late austral spring) has vanished (CADE-IDEPE, 2004). This river is currently utilized for irrigation, fishing, tourism, and transportation (in certain sections). For instance, in 2001 4 % of the basin area was potentially usable for irrigation agriculture, with some projections suggesting that this proportion will grow to ∼ 10 % (Ayala-Cabrera y Asociados, 2001). Additionally, the Río Imperial has high hydroelectric potential, ranked 11th in the country, with 455.8 MW (Santana et al., 2014). An emerging sociohydrological problem in this basin is related to the allocation of water rights by the government: there is more streamflow allocated than the current river discharge. What seems to prevent a water availability crisis is that not all the allocated water is being exploited (Ayala-Cabrera y Asociados, 2001). Facing scenarios of water scarcity may obligate some users to fully claim their rights, likely triggering a regime shift with uncertain implications. However, the ability to ponder the possible consequences of these predicted changes is limited because accurate calculations of extreme scenarios are essential but largely nonexistent. For this. Hydrol. Earth Syst. Sci., 22, 2921–2935, 2018. reason, long-term evaluations of Río Imperial discharge are urgently needed. Tree-ring analysis has proven to be a useful tool for supplementing available observations of streamflow. These proxy records can provide time series at yearly resolution, capable of delivering historical information on natural variability, estimations of return periods of extreme events such as droughts, and on the correlation with large-scale climatic forcings (Meko and Woodhouse, 2011; Sauchyn et al., 2011). In Chile, dendrohydrology has already been utilized for streamflow reconstruction in four major rivers: Maule (35◦ 300 S; Urrutia et al., 2011), Biobío (37◦ 100 S; Muñoz et al., 2016), Puelo (41◦ 390 S; Lara et al., 2008), and Baker (47◦ 400 S; Lara et al., 2015). To date, however, these studies have not yet been fully utilized for watershed planning and management. In order to provide more information on longterm streamflow variability and trends in SCC and thus contribute to improving water resource management in this key region for the country’s economy, here we report findings of a tree-ring-based reconstruction of the summer streamflow of Río Imperial. This is the first reconstruction of streamflow in summer, the season with the highest water demand. Our research focused on expanding current understanding of long-term streamflow, thus providing more evidence of both regional coincidence among studies and seasonal/local particularities in streamflow. Therefore, our objectives were to (a) determine whether or not current summer streamflow changes in the Río imperial are unprecedented at the multicentury scale, (b) establish if the return period of extreme years of high and low streamflow has changed in the last few centuries, and (c) estimate the correlation between the multicentury variability of the Río Imperial streamflow and climate modes of natural variability such as the El Niño Southern Oscillation (ENSO), the Southern Annular Mode (SAM), and the Interdecadal Pacific Oscillation (IPO). Given that this is the fifth streamflow reconstruction for a Chilean river and that available results from previous studies have yet to be utilized for water resources planning, in our discussion section we also (a) summarize arguments related to physical processes that may support our summer reconstruction as a more robust time series compared to some of the previous studies, and (b) in light of our results, evaluate strengths and weaknesses of a recently enacted method to calculate minimum ecological discharge, hoping to engage authorities, managers, and stakeholders in considering proxy-data for improving water resources management and research.. 2 2.1. Methods Analysis of instrumental streamflow records. In this study, January and February represent summer streamflow, the period of the year when streamflow is closest to the river’s baseflow and when annual precipitation www.hydrol-earth-syst-sci.net/22/2921/2018/.
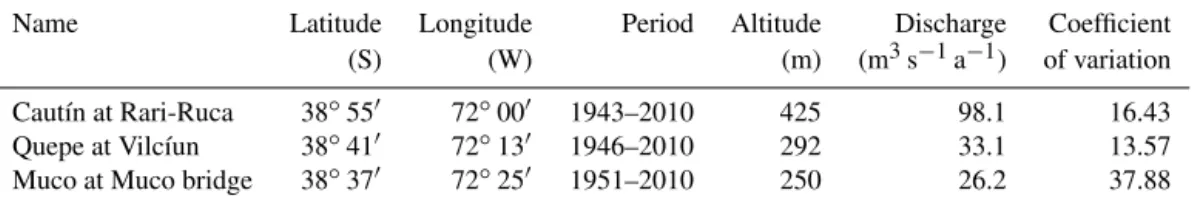
(3) A. Fernández et al.: Dendrohydrology and water resources management in south-central Chile. 2923. 35º. 36º. 37º. oce. an. MUC. TEM ● CAU ● ● QUE. ific. 39º. Arg enti. na. PAG. 38º. Pac. PIN LYV Imperial River basin. Chi le. 40º. ●. Streamflow gauges Precipitation records Tree-ring sites Elevation [m]. 41º. 0. 2000. 4000. km 0. 75º. 74º. 73º. 72º. 71º. 50. 70º. 100. 69º. Figure 1. Map showing the Río Imperial hydrological basin in the context of the SCC region. Locations of instrumental records and tree-ring sampling sites are also included. Table 1. Instrumental streamflow records utilized in this study. These records were retrieved from the Chilean National Water Authority (DGA or Dirección General de Aguas). Name Cautín at Rari-Ruca Quepe at Vilcíun Muco at Muco bridge. Latitude (S). Longitude (W). Period. Altitude (m). Discharge (m3 s−1 a−1 ). Coefficient of variation. 38◦ 550 38◦ 410 38◦ 370. 72◦ 000 72◦ 130 72◦ 250. 1943–2010 1946–2010 1951–2010. 425 292 250. 98.1 33.1 26.2. 16.43 13.57 37.88. is at its lowest (Supplement Fig. S1). Streamflow during these months is sensitive to changes in soil moisture and thus summer precipitation (or the lack of) during that period or from previous months. We selected three instrumental records (Fig. 1) representing the natural streamflow regime of the middle and lower sections within the river basin (Table 1) for the period 1947–2015. These stations gauge rivers where the water has not been diverted for irrigation and hydroelectricity and are also located in two protected areas: Malalcahuello National Reserve and Conguillío National Park. Flow at downstream stations is highly conditioned by engineered structures (e.g., water intakes). We tested the “natural regime” represented by these records by conducting a correlation study between these stations and other hydroclimatic variables such as rainfall. We utilized. www.hydrol-earth-syst-sci.net/22/2921/2018/. double-mass curves to determine the length of the time series for calibration of the reconstruction model (Muñoz et al., 2016), discarding records that did not follow rainfall trends; this resulted in the elimination of a few years in the earliest section of the time series. 2.2. Reconstruction and analysis using tree-ring chronologies. We built a multiple regression model relating three tree-ring chronologies from Araucaria araucana to records of the Río Imperial’s summer streamflow (Fig. 1 and Table 2). These chronologies were those showing the highest correlation with streamflow records, extracted from an initial group of 19 chronologies taken from Araucaria araucana (16) and AusHydrol. Earth Syst. Sci., 22, 2921–2935, 2018.
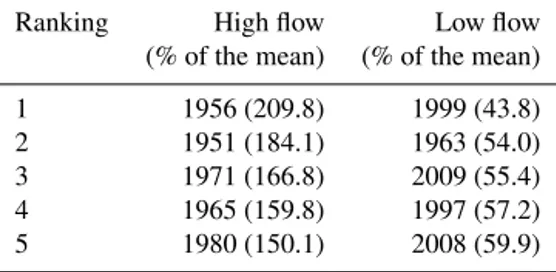
(4) 2924. A. Fernández et al.: Dendrohydrology and water resources management in south-central Chile. Table 2. Rank of the five years with highest and lowest discharges as calculated from the composite built from the instrumental record (1947–2010). Departures are expressed as percentages relative to the mean (i.e., % = Yearx / = x̂, where Yearx̂ corresponds to the streamflow of any given year and = x to the mean of the period). Ranking 1 2 3 4 5. High flow (% of the mean). Low flow (% of the mean). 1956 (209.8) 1951 (184.1) 1971 (166.8) 1965 (159.8) 1980 (150.1). 1999 (43.8) 1963 (54.0) 2009 (55.4) 1997 (57.2) 2008 (59.9). trocedrus chilensis (3). We utilized the softwares ARSTAN (Cook, 1985) and COFECHA (Holmes, 1983) for standardization and dating of the tree-ring chronologies. This standardization procedure applies linear and exponential statistical models to suppress temporal auto-correlation in the series. These statistical procedures minimize the differences in tree-ring width between individual trees (e.g., due to local dissimilarities in soil moisture or differences in age) and therefore maximize our ability to retrieve the common treering pattern related to the hydroclimate. The three available instrumental records for the basin were transformed into standardized anomalies and then averaged to constitute a single composite time series (Lara et al., 2008; Muñoz et al., 2016). To obtain a valid simulation of the streamflow from the tree-ring chronologies, we employed the “leave-one-out” regression technique using the period 1947– 2005 as the validation window, testing several predictors from the three tree-ring chronologies. The predictors consisted of chronologies for the growth year (t), as well as backward and forward lags of 1 and 2 years (t −2, t −1, t +1, and t + 2, respectively). We found that the most robust statistical model corresponded to the following: IS = 0.07 − 2.05 PINt+1 + 2.83 LYVt + 2.69 PAGt−1. (1). − 1.46 PAGt+2 − 1.97 LYVt−1 , where IS is the reconstructed summer streamflow for the Río Imperial, while PIN, LYV, and PAG correspond to the tree-ring chronologies as described in Table 3. The forward-lagged time series included suggest that the statistical model has predictive skill, as shown in previous studies (e.g., Sauchyn et al., 2015a). In this model, LYV and PAG correlated positively with same-year streamflow (0.38 and 0.43, respectively), with that of the previous year (0.53 and 0.41), and with streamflow recorded 2 years before (0.3 and 0.23). Conversely, PIN correlated negatively with streamflow recorded in previous years (−0.56 for the first and −0.38 for the second previous year). We conjecture that the negative correlation between PIN and the instrumental data is related to features of the sampling site, located in a narrow sector Hydrol. Earth Syst. Sci., 22, 2921–2935, 2018. with recurrent fog, where atmospheric moisture and precipitation in summer may produce a relative reduction in incoming radiation and temperature; these conditions may reduce the rate of the tree-ring growth. Mundo et al. (2012) reported similar findings for PIN when analyzing as larger group of chronologies. During the verification period we utilized (a) the R 2 (R 2 adj) to assess the explained variance, (b) the reduction of error (RE) statistic to account for the relationship between the actual value and its estimate, (c) the F statistic for assessing the accuracy of the regression, (d) the root mean square error (RMSE) as well as the standard error (SE) as measures of uncertainty, (e) the Durbin–Watson test for determining the degree of auto-correlation of the residuals, and (f) the variance inflation factor (VIF) to check the possibility of multicollinearity in the regression (see Ostrom, 1990, for details). The VIF evaluates the multicollinearity of the predictors: a VIF close to 1 means a low or no multicollinearity (Haan, 2002) while a value above 10 is associated with multicollinearity problems between predictors (O’brien, 2007). For studying the return period of extreme low flows in the streamflow reconstruction, we applied the peak over threshold (POT) approach, using the low flows corresponding to a threshold ≤ 20 percentile. We also estimated the recurrence rate of drought events utilizing a kernel estimation technique with a Gaussian function and 50-year bandwidth. The kernelbased estimation of drought recurrence allows for the detection of nonlinear and nonmonotonic trends without imposing parametric restrictions. Furthermore, a smooth kernel function produces more realistic estimation of drought recurrence. We calculated a confidence interval at the 95 % level based on 1000 bootstrap resampling steps (Cowling et al., 1996) to estimate bias and variance properties of drought recurrence in the reconstruction. The kernel estimation, bandwidth selection, and bootstrap algorithm were computed in the free R Project platform software (R Core Team, 2016). We assessed frequency of cycles in the reconstruction by applying the following methods: Blackman–Tukey (Ghil et al., 2002), multitaper, singular spectral analysis, and a continuous wavelet transform analysis. We further performed a number of statistical analyses comparing observed, reconstructed streamflow time series, and other relevant hydroclimatic time series. For the period with available instrumental data (second half of the 20th century), we calculated Pearson correlations between these records and the Temuco rainfall gauge (TEM in Fig. 1; 38 ◦ 460 S–72 ◦ 380 W), one of the few continuous records available in this watershed. We further analyzed the coherence of dominant periods of streamflow between the instrumental record and the tree-ring reconstruction, derived from a singular spectral analysis (Lara et al., 2015, and references herein). In addition, we compared the summer streamflow reconstruction of the Río Imperial with a November– December rainfall reconstruction of northern Patagonia (Villalba et al., 1998). These chronologies are statistically indewww.hydrol-earth-syst-sci.net/22/2921/2018/.
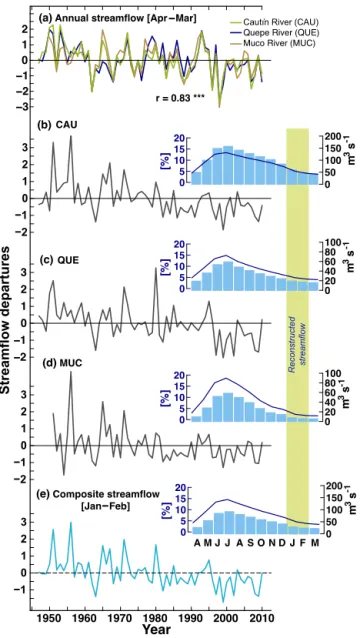
(5) A. Fernández et al.: Dendrohydrology and water resources management in south-central Chile (a) Annual streamflow [Apr– − Mar]. r = 0.83 ***. (b) CAU. 2 1. 200 150 100 50 0. 0. 20 15 10 5 0. 100 80 60 40 20 0. 3. (c) QUE. [%]. −2. m3 s -111. −1. 2 1. Reconstructed streamflow. 0. −1. 20 15 10 5 0. 100 80 60 40 20 0. m3 s-111. 3. (d) MUC. [%]. −2. 1. Results. 20 15 10 5 0. [%]. 3. 2. 3. Cautín River (CAU) Quepe River (QUE) Muco River (MUC). m3 s-111. 2 1 0 −1 −2 −3. Streamflow departures. pendent, since the latter derives from samples extracted from Austrocedrus chilensis. This comparison is justified by the fact that studies in other watersheds in the SCC region have shown a relatively fast response of the discharge to changes in precipitation (e.g., Zúñiga et al., 2012). Finally, we studied the correlations between observed and reconstructed streamflow and time series representing modes of regional climate variability, namely the ENSO, IPO, and SAM. For the ENSO, we utilized the Southern Oscillation Index (SOI) provided by the Climate Analysis Section, Climate and Global Dynamics Laboratory at NCAR1 . This SOI is computed from monthly mean sea level pressure anomalies at Tahiti and Darwin and has became standard for climatic studies (Trenberth and Caron, 2000). Negative SOI anomalies correspond to relatively warmer conditions in the eastern Pacific Ocean (or more El Niño-like conditions). The IPO time series is from the reconstruction presented in Vance et al. (2015). For the time series representing the activity of the SAM, we selected the Antarctic Oscillation (AAO) index, defined as the leading principal component of sea level pressure in the region south of 20◦ S (Thompson and Wallace, 2000) and also calculated from the NCAR–NCEP reanalysis2 .. 2925. 0 −1. Our analysis of instrumental data corroborated previous studies where the regime of the Río Imperial was characterized as fundamentally pluvial with a small snowmelt contribution during spring (CADE-IDEPE, 2004). The hydrographs in Fig. 2 show that around 40 to 50 % of the streamflow occurs between June and August, although at the Cautín station spring months contribute slightly more to the overall flow relative to the other stations. Conversely, summer streamflow represents 5 to 10 % of the total yearly amount. We also found a high correlation, as high as 0.61 for TEM, between summer discharge and rainfall of the same season as well as with rainfall observations of previous months. All observations showed a decreasing trend since the beginning of the records, both for the annual as well as for the summer mean (Fig. 2). Four of five lowest discharge records occurred after 1995, notably 1999, whereas the five highest are detected before 1981, with four of them before 1974 (Table 2). We calculated the proportional departures of each of these years (in percentage) relative to the long-term average, finding that the five lowest-flow years showed little spread, with a mean departure of 54.06 % ± 6.14 (1 standard devia-. 3. (e) Composite streamflow [Jan− Feb]. 20 15 10 5 0. 2 1. 200 150 100 50 0. 1. −2. m3 s-11. Streamflow trends and variability from the instrumental record. [%]. 3.1. AMJ J A SOND J F M. 0 −1 1950 1960 1970 1980 1990 2000 2010. Year. Figure 2. Hydrological regime of the instrumental records utilized in this study. These records were combined to develop a composite summer streamflow record for the period 1947–2010. The plots showing “streamflow departures” correspond to standardized anomalies for the common period of the records. The hydrographs depict the average streamflow of each month (bars) and the proportion of yearly discharge each month contributes (curves).. tion), whereas for the five highest-flow ones there was more spread (74.12 % ± 23.49). Furthermore, the record suggested that high-flow years tended to be more extreme (relative to the mean) than low-flow years.. 1 http://www.cgd.ucar.edu/cas/catalog/climind/soi.html (last ac-. cess: 3 December 2018) 2 For details, go to http://www.cpc.ncep.noaa.gov/products/ precip/CWlink/daily_ao_index/aao/monthly.aao.index.b79.current. ascii.table (last access: 11 May 2018). www.hydrol-earth-syst-sci.net/22/2921/2018/. Hydrol. Earth Syst. Sci., 22, 2921–2935, 2018.
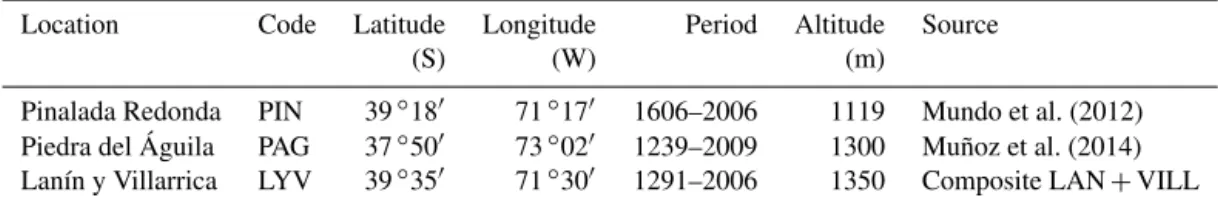
(6) 2926. A. Fernández et al.: Dendrohydrology and water resources management in south-central Chile. Table 3. Main features of the tree-ring chronologies developed for this study. The Lanín (LAN) and Villarrica (VILL) chronologies correspond to those presented in Mundo et al. (2012) and González et al. (2005), respectively. Location. Code. Latitude (S). Longitude (W). Period. Altitude (m). Pinalada Redonda Piedra del Águila Lanín y Villarrica. PIN PAG LYV. 39 ◦ 180 37 ◦ 500 39 ◦ 350. 71 ◦ 170 73 ◦ 020 71 ◦ 300. 1606–2006 1239–2009 1291–2006. 1119 1300 1350. 3.2. Figure 3. Araucaria araucana tree-ring chronologies utilized for the Río Imperial streamflow reconstruction. Gray areas represent the number of tree-growth series included in each chronology. The longest time series corresponds to the one sampled in the Nahuelbuta National Park (PAG), representing the period 1239– 2009.. Table 4. Statistical description of the tree-ring chronologies developed for this study. The column labeled as “EPS” depicts the year when that statistic began to be larger than 0.85. Code. EPS. Autocorrelation. Average sensitivity. VIF. PIN PAG LYV. 1750 1450 1525. 0.591 0.490 0.566. 0.230 0.170 0.206. 1.011 1.739 1.724. Hydrol. Earth Syst. Sci., 22, 2921–2935, 2018. Source Mundo et al. (2012) Muñoz et al. (2014) Composite LAN + VILL. Streamflow reconstruction: features and interpretation. Two of three Araucaria araucana tree-ring chronologies extended 800 years or more (PAG and LYV; Fig. 3 and Table 3), which corroborates findings from a previous study (Mundo et al., 2012) on the potential of this species for providing long paleoclimatic reconstructions. Combining the resultant common period among the tree-ring chronologies (1606–2005) with the expressed population signal (EPS) statistic yielded a 296-year (1709–2005) time series of reconstructed summer streamflow. Although the EPS for the PIN chronology was 0.85 only after 1750 (Table 4), the large number of treegrowth series in the PAG and LYV chronologies (20 and 34 by 1709, respectively; see Fig. 3) allowed for the reconstruction to begin in 1709. An EPS greater than 0.85 for a given tree-ring chronology is often assumed as proof of its reliability, because it indicates that at least 85 % of the chronology variance corresponds to a common signal (Wigley et al., 1984). Additionally, the VIF for the reconstruction period had values close to 1, especially for the PAG chronology, indicating that the regression model had no problems of multicollinearity (Table 4). From Table 4 we also noted that the chronologies presented high autocorrelation, consistent with the fact that tree growth has a temporal memory associated with trees’ capacity to store carbon and water, and the uptake rate of soil moisture remaining from previous seasons and years. Some of the statistical procedures applied to the treering chronologies are meant to minimize these effects, but it is virtually impossible to eliminate all. However, when calculated for the reconstruction the autocorrelation reduced to 0.25 which, although high considering that the instrumental record is essentially free from autocorrelation (−0.093), is nevertheless better than the individual chronologies. We extended this record using the composite instrumental record and the variance of the reconstruction. This way, the reconstruction allowed us to cover and assess the hydroclimatic significance of the latest anomalous dry period detected for central Chile (2011–2015), referred to as the “megadrought” (Garreaud, 2015). Comparison between standardized anomalies of the reconstruction and observations during the calibration period (1947–2010) suggested a high reconstruction skill for summer streamflow record (Fig. 4a). We also computed correwww.hydrol-earth-syst-sci.net/22/2921/2018/.
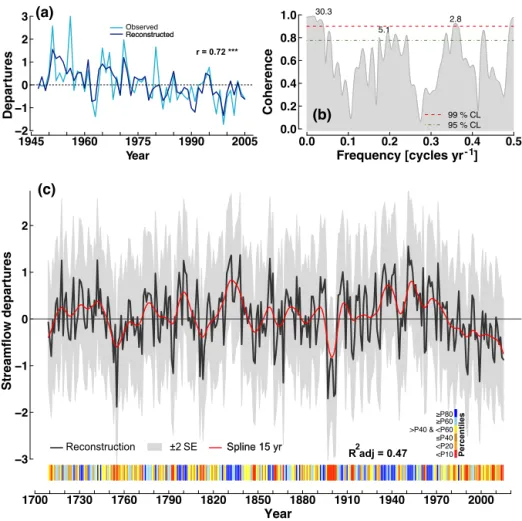
(7) A. Fernández et al.: Dendrohydrology and water resources management in south-central Chile (a). Departures. 2 1 0. −1 1960. 1975 Year. 1990. 0.6 0.4 0.2 0.0. 2005. 2.8. 5.1. 0.8. r = 0.72 ***. −2 1945. 30.3. 1.0. Observed Reconstructed. Coherence. 3. 2927. (b) 0.0. 0.1. 0.2. 0.3. 99 % CL 95 % CL. 0.4. Frequency [cycles yr - 1]. 0.5. (c). 1 0 −1 −2 −3 1700. Reconstruction. 1730. 1760. ±2 SE. 1790. Spline 15 yr. 1820. 1850. 2. R adj = 0.47. 1880. Year. 1910. 1940. ≥P80 ≥P60 >P40 & <P60 ≤P40 <P20 <P10. 1970. Percentiles. Streamflow departures. 2. 2000. Figure 4. Summer streamflow reconstruction for the Río Imperial. Panel (a) compares standardized anomalies of observed (instrumental) streamflow and our tree-ring reconstruction. Panel (b) depicts the coherence of cycles between both time series. Panel (c) corresponds to the streamflow reconstruction, including the envelope for the ±2 standard error (SE), a spline filter, and a classification of each year in the percentiles of the probability distribution (bottom section).. lations between observed and reconstructed streamflow and TEM for each month of the previous year, finding significant figures for December and February of the previous year (p value < 0.1 and < 0.05, respectively) in the case of the instrumental record; for the reconstruction, the correlation is significant for June and December (p value < 0.05; see details in Fig. S3). In addition, an analysis of coherence between dominant periods showed that both time series presented similar cycles of 3, 5, and 30 years (Fig. 4b). This good performance was further corroborated with these statistics: (a) R 2 adj = 0.47, indicating that the regression model explained 47 % of the variance in the predictand; (b) small errors, with RMSE = 0.71, RE = 0.36, and SE = 0.66; (c) a statistically significant model as reflected by the F statistic (10.08, p < 0.0001); while (d) the residuals were not autocorrelated (Durbin–Watson = 2.25, p value < 0.01). Previous studies have found similar performances for reconstructions in other regions of the world (e.g., Woodhouse, 2001), which lead us to assert that our reconstruction is a reliable representation of the Río Imperial’s summer streamflow. Anwww.hydrol-earth-syst-sci.net/22/2921/2018/. other proof is the detection of significant agreement between the reconstruction and observations for the period 1980– 2010 for the region ∼ 35–42◦ S (Fig. S2). We evaluated trends and frequency of extreme events for the whole reconstructed period. This analysis revealed a negative, although not statistically significant, trend for the reconstruction. What we did observe was a low frequency of extreme flows, although during most of the 20th century (∼ 1910–1970) high flows (above the 60th percentile) clustered. However, low-flow periods (below the 20th percentile) occurred more frequently in the late 1800s, early 1900s, and after 1980. Importantly, streamflow below the historical average characterized the post-1980 period (Fig. 4c). The application of the Blackman–Tukey method allowed us to detect high frequency cycles (2–7 years) and mid-to-low frequency (> 8 years). The multitaper method and the singular spectral analysis revealed that a ∼ 4-year cycle captures 10 % of the variance, a ∼ 7-year cycle captures 7 %, while we also found a 16–20-years cycle, corresponding to 20 % of the variance. This last long cycle was also found when applying a conHydrol. Earth Syst. Sci., 22, 2921–2935, 2018.
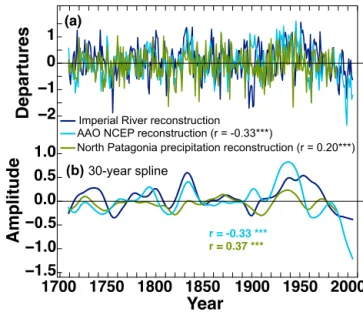
(8) 2928. A. Fernández et al.: Dendrohydrology and water resources management in south-central Chile (a). Departures. Departures. 2 1 0 −1. 20th percentile 10th percentile. 2.4 2.8. 0 −1 −2. Imperial River reconstruction AAO NCEP reconstruction (r = -0.33***) North Patagonia precipitation reconstruction (r = 0.20***). 1.0 0.5 (b) 30-year spline 0.0 −0.5 r = -0.33 *** r = 0.37 *** −1.0 −1.5 1700 1750 1800 1850 1900 1950 2000. (b). 3.2 3.8 4.8 6.2 9.1. 16.7. Year. 100 1700. (a). Amplitude. Drought occurrence rate [years]. −2. 1. 1740. 1780. 1820. 1860. Year. 1900. 1940. 1980. 2020. Figure 5. Summer streamflow reconstruction and the periods of low flow. In (a) the 10th (red) and 20th (purple) percentiles are plotted over the time series. Panel (b) shows the return period of each low flow (below the 10 and 20th percentiles) for the whole record.. tinuous wavelet transform analysis, in this case a significant 16–32-year frequency between 1800 and 1950; higher frequency cycles occur along the whole period but appear to be more significant after 1900 (Fig. S4). In order to assess the uniqueness of this recent period of extreme summer streamflow, we (a) divided the tree-ring reconstruction into continuous periods of 1, 5, 10, and 20 years, and (b) ranked those periods according to their departure from the mean. Although somewhat arbitrary, the length of these windows are defined as a mean for providing context for the occurrence of extreme flows along the whole study period in way that is easier to understand for water managers. According to this classification, the dry period 1996–2000, one of the driest in the instrumental record, ranks fourth in the reconstruction, closely followed by 1987–1991. Results also indicated that the lowest flow events since the mid-20th century are somewhat relevant at the 5-year scale. However, the period 2011–2015 did not show low flows as extreme as other periods in the reconstruction; it only ranked high in the instrumental record. At the 10-year scale, post-1980 low discharges ranked only third and fourth. The most striking relevance of modern low flow appeared at the 20-year scale, where the period 1986–2005 ranked first, suggesting that this period was the driest since the beginning of the reconstruction. The same analysis for extremely high streamflow showed that the mid-20th century was persistently ranked among the five in all the timescales considered (Table 5). Since 1980, the frequency of years in the lowest percentile has increased. We calculated the return period of these lowHydrol. Earth Syst. Sci., 22, 2921–2935, 2018. Figure 6. Comparison between the tree-ring reconstruction of Río Imperial streamflow versus the tree-ring precipitation reconstruction presented in Villalba et al. (1998) and the AAO tree-ring reconstruction from Villalba et al. (2012) that also utilized an index of SAM based on pressure fields from NCAR–NCEP reanalysis (Thompson and Wallace, 2000). In (a), these time series are displayed at annual resolution while (b) shows the same time series after the application of a 30-year spline filter. In both panels, the AAO index has been inverted to facilitate comparison with respect to tree-ring reconstructions. Pearson correlations between the streamflow reconstruction and the other time series are included at the bottom of each panel, with asterisks representing statistically significant correlations at p value < 0.001.. flow years in different periods of the reconstruction. We found (a) that during 1709–1750 and 1940–1960, events with streamflow below the 20th percentile had a 20-year return period; (b) a 5-year return period in 1750–1880; (c) a predominantly 2- to 3-year period for 1880–1930; and (d) a trend toward a 2-year return period since 1960. In addition, we found that since ∼ 1980 droughts below the 10th percentile have become more frequent (Fig. 5). We found the Río Imperial reconstruction and the precipitation reconstruction for northern Patagonia (Villalba et al., 1998) to be significantly correlated. Closer inspection of the year-to-year correspondence between these two reconstructions (Fig. 6a) revealed that the interannual variability was somewhat different, especially for the most negative departures in which there was occasional coincidence. A 30-year spline filter shows the similarity at lower frequency between these two time series, although with noticeable lags (nevertheless irregular in length) between peaks and troughs, as for example in the period ∼ 1730–1740 (Fig. 6b). Overall, the reconstructions coincided with the number and length of high and low periods.. www.hydrol-earth-syst-sci.net/22/2921/2018/.
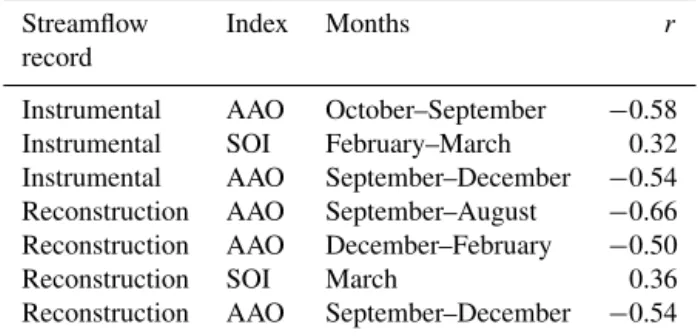
(9) A. Fernández et al.: Dendrohydrology and water resources management in south-central Chile. 2929. Table 5. Rank of the five periods showing highest and lowest discharges as calculated from the tree-ring reconstruction. These periods were organized according to windows of 5, 10, and 20 years. At the bottom of each period we included the highest and lowest streamflow from the instrumental record. Periods in bold represent coincidence between instrumental and reconstructed streamflow. Period length (years). 1. 5. 10. 20. Rank. High flow. Low flow. 1 2 3 4 5 Instrumental record. 1951 1838 1832 1858 1940 1956. 1755 1897 1901 1902 1867 1999. 1 2 3 4 5 Instrumental record. 1951–1955 1829–1833 1938–1942 1797–1801 1935–1939 1955–1959. 1897–1901 1753–1757 1811–1815 1996–2000 1987–1991 2011–2015. 1 2 3 4 5 Instrumental record. 1829–1838 1933–1942 1950–1959 1796–1805 1964–1973 1950–1959. 1896–1905 1751–1760 1990–1999 1982–1991 1810–1819 1990–1999. 1 2 3 4 5 Instrumental record. 1934–1953 1823–1842 1953–1972 1728–1744 1785–1804 1953–1972. 1986–2005 1753–1772 1883–1902 1803–1865 1843–1865 1986–2005. Table 6. Comparison between streamflow observations and streamflow reconstructed versus ENSO and SAM for the period 1948– 2005, where “r” corresponds to the Pearson correlation coefficient. 3.3. Streamflow record. Index. Months. Instrumental Instrumental Instrumental Reconstruction Reconstruction Reconstruction Reconstruction. AAO SOI AAO AAO AAO SOI AAO. October–September February–March September–December September–August December–February March September–December. r −0.58 0.32 −0.54 −0.66 −0.50 0.36 −0.54. Streamflow correlation with regional climate modes of variability. The instrumental discharge record correlated with the ENSO and the SAM (Table 6). While summer discharge had a Pearson correlation of 0.32 with the SOI from February to March of the previous year, the coefficient was as high as −0.66 with the AAO of the previous 12 months (September www.hydrol-earth-syst-sci.net/22/2921/2018/. to August). The AAO-streamflow correlation of streamflow with the instrumental record and tree-ring reconstruction were identical when calculated for the period SeptemberDecember of the immediate previous year. This correlation was weaker (−0.3) when we removed the linear trend, indicating that a significant portion of the streamflow trend is shared with the trend in the AAO. The agreement for September–December, as well as the relatively similar correlations observed for February–March (instrumental record) and March (tree-ring), reaffirmed the previous finding about the high skill of the reconstruction to reproduce essential properties of the instrumental record. An additional confirmation of the influence of the SAM on streamflow can be observed in Fig. 6, where we found a similar correlation between a long-term reconstruction of the AAO (Villalba et al., 2012) and our streamflow reconstruction, with a statistically significant Pearson r of −0.33 for both high and low frequencies. In order to discard the possibility of a nonsignificant correlation, we performed further correlations between the AAO and a prewhitened version of (a) the reconstruction and (b) the observations (removing the lag-1 autocorrelation). Results reaffirmed the negative and statistically significant correlation, with −0.287 (p value = 0.033) for the Hydrol. Earth Syst. Sci., 22, 2921–2935, 2018.
(10) 2930. A. Fernández et al.: Dendrohydrology and water resources management in south-central Chile. reconstruction and −0.29 (p value = 0.029) for the observation. In the case of the IPO, we found a statistically significant negative correlation between that time series and the 16–20-year cycle of our reconstruction (−0.38, n = 295), although it looks more coherent during the 20th century.. 4. Discussion. The tree-ring reconstruction for the Río Imperial has revealed new information on and insights into long-term streamflow variability, thus allowing for the assessment of changes in summer water availability in the SCC region, including the long-term significance of recent extreme hydrological events throughout the region. This streamflow reconstruction corresponds to the fifth record for Chilean rivers, but the very first focused on summer streamflow. Some of our findings agree with those of previous studies, which strongly suggests that our reconstruction represents well the summer hydroclimate of a large region in SCC. This is manifested by the good skill of our reconstruction in simulating instrumental records along the wider region 35–42◦ S (Fig. S2), which further supports findings by González-Reyes et al. (2017), who stated that this region configures a hydroclimatic cluster. The noticeable decreasing trend post-1980 observed in the instrumental record as well as in our reconstruction, which was to a certain extent identified in all previous reconstructions (Lara et al., 2008, 2015; Urrutia et al., 2011; Muñoz et al., 2016), corroborates the occurrence of an ongoing and unprecedented long-lasting summer low flow in SCC, which also includes the recent drought detected for central Chile (Garreaud, 2015). We note that the post-1980 period represents ∼ 50 % of the composite instrumental time series, while it only represents ∼ 10 % of the reconstructed period; we posit this highlights the uniqueness of the post-1980 period. Thus, this period is noteworthy as the one with the lowest summer streamflow of the whole reconstruction. This low-flow period gradually emerged as the most acute as the time window was broadened (Table 5), despite the fact that no year during this timespan ranked high in the lowest percentile of the reconstruction. As shown above, the decreasing trend observed in our results has already been detected in other rivers of the region, specifically south of ∼ 37 ◦ 300 S (Masiokas et al., 2008; Rubio-Álvarez and McPhee, 2010). The implications of this finding for water management and planning purposes are related to the ability to detect the effect of regional climate changes in the area. The increasing number of low-flow years may indicate a regime shift in the summer dynamics, which can be exacerbated with predicted increased warming and precipitation reduction in SCC (Garreaud, 2015). Our results indicated a decreasing trend in summer streamflow with a smaller natural variability when compared with the rest of the tree-ring record. Our results additionally posited the SAM as the most influential climate mode driving the variability of the Río ImpeHydrol. Earth Syst. Sci., 22, 2921–2935, 2018. rial’s summer streamflow, especially during the second half of the 20th century. The correlation we found between SAM and the reconstruction establishes the tree-ring time series as independent new proof of the importance of the SAM in modulating precipitation and streamflow in a large region of central and southern Chile (Villalba et al., 2012; Muñoz et al., 2016). The SAM has been extensively described as a strong modulator of precipitation variability in SCC (Aravena and Luckman, 2009; Villalba et al., 2012; González-Reyes and Muñoz, 2013). The tree-ring reconstruction showed a statistically significant correlation with the SAM reconstruction presented in Villalba et al. (2012), especially for the longterm trend; we consider that this result confirms that the reconstruction of summer streamflow for the Río Imperial captures characteristics of the regional hydroclimate. The reconstruction featured in Villalba et al. (2012) contains two of the tree-ring chronologies presented in our study (PIN and LAN), in a pool of more than 1000 series developed from different species of the Southern Hemisphere. Our summer streamflow reconstruction is key in further supporting the SAM–streamflow relationship, because in this season and overall, snowmelt is a minor contributor to discharge (see Fig. 2). This makes rainfall the principal source of water for the river. During the last 75 years or so, the SAM has been shifting to a positive phase, unprecedented in the last 1000 years (Abram et al., 2014). A positive phase means that the pressure gradient between the midlatitudes and the polar latitudes is negative, that is, more positive or less negative in the midlatitudes relative to polar latitudes. This gradient shifts the core of the southern westerly winds towards the south, limiting the effect of storm tracks over midlatitudes. In the past, the SAM has been shown to be negatively correlated with the frontal activity and hence precipitation amounts, especially for the spring season (Silvestri and Vera, 2003). Given the relatively short delay between precipitation and discharge in the region (e.g., Zúñiga et al., 2012), this relationship may well explain the decreasing summer streamflow trend observed for recent decades, as detected in the September–December negative correlation between the AAO in relation to both instrumental records and the treering reconstruction (Table 5). This way, the post-1980 trend in summer streamflow of the Río Imperial may be linked to the aforementioned positive phase of the SAM (Abram et al., 2014). This evidence suggests an unprecedented decreasing trend of the Río Imperial’s summer streamflow for at least the last 3 centuries, which may well be extrapolated to the last few millennia considering the correlation with the SAM. However, it is important to consider results according to Blázquez and Solman (2016) on the relationship between precipitation, frontal activity, the ENSO, and the SAM in the Southern Hemisphere. In that study, ENSO (defined as the second empirical orthogonal function (EOF) from monthly anomalies at the 500 hPa geopotential level) had higher correlation with frontal activity in spring at the interannual timescale, although the correlation was also stawww.hydrol-earth-syst-sci.net/22/2921/2018/.
(11) A. Fernández et al.: Dendrohydrology and water resources management in south-central Chile tistically significant with the SAM (defined as the first EOF from monthly anomalies of the 500 hPa geopotential level). Blázquez and Solman (2016) also demonstrated that precipitation in SCC is significantly correlated with frontal activity. These studies suggest that the impact of the SAM on precipitation in the study area can also be associated with ENSO dynamics. For example, the low flow for the summer 1999 was concomitant with a high AAO and a strong La Niña event in 1998–1999. Recent studies have found that in-phase (e.g., positive ENSO and positive SAM) and out-ofphase occurrences of these climate modes can lead to varying strength of the associated atmospheric circulation (Fogt et al., 2011; Wilson et al., 2016), possibly controlling the intensity of their impacts on precipitation and hence streamflow. In fact, Quintana and Aceituno (2011) in a study analyzing the changes in rainfall in central and south-central Chile found that ENSO and AAO are not independent modes of variability but rather they both affect precipitation regimes. It is also important to consider possible different seasonal effects of these modes of variability, for example those found by Barria et al. (2017), who, utilizing a 11-year moving average of a 300-year tree-ring streamflow reconstruction for the upper Biobío river, determined a negative correlation between the Pacific Decadal Oscillation (PDO) and streamflow during the snowmelt season (October–March) while a positive correlation between the SAM and that seasonal streamflow. Thus, we believe that the SAM–streamflow statistical relationship we found should be tested further in order to develop more accurate predictive models of extreme interannual dynamics. Using output from the CMIP5, Lim et al. (2016) predicted that the positive phase of the SAM will continue in some climate change projections, likely (but not certainly, given the difficulties in simulating the ENSO–SAM interactions) impacting precipitation in the midlatitudes. In this scenario, the SAM could provide more accurate statistical models of return periods. Another relevant aspect of our reconstruction is that, like previous studies, it seemed to better represent low-flow conditions rather than high flows. Urrutia et al. (2011) discussed this finding in their reconstruction of the Río Maule, arguing, following Villalba et al. (1998), that this was likely a consequence of a smaller sensitivity of tree growth to precipitation above a certain threshold. However, the R 2 adj values of previous studies do not completely support that argument as the highest R 2 adj (54 %) was found in the Río Baker streamflow reconstruction (Lara et al., 2015), the southernmost and the wettest landscape of all sampled locations in Chile. In terms of R 2 adj, our reconstruction ranks second (47 %), followed by Biobío (45 %, Muñoz et al., 2016), while Puelo Lara et al. (2008) and Maule Urrutia et al. (2011) rank together with the lowest explained variance (42 %). Notice that the two highest ranked reconstructions represent summer to fall streamflow, when the soil moisture is at its lowest in the annual cycle. Elshorbagy et al. (2016) summarized empirical and theoretical arguments to better understand, on the one hand, www.hydrol-earth-syst-sci.net/22/2921/2018/. 2931. the physical process linking tree growth and streamflow and, on the other hand, what determines whether tree-ring reconstructions reproduce dry conditions. In that study, the authors presented data from the Oldman River basin (∼ 49◦ 400 N), a cold semiarid watershed in western Canada. They suggested the likelihood of spurious self-correlation in the statistical models relating streamflow and tree-rings because precipitation may be considered as a confounding factor. The mechanism these authors suggested is that soil moisture modulates the relationship between tree growth and other hydrometeorological variables (e.g., evaporation or runoff), more so in areas (and perhaps seasons) where (when) soil moisture is relatively constant. Following these arguments, one should expect streamflow reconstructions to better represent years or periods of water scarcity rather than high flows. Elshorbagy et al. (2016) indeed found higher correlations between low flow and tree-ring width in the Oldman River basin. Our analysis, and the fact that the two of the previously reported reconstructions for Chile with the highest R 2 adj aimed to include summer months, suggest that reconstructions focusing on summer streamflow (at least partially as in the case in Lara et al., 2015) have physical meaning and not just statistical significance. This renders the Río Imperial reconstruction as a representative time series of summer streamflow for the last 301 years, with a high capacity for capturing the occurrence of dry years. However, further research is needed because the Río Puelo reconstruction (Lara et al., 2008), also aiming for summer to fall streamflow, did not rank as high as our reconstruction and the one for Río Baker. Given the crucial role that summer streamflow plays in a number of economic activities, such as agriculture and human consumption in the basin, the tree-ring reconstruction we have presented here can provide water managers and stakeholders with improved support for decision-making and regional planning. For example, the post-1980 generalized regional decrease in streamflow, both instrumental (RubioÁlvarez and McPhee, 2010) and reconstructed (e.g., Lara et al., 2008), paralleled paradigmatic legal and institutional changes in national water management, whereby the policy to assign water rights (and hence rights to use a proportion of the streamflow) transited into a model “with strong private property rights, broad private economic freedoms, and weak government regulation” (verbatim Bauer, 2004). There is growing evidence of increasing water conflicts in SCC despite recent reform in this legal framework of water rights allocation (Bauer, 2015). Some have argued that at least part of the problem resides in the insufficient hydrological information for users, managers, and decision makers (Donoso, 1999). The relevance for water management in Chile is related to the mechanism for granting water rights, since it relies on the average river flow. By using this system, water rights have often exceeded the actual flow of rivers, specifically for the summer, forcing authorities to decree zones. Hydrol. Earth Syst. Sci., 22, 2921–2935, 2018.
(12) 2932. A. Fernández et al.: Dendrohydrology and water resources management in south-central Chile. of water scarcity3 . With the information obtained from treering reconstructions, it is feasible for authorities to anticipate scenarios of future crises, particularly in drought cycles such as those described here. In this regard, a recently enacted (and modified) official decree defined the minimum ecological discharge as the lowest 50 % of the 95 % confidence interval below the average discharge, determined from a probability distribution using a period of at least 25 years of instrumental observations4 . The minimum ecological discharge is the current measure to determine when a given stream is so depleted that no more water rights must be allocated. Certainly, the 25-year window reflects the limited number of long-term records to reliably characterize streamflow throughout the country, obligating authorities to assume that the hydroclimatic regime of a given river is captured by a relatively short instrumental record. Interestingly, the text of the decree may likewise allow for the incorporation of treerings to inform the process of water rights allocation, since it actually (a) establishes the 25-year term as a minimum criteria for using available records to define the average river flow and (b) empowers the Chilean National Water Authority to incorporate other methods for river flow determination. On the other hand, this new decree defines explicitly that streamflow information has to be retrieved from an intake point, potentially limiting the use of tree-ring data because they usually represent hydroclimatic variability at the watershed scale. We argue that information derived from the multicentennial view of streamflow that tree-rings provide can help to better contextualize calculations from instrumental records, providing an additional “watershed” or regional perspective on water management. Our results indicated that the years of lowest discharge from the instrumental record did not classify as the most extreme droughts when contextualized in the longer tree-ring reconstruction. This suggests that, for instance, the drought in 1998–1999 was not as extreme as other events in the past 301 years. Episodes such as the 1968– 1969 (which in the case of the decree would need a period of at least 48 years to be detected) and 1998–1999 droughts impacted the regional economy with national repercussions, such as a 40 % reduction in electricity supply (Fischer and Galetovic, 2001). Another example is the dry period after 2010 (Garreaud, 2015; Boisier et al., 2016), where our reconstructed streamflow indicates that period was not as extreme as others that occurred in the last 301 years in SCC. In fact, our analysis indicates that 1996–2000 was a drier period in the reconstruction, although it only ranked fourth in Table 5. This finding implies that persistent rain deficits or meteorological droughts do not necessarily translate into extreme low streamflow because the storage capacity of certain hydrolog3 An example of a decree for watersheds in the north of Chile can. be found here https://goo.gl/S3n8d3 (last access: 17 April 2017). 4 See modification to decree N ◦ 12, 2013, Ministerio del Medio Ambiente, Chile, available at https://goo.gl/uWyH9R (last access: 17 April 2017).. Hydrol. Earth Syst. Sci., 22, 2921–2935, 2018. ical basins can buffer these effects. We argue that, in order to understand the impacts and extent of extreme events such as droughts, tree-ring reconstructions from watersheds representing diverse hydroclimatic gradients, land-cover characteristics, and geomorphometry are sorely needed.. 5. Conclusions. The significance of our findings for planning is related to the need to consider a long-term view of the natural variability that defines the discharge regimes across the region. Planning governmental responses for periods of low flow based upon the 1, 2, or 5-year events detected in the available instrumental record may lead to ineffective mitigation actions, because those events may not be the most extreme on record. Considering the implications of our results, we assert that the extended record we have provided can be utilized as a complementary source of information for water resources managers to more accurately determine the range of “worst-scenario” or “more-recurrent” droughts, thus helping the planning and implementation of more efficient mitigation policies. There are several examples where dendrohydrology has provided key information for the decision-making process. Sauchyn et al. (2015b) presented an example in which a series of hydroclimatic scenarios derived from tree-ring chronologies were formally included in a government-supported hypothetical decision-making exercise where relevant stakeholders were tasked with developing adaptation measures for drought episodes. In that paper, and in the context of Canadian water policy, these authors stated that dendrohydrological research is a legitimate source of information for water resource planning and management. Another study, which aimed to characterize long-term Athabasca River streamflow in Alberta, Canada, found that whereas a trend analysis of instrumental data depicted declining regional flows, a tree-ring reconstruction showed periods of severe and prolonged low flows not captured by the instrumental record (Sauchyn et al., 2015a); suggesting that worst-case scenarios estimated from historical gauge data likely underestimate the potential magnitudes of natural droughts in that region (Coulthard et al., 2016). Meko and Woodhouse (2011) described another application, where the Denver Water Board, the oldest and largest water supplier in the State of Colorado, USA, wanted to predict drought scenarios using reconstructions capable of capturing an episode that occurred during the 1950s as well as other more recent droughts. Gangopadhyay et al. (2015) asserted that dendrohydrology can help in determining drivers of periods of extreme hydrological episodes in the Upper Colorado River basin. The evidence presented in our study regarding the relatively dry post-1980 period, the higher frequency of droughts detected in the present for the Río Imperial relative to previous centuries, and the SAM projected to follow a positive phase leading to less precipitation altogether suggest that the www.hydrol-earth-syst-sci.net/22/2921/2018/.
(13) A. Fernández et al.: Dendrohydrology and water resources management in south-central Chile regional hydrology is moving toward a new regime of more frequent (although not necessarily more intense) droughts. In a similar manner, as has been documented in several recent studies targeting other regions of the world (e.g., Woodhouse and Lukas, 2006, and Sauchyn et al., 2015b, among others), our reconstruction of natural hydroclimatic variability of the Río Imperial can provide a valuable framework to ponder the impact of anthropogenic climate change on future hydroclimatic changes in SCC, thus leading to a prudent water resource management strategy. Furthermore, water managers could use the reconstructed flows of the Río Imperial to plan mitigation strategies for drought events with return periods of 5, 10 and 20 years. As this hydrological application of dendrochronology becomes widely accepted as valid and water managers realize that this kind of historical information can guide operational strategies in the forthcoming decades (Biondi and Strachan, 2012), the possible regime shift needs to be incorporated into adaptation and mitigation plans associated with the regional impacts of future global climate changes. This will avoid, or at least mitigate, the negative consequences of these changes on the management of water resources for municipal and agricultural water supplies, electrical power, ecological habitats (e.g., Carrier et al., 2013), and impacts on the economic activities in the region as water sources become stressed.. Code and data availability. Codes and data associated with this work can be accessed by emailing the first three authors.. Supplement. The supplement related to this article is available online at: https://doi.org/10.5194/hess-22-2921-2018-supplement.. Competing interests. The authors declare that they have no conflict of interest.. Acknowledgements. We first want to acknowledge the reviewers for their thorough assessment of our paper; we believe their comments have contributed to a better work. Support for the researchers involved in this work was provided by the following sources: (a) Chilean Research Council (FONDECYT 11161061, 11160454, 1171065, and 1171400), the Center for Climate and Resilience Research (CR)2 (FONDAP 15110009); (b) Proyectos Internos Pontificia Universidad Católica de Valparaíso (039.353/2016 and 039.329/2016); (c) Vicerrectoría de Investigación Universidad de Concepción (DIUC 208.603.009-1.0); (d) Programa de Mitigación de Riesgos, Ministerio del Interior y Seguridad Pública “Proyecto de manejo integrado de cuencas abastecedoras de agua en la Provincia de Malleco”; and (e) the project “Ecosystem-based strategies and innovations in water governance networks for adaptation to climate change in Latin American Landscapes” (EcoAdapt) funded by the European Commission under FP7 contract ENV.2011.4.2.3-1/283163. Special gratitude is extended to the Chilean Forest Service (Corporación Nacional Forestal:. www.hydrol-earth-syst-sci.net/22/2921/2018/. 2933. CONAF) for helping with fieldwork and giving us the support to develop dendrochronological research in Araucaria ecosystems. We also acknowledge Nick Crane for his help in an earlier version of this paper. Edited by: Günter Blöschl Reviewed by: two anonymous referees. References Abram, N. J., Mulvaney, R., Vimeux, F., Phipps, S. J., Turner, J., and England, M. H.: Evolution of the Southern Annular Mode during the past millennium, Nat. Clim. Change, 4, 564–569, 2014. Aravena, J.-C. and Luckman, B. H.: Spatio-temporal rainfall patterns in Southern South America, Int. J. Climatol., 21, 2106– 2120, https://doi.org/10.1002/joc, 2009. Ayala-Cabrera y Asociados: Plan Director para la Gestión de los Recursos Hídricos en la Cuenca del Río Imperial, Dirección General de Aguas, Ministerio de Obras Públicas, Chile, 2001. Barria, P., Peel, M. C., Walsh, K. J. E., and Muñoz, A.: The first 300-year streamflow reconstruction of a highelevation river in Chile using tree rings, Int. J. Climatol., https://doi.org/10.1002/joc.5186, 2017. Bauer, C. J.: Results of Chilean water markets: Empirical research since 1990, Water Resour. Res., 40, 1–11, https://doi.org/10.1029/2003WR002838, 2004. Bauer, C. J.: Water Conflicts and Entrenched Governance Problems in Chile’ s Market Model, Water Alternat., 8, 147–172, http://www.water-alternatives.org/index.php/alldoc/articles/ vol8/v8issue2/285-a8-2-8/file (last access; 10 May 2018), 2015. Biondi, F. and Strachan, S.: Dendrohydrology in 2050: Challenges and Opportunities, in: Toward a Sustainable Water Future, 355–362, American Society of Civil Engineers, Reston, VA, https://doi.org/10.1061/9780784412077.ch38, 2012. Blázquez, J. and Solman, S. A.: Interannual variability of the frontal activity in the Southern Hemisphere: relationship with atmospheric circulation and precipitation over southern South America, Clim. Dynam., https://doi.org/10.1007/s00382-016-3223-3, 2016. Boisier, J. P., Rondanelli, R., Garreaud, R. D., and Muñoz, F.: Anthropogenic and natural contributions to the Southeast Pacific precipitation decline and recent megadrought in central Chile, Geophys. Res. Lett., 1–9, https://doi.org/10.1002/2015GL067265, 2016. CADE-IDEPE: Cuenca del Río Imperial, Tech. rep., Ministerio de Obras Publicas, 2004. Carrier, C., Kalra, A., and Ahmad, S.: Using Paleo Reconstructions to Improve Streamflow Forecast Lead Time in the Western United States, JAWRA Journal of the American Water Resources Association, 49, 1351–1366, https://doi.org/10.1111/jawr.12088, 2013. Cook, E.: A time series analysis approach to treering standardization, Ph.d. thesis, University of Arizona, 1985. Coulthard, B., Smith, D. J., and Meko, D. M.: Is worstcase scenario streamflow drought underestimated in British Columbia? A multi-century perspective for the south coast, derived from tree-rings, J. Hydrol., 534,. Hydrol. Earth Syst. Sci., 22, 2921–2935, 2018.
(14) 2934. A. Fernández et al.: Dendrohydrology and water resources management in south-central Chile. 205–218, https://doi.org/10.1016/j.jhydrol.2015.12.030, https://doi.org/10.1016/j.jhydrol.2015.12.030, 2016. Cowling, A., Hall, P., and Phillips, M. J.: Bootstrap Confidence Regions for the Intensity of a Poisson Point Process, J. Am. Stat. Assoc., 91, 1516, https://doi.org/10.2307/2291577, https: //doi.org/10.1080/01621459.1996.10476719, 1996. Donoso, G.: Análisis del funcionamiento del mercado de los derechos de aprovechamiento de agua e identificación de sus problemas, Revista Derecho Admistrativo Económico, 1, 295–314, 1999. Elshorbagy, A., Wagener, T., Razavi, S., and Sauchyn, D.: Correlation and causation in tree-ring-based reconstruction of paleohydrology in cold semiarid regions, Water Resour. Res., 52, 7053– 7069, https://doi.org/10.1002/2016WR018985, 2016. Fischer, R. and Galetovic, A.: Regulatory governance and Chile’s 1998-99 electricity shortage, no. November in Research working paper series, World Bank, Washington DC, http://documents.worldbank.org/curated/en/ 213651468743956019/pdf/multi0page.pdf (last access: 10 May 2018), 2001. Fogt, R. L., Bromwich, D. H., and Hines, K. M.: Understanding the SAM influence on the South Pacific ENSO teleconnection, Clim. Dynam., 36, 1555–1576, https://doi.org/10.1007/s00382010-0905-0, 2011. Gangopadhyay, S., McCabe, G. J., and Woodhouse, C. A.: Beyond annual streamflow reconstructions for the Upper Colorado River Basin: A paleo-water-balance approach, Water Resour. Res., 51, 9763–9774, https://doi.org/10.1002/2015WR017283, 2015. Garreaud, R.: The 2010-2015 mega-drought: A lesson for the future, Center for Climate and Resilience Research – Universidad de Chile, 2015. Ghil, M., Allen, M. R., Dettinger, M. D., Ide, K., Kondrashov, D., Mann, M. E., Robertson, A. W., Saunders, A., Tian, Y., Varadi, F., and Yiou, P.: Advanced spectral methods for climatic time series, Rev. Geophys., 40, 1003, https://doi.org/10.1029/2000RG000092, 2002. González, M. E., Veblen, T. T., and Sibold, J. S.: Fire history of Araucaria-Nothofagus forests in Villarrica National Park, Chile, J. Biogeogr., 32, 1187–1202, https://doi.org/10.1111/j.13652699.2005.01262.x, 2005. González-Reyes, Á. and Muñoz, A. A.: Cambios en la precipitación de la ciudad de Valdivia (Chile) durante los últimos 150 años, Bosque (Valdivia), 34, 15–16, https://doi.org/10.4067/S071792002013000200008, 2013. González-Reyes, Á., McPhee, J., Christie, D. A., Le Quesne, C., Szejner, P., Masiokas, M. H., Villalba, R., Muñoz, A. A., and Crespo, S.: Spatiotemporal Variations in Hydroclimate across the Mediterranean Andes (30◦ –37◦ S) since the Early Twentieth Century, J. Hydrometeorol., 18, 1929– 1942, https://doi.org/10.1175/JHM-D-16-0004.1, http://journals. ametsoc.org/doi/10.1175/JHM-D-16-0004.1, 2017. Haan, C.: Statistical Methods in Hydrology, Wiley-Blackwell, 2. Edn., 2002. Holmes, R.: Computer-assisted quality control in tree-ring dating and measurements, Tree Ring Bull., 43, 69–75, 1983. Instituto Nacional de Estadísticas: Censo Nacional Agropecuario y Forestal, http://www.censoagropecuario.cl/index2.html (last access: 10 May 2018), 2007.. Hydrol. Earth Syst. Sci., 22, 2921–2935, 2018. IPCC: Annex I: Atlas of Global and Regional Climate Projections, Cambridge University Press, Cambridge and New York, 2013. Lara, A., Soto, D., Armesto, J., Donoso, P., Wernli, C., Nahuelhual, L., and Squeo, F.: Componentes científicos clave para una política nacional sobre usos, servicios y conservación de los bosques nativos chilenos, Iniciativa Científica Milenio – Universidad Austral de Chile, 2003. Lara, A., Villalba, R., and Urrutia, R.: A 400-year tree-ring record of the Puelo River summer-fall streamflow in the Valdivian Rainforest eco-region, Chile, Clim. Change, 86, 331–356, https://doi.org/10.1007/s10584-007-9287-7, 2008. Lara, A., Bahamondez, A., González-Reyes, A., Muñoz, A. A., Cuq, E., and Ruiz-Gómez, C.: Reconstructing streamflow variation of the Baker River from tree-rings in Northern Patagonia since 1765, J. Hydrol., 529, 511–523, https://doi.org/10.1016/j.jhydrol.2014.12.007, 2015. Lim, E.-P., Hendon, H. H., Arblaster, J. M., Delage, F., Nguyen, H., Min, S.-K., and Wheeler, M. C.: The impact of the Southern Annular Mode on future changes in Southern Hemisphere rainfall, Geophys. Res. Lett., 43, 7160–7167, https://doi.org/10.1002/2016GL069453, 2016. Masiokas, M. H., Villalba, R., Luckman, B. H., Lascano, M. E., Delgado, S., and Stepanek, P.: 20th-century glacier recession and regional hydroclimatic changes in northwestern Patagonia, Glob. Planet. Change, 60, 85–100, https://doi.org/10.1016/j.gloplacha.2006.07.031, 2008. Meko, D. M. and Woodhouse, C. A.: Application of Streamflow Reconstruction to Water Resources Management, 231–261, Springer Netherlands, Dordrecht, https://doi.org/10.1007/978-14020-5725-0_8, 2011. Mundo, I. A., Roig Juñent, F. A., Villalba, R., Kitzberger, T., and Barrera, M. D.: Araucaria araucana tree-ring chronologies in Argentina: spatial growth variations and climate influences, Trees, 26, 443–458, https://doi.org/10.1007/s00468-011-0605-3, 2012. Muñoz, A. A., Barichivich, J., Christie, D. A., Dorigo, W., Sauchyn, D., González-Reyes, Á., Villalba, R., Lara, A., Riquelme, N., and González, M. E.: Patterns and drivers of Araucaria araucana forest growth along a biophysical gradient in the northern Patagonian Andes: Linking tree rings with satellite observations of soil moisture, Austral. Ecol., 39, 158–169, https://doi.org/10.1111/aec.12054, 2014. Muñoz, A. A., González-Reyes, A., Lara, A., Sauchyn, D., Christie, D., Puchi, P., Urrutia-Jalabert, R., Toledo-Guerrero, I., AguileraBetti, I., Mundo, I., Sheppard, P. R., Stahle, D., Villalba, R., Szejner, P., LeQuesne, C., and Vanstone, J.: Streamflow variability in the Chilean Temperate-Mediterranean climate transition (35◦ S– 42◦ S) during the last 400 years inferred from tree-ring records, Clim. Dynam., 1–16, https://doi.org/10.1007/s00382-016-30689, 2016. O’brien, R. M.: A Caution Regarding Rules of Thumb for Variance Inflation Factors, Quality & Quantity, 41, 673–690, https://doi.org/10.1007/s11135-006-9018-6, 2007. Ostrom, C. W.: Time series analysis: Regression techniques, Vol. 9, Sage, 1990. Pezoa, L.: Recopilación y análisis de la variación de las temperaturas (período 1965–2001) y las precipitaciones (período 1931– 2001) a partir de la información de estaciones meteorológicas de Chile entre los 33◦ y 53◦ de latitud sur, Bs. thesis, Universidad Austral de Chile, 2003.. www.hydrol-earth-syst-sci.net/22/2921/2018/.
(15) A. Fernández et al.: Dendrohydrology and water resources management in south-central Chile Quintana, J. M. and Aceituno, P.: Changes in the rainfall regime along the extratropical west coast of south America (Chile): 30– 43◦ S, Atmosfera, 25, 1–22, 2011. R Core Team: A language and environment for statistical computing, 2016. Rubio-Álvarez, E. and McPhee, J.: Patterns of spatial and temporal variability in streamflow records in south central Chile in the period 1952–2003, Water Resour. Res., 46, https://doi.org/10.1029/2009WR007982, 2010. Santana, C., Falvey, M., Ibarra, M., and García, M.: El Potencial Eólico, Solar e Hidroeléctrico de Arica a Chiloé, Tech. rep., Ministerio de Energía and Deutsche Gesellschaft für Internationale Zusammenarbeit (GIZ) GmbH, Santiago, 2014. Sauchyn, D., Vanstone, J., and Perez-Valdivia, C.: Modes and Forcing of Hydroclimatic Variability in the Upper North Saskatchewan River Basin Since 1063, Canad. Water Resour. J., 36, 205–217, https://doi.org/10.4296/cwrj3603889, 2011. Sauchyn, D., Vanstone, J., St. Jacques, J.-M., and Sauchyn, R.: Dendrohydrology in Canada’s western interior and applications to water resource management, J. Hydrol., 529, 548–558, https://doi.org/10.1016/j.jhydrol.2014.11.049, 2015a. Sauchyn, D. J., St-Jacques, J.-M., and Luckman, B. H.: Long-term reliability of the Athabasca River (Alberta, Canada) as the water source for oil sands mining, P. Natl. Acad. Sci., 112, 12621– 12626, https://doi.org/10.1073/pnas.1509726112, 2015b. Silvestri, G. E. and Vera, C.: Antarctic Oscillation signal on precipitation anomalies over southeastern South America, Geophys. Res. Lett., 30, 2115, https://doi.org/10.1029/2003GL018277, 2003. Thompson, D. W. J. and Wallace, J. M.: Annular Mode in the Extratropical Circulation. Part I : Month-to-Month Variability, J. Climate, 13, 1000–1016, https://doi.org/10.1175/15200442(2000)013<1000:AMITEC>2.0.CO;2, 2000. Trenberth, K. and Caron, J.: The Southern Oscillation Revisited: Sea Level Pressures, Surface Temperatures, and Precipitation, J. Climate, 13, 4358–4365, https://doi.org/10.1175/15200442(2000)013<4358:TSORSL>2.0.CO;2, 2000. Trenberth, K. E., Jones, P. D., Ambenje, P., Bojariu, R., Easterling, D., Tank Klein, A., Parker, D., Rahimzadeh, F., Renwick, J. A., Rusticucci, M., Soden, B., and Zhai, P.: Observations: Surface and Atmospheric Climate Change, in: Climate Change 2007: The Physical Science Basis, Contribution of Working Group I to the Fourth Assessment Report of the Intergovernmental Panel on Climate Change, edited by: Solomon, S., Qin, D., Manning, M., Chen, Z., Marquis, M., Averyt, K., Tignor, M., and Miller, H., Chapter 3, 236–336, Cambridge University Press, Cambridge, UK and New York, NY, USA, https://doi.org/10.5194/cp-6-3792010, 2007.. www.hydrol-earth-syst-sci.net/22/2921/2018/. 2935. Urrutia, R. B., Lara, A., Villalba, R., Christie, D. A., Le Quesne, C., and Cuq, A.: Multicentury tree ring reconstruction of annual streamflow for the Maule River watershed in south central Chile, Water Resour. Res., 47, W06527, https://doi.org/10.1029/2010WR009562, 2011. Vance, T. R., Roberts, J. L., Plummer, C. T., Kiem, A. S., and van Ommen, T. D.: Interdecadal Pacific variability and eastern Australian megadroughts over the last millennium, Geophys. Res. Lett., 42, 129–137, https://doi.org/10.1002/2014GL062447, 2015. Villalba, R., Cook, E. R., Jacoby, G. C., D’Arrigo, R. D., Veblen, T. T., and Jones, P. D.: Tree-ring based reconstructions of northern Patagonia precipitation since AD 1600, The Holocene, 8, 659–674, https://doi.org/10.1191/095968398669095576, 1998. Villalba, R., Lara, A., Masiokas, M. H., Urrutia, R., Luckman, B. H., Marshall, G. J., Mundo, I. A., Christie, D. A., Cook, E. R., Neukom, R., Allen, K., Fenwick, P., Boninsegna, J. A., Srur, A. M., Morales, M. S., Araneo, D., Palmer, J. G., Cuq, E., Aravena, J. C., Holz, A., and LeQuesne, C.: Unusual Southern Hemisphere tree growth patterns induced by changes in the Southern Annular Mode, Nat. Geosci., 5, 793–798, https://doi.org/10.1038/ngeo1613, 2012. Wigley, T. M. L., Briffa, K. R., and Jones, P. D.: On the Average Value of Correlated Time Series, with Applications in Dendroclimatology and Hydrometeorology, J. Clim. Appl. Meteorol., 23, 201–213, https://doi.org/10.1175/15200450(1984)023<0201:OTAVOC>2.0.CO;2, 1984. Wilson, A. B., Bromwich, D. H., and Hines, K. M.: Simulating the Mutual Forcing of Anomalous High Southern Latitude Atmospheric Circulation by El Niño Flavors and the Southern Annular Mode, J. Climate, 29, 2291–2309, https://doi.org/10.1175/JCLID-15-0361.1, 2016. Woodhouse, C. A.: A tree-ring rconstruction of streamflow for the Colorado Front Range, J. Am. Water Res. Assoc., 37, 561–569, https://doi.org/10.1111/j.1752-1688.2001.tb05493.x, 2001. Woodhouse, C. A. and Lukas, J. J.: Multi-Century TreeRing Reconstructions of Colorado Streamflow for Water Resource Planning, Clim. Change, 78, 293–315, https://doi.org/10.1007/s10584-006-9055-0, 2006. Zúñiga, R., Muñoz, E., and Arumí, J. L.: Estudio de los procesos hidrológicos de la cuenca del Río Diguillín, Obras y proyectos, 11, 69–78, https://doi.org/10.4067/S0718-28132012000100007, 2012.. Hydrol. Earth Syst. Sci., 22, 2921–2935, 2018.
(16)
Figure
+4
Documento similar
In the preparation of this report, the Venice Commission has relied on the comments of its rapporteurs; its recently adopted Report on Respect for Democracy, Human Rights and the Rule
In order to achieve this goal, we report an empirical study that attempts to systematically measure the effects of two variability sources in the estimation of the number of
The Brownian dynamical analysis based on the information ex- tracted from optical forces and torques on a particle in an optical tweezer, the analysis of the fulfillment of actio
Insights from political theory on participatory and deliberative models of democracy are adopted to move from an instrumental to a more purposeful vision on audience participation
• Analysis of long-term variability of high-energy sources in the optical and X-ray bands, using INTEGRAL observations from IBIS (the gamma-ray imager), JEM-X (the X-ray monitor)
Scarcity: The resources available Albani, are not very difficult to achieve, since with regard to human resources, with a good selection and training of its employees
In the work reported here we provide an overview of the existing soil types and their properties in an effort to ascertain whether their soils and associated characteristics are
Here we summarize the currently published records on the invasion of two Nostocales genera, Cylindrospermopsis and Aphanizomenon, to lakes and water reservoirs in subtropical
