Fully solar powered electric vehicle for harvesting fresh markets fruits
130
0
0
Texto completo
(2) PONTIFICIA UNIVERSIDAD CATÓLICA DE CHILE ESCUELA DE INGENIERÍA. FULLY SOLAR POWERED ELECTRIC VEHICLE FOR HARVESTING FRESH MARKETS FRUITS. GIOVANNI ALEJANDRO MEDRANO RÍOS. Members of the Committee: LUCIANO CHIANG SÁNCHEZ JULIO VERGARA AIMONE MARLENE AYALA ZAPATA JUAN CARLOS FERRER ORTIZ. Thesis submitted to the Office of Research and Graduate Studies in partial fulfillment of the requirements for the Degree of Master of Science in Engineering Santiago de Chile, December 2017.
(3) To my parents, Alejandro and Karina, to my siblings, and to Paula, who have given me their unconditional support, strength, and always have been there.. ii.
(4) ACKNOWLEDGEMENTS I would like to thank my supervisor Luciano Chiang for their support during all the years of study and research, professor Marlene Ayala for her valuable contribution in the agronomy field, and Members of the Committee who provide valuable comments to improve this work. I also want to thank Fernando Martínez, Sergio Cortez, Francisco Chiang, Jorge Aising, Hector, and all the people in the Mecatrónix team who helped in this project. Also, I would like to thanks to my parents, who gave me the confidence, the support and the strength in the moments of difficulty, to my siblings for their unconditional support, to Paula for her help, space, listening and valuable comments, and to my friends. The authors of the article would like to thank producers Agrícola Vergara, Agrícola Miguel Vial, and Agrícola Garcés for allowing to test the harvesting platform in their orchards. The solar vehicle proposal design was financed partially by the program Fondo de Innovación a la Competitividad Regional (FIC-R) of the O’Higgins region in Chile, project code IDI 30343725-0.. iii.
(5) CONTENTS Page DEDICATION ................................................................................................................. ii ACKNOWLEDGEMENTS ............................................................................................ iii LIST OF TABLES .......................................................................................................... vi LIST OF FIGURES ....................................................................................................... vii ABSTRACT ..................................................................................................................... x RESUMEN ..................................................................................................................... xi 1.. ARTICLE BACKGROUND .................................................................................. 1 1.1 Motivation ...................................................................................................... 2 1.1.1 Natural Resources ................................................................................ 2 1.1.2 Agriculture ........................................................................................... 4 1.1.3 Economy .............................................................................................. 7 1.2 Objectives....................................................................................................... 8 1.3 Hypothesis ...................................................................................................... 9 1.4 Background .................................................................................................... 9 1.4.1 Harvesting Machines ......................................................................... 10 1.4.2 PV Electric Vehicles (EV) ................................................................. 15 1.5 Methodology ................................................................................................ 15 1.5.1 Chassis & Steering............................................................................. 17 1.5.2 Traction system.................................................................................. 27 1.5.3 Platform ............................................................................................. 38 1.5.4 Overall design .................................................................................... 43 1.5.5 Measurement system ......................................................................... 49 1.6 Contribution ................................................................................................. 56.
(6) 1.7 Further Research .......................................................................................... 57 2.. FULLY SOLAR POWERED ELECTRIC VEHICLE FOR HARVESTING FRESH MARKET FRUITS ................................................................................. 59 2.1 Introduction .................................................................................................. 59 2.2 Materials and Methods ................................................................................. 62 2.2.1 Solar Vehicle Design ......................................................................... 63 2.2.2 Test Descriptions ............................................................................... 69 2.2.3 HSS Special Aspects ......................................................................... 70 2.3 Results and Discussion................................................................................. 72 2.3.1 Harvesting Simulation Street Test (HSS) .......................................... 72 2.3.2 Field Harvesting Day Tests ............................................................... 77 2.3.3 Harvesting Productivity ..................................................................... 86 2.4 Conclusions .................................................................................................. 88. REFERENCES .............................................................................................................. 90 A P P E N D I C E S ...................................................................................................... 95 APPENDIX A: Chassis.................................................................................................. 96 APPENDIX B: Steering System .................................................................................. 102 APPENDIX C: Traction System .................................................................................. 106 APPENDIX D: Platform System ................................................................................. 108 APPENDIX E: Measurements ..................................................................................... 111 APPENDIX F: Generals .............................................................................................. 117.
(7) LIST OF TABLES Page Table 1-1: Technical specification of linear actuator SKF CAHB-21 ............................26 Table 1-2: Technical specification of BLDC Motor HPM5000B...................................29 Table 1-3: Key features of BLDC Motor Controller HPC300H48360 ...........................30 Table 1-4: Test data Golden Motor HPM500014 ............................................................31 Table 1-5: Traction system component list with ratios ...................................................35 Table 1-6: Technical specification of Steel SAE1010 ....................................................41 Table 1-7: Technical specification of PV module ET-M53685 ......................................46 Table 2-1: Characteristics of tested orchards in Chile ....................................................63 Table 2-2: List of requirements for a cherry/nectarine harvesting vehicle. ....................64 Table 2-3: Main characteristics of solar harvesting vehicle ...........................................65 Table 2-4: Set of experiments, abbreviation and description..........................................69 Table 2-5: Test Days Reported .......................................................................................69 Table 2-6: HSS_WCNO experiment series of measurements ........................................71 Table 2-7: HSS_WCNO experiment description ............................................................71 Table 2-8: Forward motion mode averages in experiment HSS_WCNO .......................73 Table 2-9: Charging mode averages in experiment HSS_WCNO..................................74 Table 2-10: Result of experiment HSS_CTWR..............................................................75 Table 2-11: Estimation of charging time in a fully sunny day. Experiment HSS_SBR. 77 Table 2-12: ΔEnergy during harvest. Experiment HD1_WCWR...................................78 Table 2-13: Estimation of ΔEnergy recovery rate. Experiment HD1_SBR ...................79 Table 2-14: Log data of cycle series in experiment HD1_WCNO .................................80 Table 2-15: Forward motion cycle averages in experiment HD1_WCNO .....................80 Table 2-16: Charge cycle averages in experiment HD1_WCNO ...................................81 Table 2-17: Log data of cycles in experiment HD2_WCNO .........................................83 Table 2-18: Forward motion cycle averages in experiment HD2_WCNO .....................83 Table 2-19: Charge cycle averages in experiment HD2_WCNO ...................................83 Table 2-20: Vehicle harvesting log for cherries and nectarines ......................................87 Table 2-21: Vehicle harvesting production for cherries and nectarines .........................87 Table 2-22: Harvesting production for cherries and nectarines ......................................87. vi.
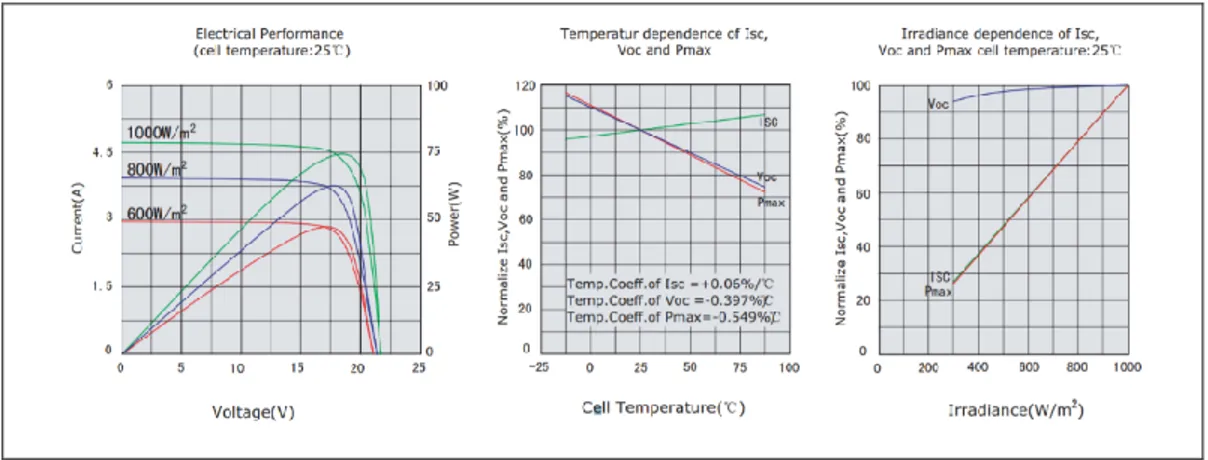
(8) LIST OF FIGURES Page Figure 1-1: Population pyramid comparison between Chile and the World. ...................6 Figure 1-2: Experimental mechanical harvest machines in the early 1960s. ..................10 Figure 1-3: Levels of harvest automation. ......................................................................11 Figure 1-4: State of the art in harvesting platforms. .......................................................12 Figure 1-5: MC01 grapes harvesting machine made in Chile by COMEC. ...................14 Figure 1-6: Design Thinking iterative process. ...............................................................16 Figure 1-7: 4-Wheel Steering movements capabilities. ..................................................18 Figure 1-8: CAD chassis. Front Kia Besta (black), front Cherokee (grey), and joint structure (blue). ...............................................................................................................20 Figure 1-9: Fabrication of the chassis. ............................................................................20 Figure 1-10: Diagrams of the steering system. ...............................................................22 Figure 1-11: Full axis top view steering system. ............................................................22 Figure 1-12: Contact surface of the wheel with the ground. ...........................................24 Figure 1-13: Linear actuator (black) installed in the chassis upside down. ....................27 Figure 1-14: Test curve Golden Motor HPM5000..........................................................31 Figure 1-15: Ranges of participation in total tractive force at different speeds of a Volkswagen Golf. ...........................................................................................................33 Figure 1-16: Components of the traction system. ...........................................................37 Figure 1-17: Complete traction system installed on the chassis upside down. ...............38 Figure 1-18: Accessible fruit orchards overview. ...........................................................39 Figure 1-19 CAD platform assembly. .............................................................................40 Figure 1-20: Components and fabrication of the platform. ............................................41 Figure 1-21: Von Mises stress for side platform full extended. Máx: 246.8 Mpa. .........42 Figure 1-22: Deformation for side platform full extended. Máx: 8.059 mm. .................42 Figure 1-23: The final platform with steep and safety rails. ...........................................43 Figure 1-24: Daily radiation cycle in San Fernando, Chile (-34.24, -71.04). .................45 Figure 1-25: Electric performance, temperature dependence and irradiance dependence of module ET-M53685. ..................................................................................................45 vii.
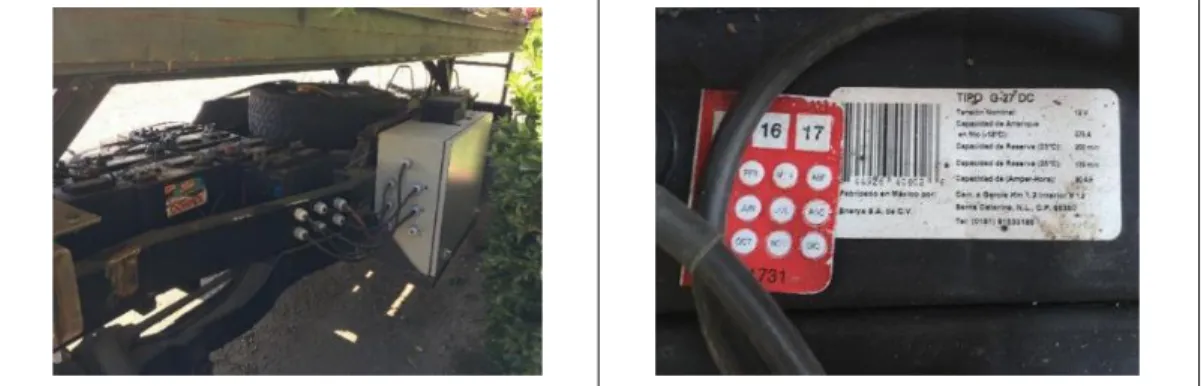
(9) Figure 1-26: Quick cleaning system for PV modules with hinge and door lock. ...........47 Figure 1-27: a) Batteries installed and connected under the chassis. b) Specifications for Gonher battery G-27 DC. ................................................................................................47 Figure 1-28: Driver dashboard with front axis at left and rear lever axis right ..............48 Figure 1-29: Electric distribution board with 3 MPPT in blue and black at left, PLC Siemens at the center, distribution lines at the top, and relays on the bottom. ...............48 Figure 1-30: Overall view of the vehicle with lift system and quick cleaning PV. ........49 Figure 1-31: Characterization of the current sensors. .....................................................50 Figure 1-32: Characterization of the Gonher battery system. .........................................50 Figure 1-33: Testing PV module, battery, MPPT, data logging, and components. ........51 Figure 1-34: Testing on street Los Orfebres. ..................................................................52 Figure 1-35: Traction 48 V battery voltage. ...................................................................53 Figure 1-36: Traction 48 V battery current. ....................................................................54 Figure 1-37: Samples isolation from series 3 in simulated harvesting movements. .......54 Figure 2-1: Conventional sweet cherry harvesting process in Coltauco, Chile. .............60 Figure 2-2: Details of 48V traction system components connected in series. ................66 Figure 2-3: Details of 24V steering system components connected. ..............................67 Figure 2-4: Diagram of the 8 PV solar panels mounted on the vehicle’s roof. ..............68 Figure 2-5: Schematics and images of the solar powered harvesting vehicle. ...............68 Figure 2-6: Aerial view of street Los Orfebres, 135 m length (North is represented by the compass’s red arrow). .....................................................................................................71 Figure 2-7: SOC in the 48 V, 90 Ah battery banks in experiment HSS_WCNO. ..........72 Figure 2-8: Energy Consumption (Ah) in traction system in HSS_WCNO. ..................73 Figure 2-9: Energy recovery and charging current in the 48 V, 90 Ah system in a cloudy morning day in Santiago, Chile. Experiment HSS_SBR. ...............................................76 Figure 2-10: Energy recovery and charging current for the 48 V, 90 Ah system in fully sunny conditions in Santiago, Chile (September 2016). Experiment HSS_SBR ...........77 Figure 2-11: Current and SOC for the traction system in experiment HD1_ WCWR. ..78 Figure 2-12: HD1_SBR Charge validation experiment for the traction system. ............79 Figure 2-13: Current and SOC in traction system in experiment HD1_WCNO Series1 81 Figure 2-14: Voltage and SOC for steering system in HD1_WCNO Series1 cycles. ....82 viii.
(10) Figure 2-15: Current and SOC in traction system for HD2_WCNO Series 3 cycles. ....84 Figure 2-16: Voltage and SOC in steering system for HD2_WCNO Series3 cycles. ....85 Figure 2-17: Current and SOC in traction system for HD2_WCNO Series 1 cycles. ....86. ix.
(11) ABSTRACT A fully solar-powered vehicle was designed, built and tested to assess feasibility for harvesting fresh fruit in Chile, particularly stone fruits, which are exported in large quantities to far away markets. Energy self-reliance, productivity, ergonomics, and environmental benefits are some of the advantages of the vehicle. Fruit damage is observed during harvest, and hand picking must be carried with extreme care generating low harvest efficiency and strenuous physical effort for workers. Therefore, the proposed solar vehicle is a means to increase hand labor productivity while preserving fruit quality for export. Solar energy is collected from 6 m2 of photovoltaic panels, and stored in a bank of deep discharge batteries. A 5 kW BLDC motor with dynamic braking capability provides mechanical power for traction. A 4-wheel steering system allows maneuvering in tight spaces in the orchard. The harvesting work cycle consists in moving forward the length of the vehicle using energy from the batteries. Then with the vehicle stopped, the crew on board handpicks the fruit. This gives enough time to recover energy spent on the solar panels. The bank of batteries can thus recover charge for the next cycle and operate this way indefinitely. This vehicle helps increase productivity because hand pickers get less tired and do not waste time setting a ladder or walking to deliver fruit buckets. The vehicle can be operated by remote control, and in the future, degrees of autonomous navigation would be attempted. Field energy consumption and productivity results are reported here after testing two harvesting seasons on sweet cherry and nectarine highdensity orchards.. Keywords: solar energy agricultural vehicle, fresh fruit harvesting, sustainable agriculture research, energy saving agricultural machinery. x.
(12) RESUMEN Se diseñó, construyó y probó un vehículo completamente solar para evaluar la factibilidad de cosechar fruta fresca en Chile, particularmente frutas de cuesco, que se exportan en grandes cantidades a mercados de larga distancia. La autosuficiencia energética, la mejora en productividad, ergonomía y los beneficios ambientales adicionales son algunas de las ventajas del vehículo. Existe un daño en la fruta que se observa durante la cosecha, por ende, la recolección manual debe llevarse a cabo con extremo cuidado, generando una baja eficiencia en la cosecha y un esfuerzo físico extenuante para los trabajadores. El vehículo solar propuesto es un medio para aumentar la productividad del trabajo manual mientras se preserva la calidad de la fruta para la exportación. La energía solar se obtiene de 6 m2 de paneles fotovoltaicos y se almacena en un banco de baterías de descarga profunda. Un motor eléctrico BLDC de 5 kW con capacidad de frenado dinámico proporciona potencia mecánica para la tracción. Un sistema de rotación independiente de las 4 ruedas permite maniobrar en espacios reducidos en el huerto. El ciclo de trabajo de recolección consiste en avanzar la longitud del vehículo utilizando la energía de las baterías. Luego, con el vehículo detenido, la tripulación a bordo recoge la fruta. Esto le da tiempo suficiente para recuperar la energía consumida en un avance, la cual pasa a través de los paneles solares. De este modo, el banco de baterías puede recuperar la carga para el siguiente ciclo y operar de manera indefinida mientras halla sol. Este vehículo ayuda a aumentar la productividad porque los recolectores se cansan menos y no pierden el tiempo colocando una escalera o caminando para entregar cubetas de fruta. El vehículo puede ser operado por control remoto y en el futuro, se intentarán grados de navegación autónoma. Los resultados de productividad y consumo de energía de campo se informan aquí después de probar dos temporadas de cosecha en huertos de cereza dulce y nectarina de alta densidad.. Palabras Claves: vehículo agrícola de energía solar, cosecha de fruta fresca, investigación de agricultura sostenible, maquinaria agrícola de ahorro de energía. xi.
(13) 1. 1.. ARTICLE BACKGROUND. Hurricanes Irma and Harvey have been classified as one of the strongest and devastating Atlantic hurricanes in recorded history. Collective estimates for the damage caused by both are upwards of US$200 billion, which in comparison to other hurricanes means half the total cost of damage caused by all together over the past 50 years (Corsentino, 2017; Donnelly, 2017). Recent studies show that the increase in the strength and destructiveness of these hurricanes could be directly related to climate change effects, such as rising sea levels and warmer oceans, making these issues a global concern (Drash, 2017; Sun et al., 2017). Nowadays, it is difficult to establish direct relationships between climate change and what are the possible causes. In general, when it comes to phenomena of such a large scale, the variables involved are so many that it begins to be defined as a chaotic system, where the prediction of future states becomes practically impossible with current technology. In fact, the consensus about the causes of global warming is still an issue with active research, but rising temperatures, melting glaciers, and rising sea levels are facts that cannot be denied. Furthermore, if some fundamental points about recent changes in the world begin to be analyzed, certain conjectures can be established with sufficient certainty to concern about the need of regulations. By the year 1800 CE, human population reached 1 billion in over 200,000 years, but according to United Nations data, only 200 years later that number increased dramatically to more than 7 billion of people living in the world (Roser & Ortiz-Ospina, 2017). This incredible recent growth of our species has many causes, among them the industrial revolution, the development of medicine, the level of technology achieved (Kremer, 1993), and others that can be widely discussed. However, the situation becomes interesting and alarming at the same time when the consequences of this tremendous change begin to be analyzed. The increase of the world population is highly relevant for humanity’s impact on the earth and the use of natural resources. A high number of people with high levels of interconnectivity, technology, and continuous development requires.
(14) 2. huge amounts of food, resources, and energy, producing a high volume of waste in the social metabolic process. Projection from data shows that, although the growth rate is going down, by the year 2100 the world population is expected to reach over 11 billion (Roser & Ortiz-Ospina, 2017). The growing demographic volume demands a better management of natural resources, raises the importance of agriculture with a particular interest in food supply methods and requires new economic models with greater sustainability over time. 1.1. Motivation. The motivation of this work can be organized in three different aspects mentioned in the previous background, which complement each other and are closely related in a particular way. These are; natural resources, agriculture, and economy. 1.1.1. Natural Resources. One of the primary natural resources that have driven the growth of the population through the recent centuries is oil and their vast amount of applications discovered since the industrial revolution. The development of interconnected electrical systems with generation plants regarding energy, the invention of individual, collective and load transport vehicles, among other advances, have allowed the development of world economies and the impulse of technology. However, at the same time that everything has grown and advanced, so has done the direct and indirect waste. Many cities have experienced air pollution with high hydrocarbons levels resulting in increased respiratory diseases of the population, having to drive regulatory programs such as vehicular restraint, and technological advances such as catalytic converter, as well as new energy generation technologies. On the other hand of pollution, the world’s oil reserves are moving closer to depletion as oil runs out, which can be observed around the world through the increase in the price of the fuels. The same reactive effect that has made us advance as a society requires us to face these environmental concerns. It is not surprising.
(15) 3. then that leading automobile manufacturers in the world are announcing the development of new models of hybrid vehicles and fully electric cars. MercedesBenz recently announced electrification of all its models for 2022 (Reuters, 2017), and Renault, Nissan, and Mitsubishi announced an alliance to launch 12 new models of electric cars and 40 autonomous driving vehicles for the same year (Lippert, Ma, & Nussbaum, 2017). One of the main components in electric vehicles are batteries, and although there are many models with different technologies, features, costs, and capacities, one of the most relevant with greater acceptance and performance are lithium batteries, including all their different versions. The main economic engine in Chile is copper mining, but as is happening with oil, copper is a natural resource that has a deadline, and eventually, it will become increasingly expensive in extraction. In the same line, significant lithium reserves have been found in the national territory that is expected to be exploited, meeting in the close future the growing demand for lithium batteries. It is a world tendency to support the change from energy matrix, and Chile, as a developing country, is up to date with this trend, leading investment in renewable energy with US$3.2 billion, and achieving the first place in South America and the Caribbean region (Ministerio de Energía, 2016). These results are the consequence of the government interest in positioning the country as a leader in innovation in the area. Due to its particular geography, the national territory has substantial advantages concerning solar photovoltaic and wind energy. The longitudinal features, with enormous mountains to the east and higher-pressure levels to the west, propitiate the generation of high winds in those transverse valleys, making each of them an essential potential candidate for the installation of wind turbines. On the other hand, in the first quarter of the northern national territory, that includes the Atacama Desert, the annual average solar radiation exceeds the 7 kWh/m2/day (Ministerio de Energia & Departamento de Geofísica Universidad de Chile, 2017). These are high levels compared to other places in the world, mainly due to an annual.
(16) 4. average frequency of clear cloudless sky days of the year close to 95%. This characteristic has attracted the manufacture of the world's leading astronomical observational telescopes with important projects as ALMA and LSST, as well as important renewable energy projects. 1.1.2. Agriculture. There are many global efforts involved in reducing greenhouse gases in hopes of slowing climate change and improve sustainability. Perhaps one of the most known is the establishment of the concept of carbon footprint and its increasing interest to influence in the decisions of purchase of people and companies. According to Carbon Trust definition (2009), it tries to represent the total set of greenhouse gas emissions caused by an individual, event, organization, or product, expressed as carbon dioxide equivalent. Virtually, any process whether human or productive involves emissions, and the food is not the exception. The increase in world population has driven the development of improvements in food production systems, making them more profitable and scalable. Many solutions have been designed to partially or fully automate food production and harvesting processes, but many of the existing mechanical solutions are based on internal combustion engines (Li, Lee, & Hsu, 2011; Shepardson, Markwardt, Millier, & Rehkugler, 1970). These increase carbon footprint of the food and requiring the use of chemicals to facilitate automated harvesting process. The development, for one hand, of potent compounds to keep crops, and for the other, of genetically modified (GM) food has enabled the creation of more resistant plant species to pests and more durable fruits for resisting mechanical harvest and long shipping trips. However, there is an active research trying to demonstrate the advantages and safety of these new biotechnology products (Dias & Ortiz, 2013; Ehlert, Moreano, Busch, & Engel, 2008) and clear the concerns about human diseases development, like cancer. The countries that lead the world's Gross Domestic Product (GDP), as they have grown, have changed their economic matrix, focusing mostly on the development of.
(17) 5. technology and services production, but reducing the participation of the agriculture. This is a phenomenon that can also be observed in the evolution of the structure of the Chilean GDP since 1980 onwards (World Bank, 2017), but that does not necessarily indicate a lack of interest of these countries by the agricultural activity. Despite this, it is essential to consider the increasing demand for food in the world, which can be profoundly potentiated as an economic activity with vast opportunities for innovation. The primary geographic characteristics that give Chile an important potential in renewable energies also provides a natural barrier against pests and other biological hazards that could affect both plant and animal crops. The Cordillera de Los Andes in the east, the Atacama Desert in the north, the Pacific Ocean in the west and the low temperatures of the Antarctic in the south, place the country in a privileged environment conducive to agriculture and animal farming. It is not surprising then that two of the country’s most important economic activities are agriculture and salmon farming. Chile is the second largest exporter of salmons in the world after Norway (SalmonChile.cl, 2017) and one of the largest exporters of fresh fruit in the southern hemisphere (Alcaino, Müller, Betinyani, & Brito, 2014). This last activity, called horticulture, is one of the leading responsible of employing outside the capital, which has a centralized structure for organization and economical to maintains the 90% of the population located in the middle third of the country’s capital of Santiago (CIA, 2017). For those residents outside the central region employment opportunities are scarce, and it is common to see older adults doing work of considerable physical effort. National horticulture is one of the best examples, where harvesting mechanisms are still traditional with ladders, mostly performed by older women who have to endure 12 kg mats crossed on their chests during a full working day under full sun conditions. Many of these workers, called “temporeras,” are single mothers who have to feed and educate their children and the harvest is practically one of their only work options. Besides this, the population in Chile as in the world is undergoing a demographic transition, which can be observed in Figure.
(18) 6. 1-1. This means that the number of older people is increasing while that of younger is decreasing. This is the reflection of changes in fertility, mortality, and international migration. Chile could benefit from its favorable new age structure, but it will need to keep its sizeable working-age population productively employed, removing the physical effort component of some jobs through the use of technology and innovation, and preparing to provide for the needs of its growing proportion of older adults (CIA, 2017).. a) World population pyramid for 1950, 2016 and 21001. b) Chile population pyramid for 20162 Figure 1-1: Population pyramid comparison between Chile and the World.. 1 2. Source: https://ourworldindata.org/world-population-growth/ Source: https://www.cia.gov/library/publications/the-world-factbook/geos/ci.html.
(19) 7. The automation of agriculture is an imminent event that will come sooner or later due to economies of scale and cost reduction. Moreover, the recent shortage of unskilled labor that has been experienced in different industrial sectors, as a result of the increase in the educational levels of the population, dictates the need for a change. However, due to economic stability and other agents, has begun a steady Latin American immigration to the national territory, which is stopping the unskilled labor shortages but is also accelerating the process of demographic transition. 1.1.3. Economy. The automation of unskilled labor and the continuous development of new technology is almost a certainty. These advances are one of the leading precursors of the increase in world population as of their well-being, but the actual economic processing model is reaching limitations concerning sources for resource inputs and sinks for waste. The use of natural resources and the development of products from a linear economy model is producing an adverse effect on the environment. This process begins with the extraction and refinement of resources, then through the manufacture and assembly of parts, these are transformed into products that will be acquired and used by consumers for a specified period, but eventually, these refined resources that were solutions one will end up as waste in some landfill. In the European Union, there is a novel concept defined as the circular economy (CE) that is gaining strength, w. The CE is a simple, but convincing, strategy, which aims at reducing both inputs of raw materials and output of wastes by closing economic and ecological loops of resource flows (Haas, Krausmann, Wiedenhofer, & Heinz, 2015). Estimation from this study shows that while globally roughly four gigatons per year (Gt/yr.) of waste materials are recycled, this flow is of moderate size compared to 62 Gt/yr of processed materials and outputs of 41 Gt/yr. The authors state that the low degree of circularity of the linear model has two main reasons: First, 44% of processed materials are used to provide energy and are thus.
(20) 8. not available for recycling. Second, socioeconomic stocks are still growing at a high rate with net additions to inventories of 17 Gt/yr. From the foundation words, a strategy is a multi-R approach; rethink, redesign, remanufacture, repair, redistribute, reduce, reuse, recycle and recover energy. Trash is a design error that can be corrected by changing the way we think about product design, making them upgradeable, not only in software. The different materials and mechanisms that form a product can be thousands. Each of these components has different failure rates, service life, and programmed obsolescence. Better thinking about product design and manufacturing process can reduce the costs, price, and resources needed to innovate and attract the purchase of new technologies, without starting from scratch. Besides this, one of the leading challenges that face CE is to become attractive to both companies and customers, and perhaps the solution could be rooted in the concept of leasing. Chile as a based and known mining country needs to move out from the main economic engine of resource extraction to ensure sustainable growth. The development of this work can be considered, in a certain way, as a proof of CE concept application, developing industrial machinery with recycled components. 1.2. Objectives. This central thesis objective is to design and determine the feasibility of an electric harvesting vehicle exclusively powered by photovoltaic solar energy, to continuously harvest fruit orchards of nectarines and sweet cherries, transporting up to eight harvesters and three bins3 of 500 kg each. Among the specific objectives are the following:. 3. A cubic container for fruit transport of 1200x1000x760 mm..
(21) 9. •. Design an electric traction system that allows the vehicle to be mobilized on the rough terrain of orchards without complications or lack of power.. •. Design an electric steering system that allows maneuvering the vehicle easy and efficiently on the narrow rows of the orchards without demanding special driving skills.. •. Complement the vehicle with an efficient loading and discharge of Bins system to facilitate and improve the harvesting process, reducing downtimes.. •. Design a power system (solar photovoltaic panels, batteries, and charge controllers) for the continuous operation of all electromechanical systems.. •. Design an ergonomic and adaptable platform to meet most of the dimensions of Chilean sweat cherry and nectarine orchards.. •. Implement a protocol for the measurement and analysis of current and voltage to determine the consumptions and loads of the systems separately.. •. Determine, from the results, the rates of charge and discharge of batteries.. This thesis addresses these objectives by designing, fabricating, and testing a solar harvesting vehicle with an academic purpose. 1.3. Hypothesis. The hypothesis of this work is that solar photovoltaic energy, with a catchment area reduced to the available space in the vehicle’s roof, is sufficient to feed by itself the systems of traction, direction, and operation of a heavy load electric harvesting vehicle for selection fruit. 1.4. Background. Since the industrial revolution, many machines have been created in the framework of human tasks automation. The image of the first mass-production factories, where people located in the assembly lines repetitively performing a strictly defined work during all.
(22) 10. day, have been falling quickly in the past. This is being replaced by hundreds of robotic arms that exceed in precision, strength, and speed to the human skills to perform repetitive movements, but now predefined by a code and without the necessity of individual extended training. 1.4.1. Harvesting Machines. In the case of harvest in agriculture, fully robotic automation is a standard that is not yet possible to achieve due to geometrical complexities of plants and delicacy required in handling the fruit. Almost 50 years ago, Shepardson et al. (1970) performed a review of the existing harvesting machines to that date (see Figure 1-2). Most of the reviewed current mechanisms in those years are still actively used today, intending from the beginning to reduce the high costs of harvesting in the fruit production process.. a) Cornel multifruit harvester. b) CRCO grape harvester. c) Field-testing the Cornel in apples. d) Concord vines trained on GDC. Figure 1-2: Experimental mechanical harvest machines in the early 1960s.4. 4. Source: See reference Shepardson et al. (1970)..
(23) 11. One of the main reasons for the early success of these mechanisms was the cooperative work of agronomists and engineers in the co-design of orchards and harvesting machines. This practice ensures complete adaptability of booths, orchards, and machines, as well of an optimized production (Larbi & Karkee, 2014), but it requires essential investment into research and development, to implement, test and validate the new designs. There are different levels of achievable harvest automation, which have been identified with the research and are shown as a progression in Figure 1-3. This thesis focuses on the second level. The engine behind the automation progression in harvesting techniques is the need to send clean fruit to customers without brushes and with a high degree of selectivity. These requirements are merged with the production interest to maintain the business profitably, then the stage of a company can be determined according to the size and technological disposition of the producers. Different national efforts have been made to move forward from traditional manual harvest. New ladder designs and lightweight materials such as aluminum have been used to release physical effort and improve labor efficiency, maintaining the current harvest process and reducing the complexity of the implementation. From words of the managers, working conditions have been improved, but not higher efficiency has been found.. Figure 1-3: Levels of harvest automation..
(24) 12. Harvesting platforms are the best solution up to date that keeps using human skills to select and to pick-up carefully the fruit maintaining competitiveness efficiency at low cost. There are many alternatives based on the same concept but with modifications between them (see Figure 1-4).. a) Fratelli Festi Bins 25. b) Pulcinelli PSRF 2.46. c) Automated Ag Bandit Xpress7. d) Billo Big 20008. Figure 1-4: State of the art in harvesting platforms.. 5. Source: http://www.fratellifesti.it/bins_2.php# Source: https://www.pulcinellicosmec.com/produzione/macchina-per-raccolta-frutta-mod-psrf-2-4.html 7 Source: https://www.automatedag.com/banditxpressgallery 8 Source: http://www.billosrl.it/es/big-2000.php 6.
(25) 13. The main characteristics of these are summarized next: •. Edges with high horizontal three-bar railings, at mid stomach, mid-leg and near the feet for safety, ergonomic and productive reasons. •. Double extensible platforms by the sides, independent and hydraulic powered. •. Independent wheel improvement. •. Height and base level adjustable hydraulically. •. Diesel powered. The differences between the solutions are features like electric powered, hybrid equipped, leveling of the platform, individual height adjusting, hydraulic steering, steering wheel, joystick, the inclination of bar railing, among others. Many of the harvesting machinery (including platforms, mechanic and robotic solutions) that has been designed in a specific region is unlikely to function with equal performance in a different one. This is principally due to differences in geographic, environment, plant species, culture, and social conditions, where most of the original requirements change, not being the same with which the machine was initially designed. That is why the direct use of foreign machinery, without the implementation of the necessary changes, is destined to fail, as has been the case of some national producer’s investments. They reported that the platforms were too wide or too short for their orchards, the trees were not conditioned (very long branches), jams on large slopes and thick grooves, and lack of location for the baskets without a processing system. Also, they affirm that people are still more skillful with ladders, and one of the main disadvantages of the platforms is workers focusing too much on productivity, leaving aside the selectivity. In sum, implementing machinery in the harvest requires the redesign of the processes, the organizational form of the workers, and also of their payment systems. Chile is a developing country that has begun to make its way in the industrial automation race, but there is still a significant road to travel to equate the investments in scientific research of developed countries. In the particular case of fruits harvest,.
(26) 14. there are some national solutions designed to semi-automate the processes which are slowly starting to be attractive to producers. The MC01 is the perfect example of a domestic machine created by Cosecha Mecanizada (COMEC) in response to the specific requirements of the Chilean vines (see Figure 1-5). The downside of the mechanical harvest, besides what has already been exposed regarding fruit handling, is the post-selective management that is no longer carried out by people. Harvesting machines like MC01 remove all the fruit at once without pre-selecting it, increasing the complexity of the packaging lines adding automated sorting process. There are several studies focused on fully automating crop processes, with millions of dollars invested in research. Li et al. (2011) make a review of the harvesting methods up to date and their potential use in automated systems. The results show that some automatic systems have been practiced to a trade-off between the conventional harvesters and mechanical harvesters. Still, none of those methods match the capability of the human labor faultlessly, especially in the vision and the recognition capability.. Figure 1-5: MC01 grapes harvesting machine made in Chile by COMEC.9. 9. Source: https://www.cosechasmecanizadas.cl/cosechadora-uvas.
(27) 15. 1.4.2. PV Electric Vehicles (EV). EVs have recently begun to replace those with internal combustion (IC) engines, but it is essential to consider that both were invented only with a couple of years of difference between them. At the beginning of the industrial revolution, the main characteristic that prevailed those years was the range of autonomy and the easy of refueling acquisition of ICs. Nowadays, thanks to technological advances, the autonomy of EVs has been dramatically improved, achieving results that exceed the traditional ones. Despite this, there is still no robust and distributed network of chargers, making it familiar to see the owners parked and inside their vehicles waiting for one of the few existing chargers per station to be vacated. Some projects are trying to solve this issue where the proposal is to change the entire bank of batteries, so customers do need to wait for the whole recharge process, but there are still some details to solve as is the difference in the useful life of used batteries and their ownership. On the other hand, the real environmental impact of electric vehicles is mostly obtained when the energy comes from non-conventional renewable sources or nonfossil sources. This is because if the electrical power is produced by gas or coal plants, the final efficiency of the electric vehicle is maintained in similar numbers to the internal combustion vehicles. Several studies have analyzed solar energy as a fuel for electric vehicles, but all agree that the current efficiency of photovoltaic cells is not enough to feed a commercial vehicle exclusively, and commonly is used only in an ultra-light competition car, or just to auxiliary power systems. 1.5. Methodology. The design of the solution was achieved from research to test in 4 months starting in September 2016. The principal methods used were scrum and design thinking. Scrum is a process focused on the results and the agility of a project. The use is extensive from.
(28) 16. software to product development and is especially suitable for complex environments where the requirements are not fixed or are customizable, meaning that they could change as the project progresses. For the other hand, design thinking is a methodology that uses anthropological studies and techniques such as short ethnographies with semi-structured interviews, or card sorting, to allow the identification of a list with fundamental requirements that must meet any solution to the problem or opportunity discovered. The process (see Figure 1-6) ensures that having the technical knowledge and experience to develop a technologically robust solution, this last is going to be relevant to the “problem” or “need” identified from the beginning, after the implementation of the solution. Also, the proposed methodology introduces a preliminary step to the traditional design process, forcing to question the problem submitted by a third party and using anthropological research to identify the root of the problem through the identification of its requirements.. Figure 1-6: Design Thinking iterative process.10. 10. Source: https://www.nngroup.com/articles/design-thinking/.
(29) 17. The “empathize” phase was addressed with field research into the standard characteristics of orchards to identify the requirements of workers and producers. For this, more than 4 hours of videos, interviews with the workers, harvesting process and short interviews with the workshop manager about their field experience were realized and analyzed. Later, during one of the tests implementing the prototype, the traditional harvesting process was experienced side by side with the workers, giving valuable data by breaking the barriers with them and earning their trust. Also, a review of state of the art regarding technology, products, and academic research was conducted to “define” and complete the “understand” phase, leading to the situation requirements. From the result of this investigation, a structured and defined list was obtained which is presented in a section later. The “ideate” phase was carried out with the individual addressing of each requirement, preparing an experimental modular design based on the mentioned list and on the benchmarking of the solutions that try to solve the problem of low productivity and high physical demand of fruit harvest, especially those focused on platforms concept. The improvements developed focused on vehicle steering, traction, dimensional platform flexibility, and ultimately the robustness of the overall design. 1.5.1. Chassis & Steering. The vehicle was required to move at low speed with high-level steering control in off-road terrain. Once within the orchard, an exceptional performance demand in the steering system had to be considered when changing rows and while driving within the confined space to avoid damaging the branches of the trees. In consequence, the proposal consisted in a 4-wheel steering (4WS) system, independent axes, and electrically powered each one. According to the academic literature, a 4WS allows a two-wheel steering vehicle to reduce its turning radius by half (Lohith, Shankapal, & Monish Gowda, 2013). The problem then was in the specifications, the implementation, and the control design. Figure 1-7 shows the particular capabilities of an electric 4WS independent system..
(30) 18. Figure 1-7: 4-Wheel Steering movements capabilities. It is electric because if the axes were mechanically connected, a design only could cover crab steering (d) or round steering (e), but not both together. To make a mechanical system able to switch between these two states, a highly sophisticated design need to be conceived, including the disadvantage of the enormous additional mechanical effort to turn both axes at the same time. The proposal then, was to use two front chassis of vehicles and joining them, electrically powering the steerable axis of each one, leaving both independent, and allowing to perform all the movements from Figure 1-7. It is important to mention that the vehicle is never going to get stuck when the moves are mixed, or in the transition from one to another state, or in partial movements. This is because when the vehicle starts from (a) state, and one of the axes is moved in any direction, the vehicle change immediately to (b) or (c) state. If both axes are driven at the same time, the vehicle will enter to (d) or (e) state immediately. Depending on the direction where each axis was run, the axes are returned to the neutral position (collective or individually) the vehicle would pass through (b) or (c) but eventually will back to (a) always in a fluid process. All these features mean a unique utility when the vehicle is closer to a wall of trees, uneven, with the front more distant than the tail, i.e., then the driver can quickly level it by turning the rear axis and moving forward only a couple of meter, without wasting time neither compromising the.
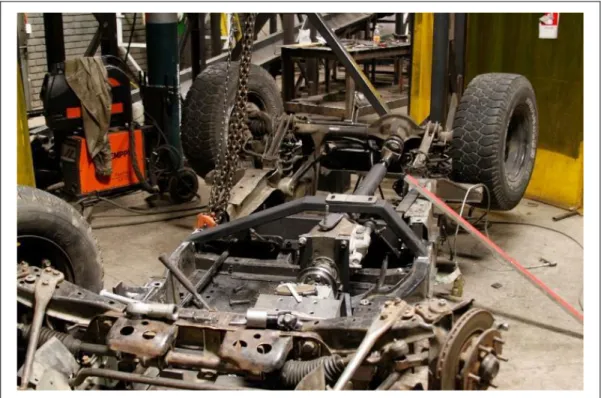
(31) 19. harvest. Another example could be when the vehicle is harvesting a double wall of trees, but closer to one of them, then the driver only need to move both axes in the same direction, entering to crab state (d), and moving forward to be even without losing the parallelism with the row in the process. A particular case occurs when the vehicle finishes an end row. Orchards space is optimized to get as much as trees as possible in the field, then at the borders of the terrain, it becomes difficult to enter to a row with a large vehicle and even harder to change from one row to the next. Then the round steering state (e) is highly required to optimize the length of the vehicle and orchards. In order to facilitate the design, a chassis of a previous prototype vehicle was used and the second was acquired in a junkyard instead of designing an entirely new 4WS system. The decision was based in the use of recycled vehicle components that still have a much useful life, reducing costs, manufacture resources, time, and promoting the concept of the applied CE (Fundación Economía Circular, 2017). As this is a research prototype, there is no issue in using old components that still work. Besides, the concept can also be expanded to final product designs, but renting it under leasing modality or similar instead of selling it, and does not jeopardize the customer’s quality appreciation of the product. One of the axes needs to come from a 4x4 vehicle. The reason is that at least one of them was necessary to give traction to the vehicle and being steerable at the same time, but front wheel drive vehicles do not have a fixed axis, either differential because usually the gearbox is coupled directly, and the suspension axes are independent. For this reason, the chosen 4x4 chassis was a Jeep Grand Cherokee 98. After checking the blueprints of the two chassis, a Computer Aided Design (CAD) was developed using the software Autodesk Inventor Professional 2017 (see Figure 1-8) to replicate both frame on 3D in order to design the intersection structure and ensure that there was no interference or structural weakness in the final merge of the chassis. The main difficulty in the union process was the gap in height and width between both frames, including also the original wheel size difference that had to be.
(32) 20. considered to maintain the chassis at a horizontal level in the subsequent standardization with traction wheels.. Figure 1-8: CAD chassis. Front Kia Besta (black), front Cherokee (grey), and joint structure (blue).. Figure 1-9: Fabrication of the chassis..
(33) 21. An essential reference used during the design of the solar vehicle was the book " The Automotive Chassis Engineering” by Reimpell, Stoll, & Betzler (2001), which is considered a masterpiece in vehicle design. In there was inspired the chassis structure, reviewed the Ackerman geometry concept, checked the suspension, and based the main calculations for the mechanical systems design. Between the different researched alternatives of power steering systems (BOSCH, 2015; Seminarsonly.com, 2016), electric linear actuators were found to be the most suitable option according to the requirements, especially considering the high required force to turn the wheels of a heavy load vehicle, which is calculated below. Each axis was carefully measured and calculated to have a maximum steering angle β of 25° for Besta Front (BF), and 18° for Cherokee Front (CF), equal to left or right (see Figure 1-10.a). The length of the steering arm 𝑎 (1) on each axis (2) is 0.15 m, the linear actuator (3) is fixed to the axis allowing to turn the wheel (4) when it extends or contracts by pushing the steering arm and converting linear movement into rotational on the wheel (see mechanism in Figure 1-11). As the tail of the actuator is going to be fixed to the axis after a ball joint, the calculation of the real maximum travel distance should consider the variation angle between the actuator and the axis ∆𝜃, but as the length of the arm is far smaller than the length of the actuator, that variation can be approximate to zero: 𝑦𝑖𝑒𝑙𝑑𝑠. 𝑎 ≪ 𝑙𝑎𝑐𝑡𝑢𝑎𝑡𝑜𝑟 →. ∆𝜃 ≅ 0. (1.1). In addition, the objective is to determine the maximum variation in travel length of the actuator, where it comes from full left angle −𝛽 to full rigth +𝛽, making the beginning of 𝜃 angle almost equal to the end (see Figure 1-11): 𝜃𝑙𝑒𝑓𝑡(−𝛽 ) ≈ 𝜃𝑟𝑖𝑔ℎ𝑡(+𝛽 ). (1.2). Then, the maximum distance that the linear actuator should be able to travel (see Figure 1-10.b), from one side to the other is given by D, where it is equal to: 𝐷 = 2𝑎 sin 𝛽. (1.3).
(34) 22. Then, for each axis the travel distances are: 𝐷𝐵𝐹 = 2 × 0.15 sin 25 = 0.13 m 𝐷𝐶𝐹 = 2 × 0.15 sin 18 = 0.093 m. a) Steering top view detail. b) Arm geometry. c) Wheel front view. Figure 1-10: Diagrams of the steering system.. Figure 1-11: Full axis top view steering system..
(35) 23. Using a 1.5 factor of safety with the most significant value to clearance the limits and to not damage the linear actuator’s mechanism, it should have then a maximum travel length of: 𝐷 = 1.5 × 0.13 = 0.20 m It is necessary also to know the force F needed to characterize the linear actuator that turns both wheels of each axis from one side to the other, as is shown in Figure 1-11. The steering arms (1) of each wheel are connected through a link bar (5) and both push-pull together with the linear actuator (3) that is connected to the axis (2) with a ball joint as a rear support. The travel limit is established by sensors (6) at the end of each angle rotation. The force F then is the double of the required torque T to rotate each wheel individually, but divided by the steering arm length: 𝑇. 𝐹 = 2𝑎. (1.4). To obtain the torque, first, it is necessary to know the load force N on each wheel. The total mass of the vehicle, including 8 people on board (80 kg each) and 3 bins (500 kg each) is 2,940 kg. Then the load in each wheel is given by N, where 𝑚𝑔 is the total weight (mass by gravity constant): 𝑁= 𝑁=. 𝑚𝑔. (1.5). 4 2940×9.8 4. = 7,203 N. To calculate the torque, it is necessary also to know the pressure of the tire including the parameters shown in Figure 1-10.c. The tires used were Goodyear model wrangler 31x10.50 R15 LT. Each one has a maximum load capacity of 1,020 kg at 50 psi (350 kPa), a diameter of 31 inches (787.4 mm) which means a radius r of 0.3937 m, and width w of 0.267 m. The pressure used 𝑃𝑎 was 40 psi (276 kPa) considering the total weight estimated before. In equilibrium, the area of the contact surface (8) of the wheel is given by:.
(36) 24. 𝑁. 𝐴=𝑃. (1.6). 𝑎. Because the force applied to the tire to not go down is equal to the pressure inside the tire by the area in touch with the ground. Then, using the Equation 1.6, the area is: A=. 7203 276×103. = 0.0261 m2. Then, the torque is given by the integration of the differential torque function (see Figure 1-12 and Equation 1.7) where 𝜇 is the coefficient of friction from the terrain.. Figure 1-12: Contact surface of the wheel with the ground. 𝑇 = ∫ 𝑑𝑇. (1.7). 𝑑𝑇 = 𝑟𝑑𝐹. (1.8). 𝑑𝐹 = 𝜇𝑃𝑎 𝑑𝐴. (1.9). In this case, the highest coefficient of friction in which the tire is going to be submitted with full load is from loose gravel terrain condition; then the coefficient 𝜇 is 0.5 (Reimpell et al., 2001). The contact surface area is assumed to be circular shape for practical reason, then the parameters of this surface are: 𝐴 = 𝜋𝑅 2. (1.10a).
(37) 25. However, from Equation 1.6 the area was already calculated, the parameters are then: 𝐴. 𝑅 = √𝜋. (1.10b). 𝑅 = √0.0261/𝜋 = 0.091 m This allows to solve the integral and calculate the torque using Equations 1.7 to 1.9. Considering 𝑑𝐴 as a complete circle double differential using polar coordinates: 𝑑𝐴 = 𝑟𝑑𝜃𝑑𝑟. (1.11). 𝑇 = ∬ 𝑟𝜇𝑃𝑎 𝑟𝑑𝜃𝑑𝑟. (1.12a). 𝑇 = 2𝜋 ∫ 𝑟𝜇𝑃𝑎 𝑟𝑑𝑟. (1.12b). 𝑅. 𝑇 = 2𝜋𝜇𝑃𝑎 ∫0 𝑟 2 𝑑𝑟. (1.12c). 𝑇 = 2𝜋𝜇𝑃𝑎 𝑅 3 ⁄3. (1.12d). 𝑇 = 2𝜋 × 0.5 × 276 × 103 × 0.0913 ⁄3 𝑇 = 217.8 Nm Then, using Equation 1.4, the force required by the actuator is obtained: 𝐹=2. 217.8 0.15. = 2,904 N. Using a 1.5 factor of safety so as not overload the actuator, the final required force is: 𝐹 = 1.5 × 2,904 = 4,356 N With this both parameter (length travel and force) it was possible to find the right linear actuator to fit the requirements. Between all the options, the fastest was the SKF CAHB-21 (see Table 1-1). The speed was an additional but important.
(38) 26. parameter because the response from moving the wheels from one to another side should be comparable to the time of the steering wheel, which is about 4 seconds at normal speed. The reason of this is to make the vehicle easy to drive, without the necessity of special training, and using the experience acquired driving a normal vehicle. The longest axis has a travel length of 0.094 m. Hence the required speed needs to be at least: 𝑆 = 𝐷/𝑡. (1.13). 𝑆 = 0.094⁄4 = 0.024 m ∙ s−1 Table 1-1: Technical specification of linear actuator SKF CAHB-2111 Parameter. Value. Voltage. 24 V. Ultimate push-pull static load. 4500 N. Speed at full load. up to 0.045 m∙s-1. Stroke. 0.20 m. Operating temperature. -40 to +85°C. The control of the steering system was designed with two joysticks (each for one axis) as a user interface, and a Siemens PLC as a receptor of the input signal from the limit sensor and the joystick, sending an output signal to relays connected in parallel to the actuators. In addition, it was going to be necessary to drive the vehicle on asphalt sometime, but rarely carrying the same amount of weight. This is why additional calculations were made in the same way before to determine the load on the linear actuators, with eight people on board, but without the bins. Considering the 𝜇 coefficient of dry. 11. Source: http://www.skf.com/cl/products/actuation-systems/linear-actuators/cahb-series/cahb21e/index.html.
(39) 27. asphalt equal to 1, and a total mass load of 1,440 kg, the result shown a required force F of 3,000 N on the actuator after safety factor of 1.5. The selected actuators then should work fine.. Figure 1-13: Linear actuator (black) installed in the chassis upside down.. 1.5.2. Traction system. The traction is one of the most current demanding electrical systems in EVs. In this work, as the objective is to rely only on photovoltaic energy, the design of the traction is one of the most crucial steps. On the harvesting process, the forward movements of the proposed concept vehicle need to be precise, short and consistent. The traction needs to be reliable enough considering the total load, and sometimes it needs to be able to increase the maximum speed limit to move vast distances faster, i.e., from the storage warehouse to the field. In addition, as some stuck in deep groves where mentioned by managers during the interviews, the vehicle required a high torque traction system and a clean space under the chassis to bypass these issues..
(40) 28. The proposal of solar photovoltaic energy as exclusive power source dictates the use of efficient electric motors. The benefits of using these over the traditional diesel engines are many, being the first quietest, do not pollute, do not consume oxygen, have a fast start, are easily reversible in directional rotation, reversible in power, have a more straightforward manufacture, lower cost, higher performance, higher efficiency, regenerative brake capabilities, and are very controllable in speed. The main drawback of EVs is the energy storage capability, where still besides the technological advances nothing can be compared with the specific energy (Wh/kg) found in gasoline, which is around 10,000 Wh/kg in comparison to the 150-300 Wh/kg found in the state of the art of Li-ion batteries (Dixon, 2010; Kimura, Seki, Shin, Takahashi, & Makino, 2016). However, the idea of this heavy-duty EV concept is to maintain always the energy on the bank of batteries, considering an intermittent use and a continuous charge with photovoltaic energy on the field, thus never running out of power. In addition, the weight of the batteries is not an issue because of the overall loads, which is higher. The electric vehicle (EV) industry is currently dominated by two types of electric motors, brushless DC (BLDC) and induction motors. Both have similar stators, work with a current inverter, and have regenerative braking capability, but they present differences in the rotor and its drive principle. An electric induction motor works with a squirrel cage rotor, which is magnetically induced by a rotary field of the three-phase current in the stator. This allows the motor to have torque from the start at any current frequency and it can be easily controllable in speed through the simple variation of the frequency of the current, without the need for an absolute positioning sensor, only from speed. On the other hand, a BLDC motor works with a rotor of permanent magnets, which allows it to follow the stator by adjusting the frequency of the field, but in order to start from zero, the frequency needs to do so. In addition, it requires an absolute position sensor to be able to have speed control, usually a hall effect sensor. Both types of motors do not have significant differences until here, besides the specific kind of control code. The most important differences lie in the.
(41) 29. greater complexity of the induction motors, but the lower cost due to the absence of permanent magnets, and the higher temperature generated in the induction stators, but their ability to modify the magnetic flux of the stator into different speeds. Despite this, there are no substantial distinctions that position one over the other, and just as there are different types of internal combustion engines for various applications, the same happens with electric motors (Wally Rippel, 2007). Then, following the same approach of recycled components mentioned in the past section, the electric motor used was a BLDC 5 kW Golden Motor obtained from a previous version prototype of harvesting vehicle. It was attached to a reduction box of 10:1 and the axis used, mentioned before from the Cherokee chassis, comes with a differential that has an internal reduction as well. The proposal consisted then in connecting all these components in series, but with the goal of obtaining high torque at low speed efficiently. The main characteristics of the motor are summarized in Table 1-2. The motor controller used was from the same manufacturer, and its main features are outlined next in Table 1-3. Table 1-2: Technical specification of BLDC Motor HPM5000B12 Parameter. Value. Rated voltage. 48 V. Rated power. 5,000 W. Rated current. 120 A. Rated speed. 3500 rpm. Maximum efficiency. 91%. The primary objective in the design of the traction was to achieve the torque requirements, ideally with the less current consumption possible. Hence, the system needs to work on the highest torque point, which is 24.12 Nm raised at 2,389 rpm as. 12. Source: https://www.goldenmotor.ca/HPM48-5000.pdf.
(42) 30. shown in Figure 1-14 and Table 1-4, where the efficiency at that point is 72.1% with a peak current consumption of 176.4 A. Table 1-3: Key features of BLDC Motor Controller HPC300H4836013 Features Regenerative braking Brake control Slope holding control Cruise speed control FWD/REV control Overheat protection for both motor and controller Programmable via USB PC/Laptops DSP control Dual controller synchronous drive. 13. Source: https://www.goldenmotor.com/HPC%20Series%20Controller%20User%20Guide.pdf.
(43) 31. Figure 1-14: Test curve Golden Motor HPM5000.14. Table 1-4: Test data Golden Motor HPM500014 Description. Current/A. Torque/Nm. Speed/rpm. Efficiency. Upload point. 8.18. 0.36. 4389. 42.2%. Efficient point. 73.69. 7.73. 3861. 88.4%. Max. power point. 175.4. 21.28. 2892. 80.2%. Max. torque point. 176.4. 24.12. 2389. 72.1%. Rated rotate point. 132.9. 14.54. 3476. 86.1%. Now, to determine the ideal gear ratios to keep the electric motor working efficiently, it is necessary to calculate the required torque to move the vehicle, which. 14. Source: https://www.goldenmotor.ca/HPM48-5000Curve.pdf.
(44) 32. can be obtained as follow, where 𝑇𝑤 is the torque at the traction wheels, 𝑟𝑤 is the radius of the wheels and 𝐹𝑡 is the tractive force: 𝑇𝑤 = 𝐹𝑇 𝑟𝑤. (1.14). The tractive force is composed of four main forces; the tire rolling resistance force 𝐹𝑟 , the slope gravity force 𝐹𝑔 , the aerodynamics drag force 𝐹𝑑 , and the acceleration force 𝐹𝑎 . 𝐹𝑇 = 𝐹𝑟 + 𝐹𝑔 + 𝐹𝑑 + 𝐹𝑎. (1.15). 𝐹𝑟 = 𝑘𝑟 𝑚𝑔. (1.16). 𝐹𝑔 = 𝑚𝑔 sin 𝛼. (1.17). 1. 𝐹𝑑 = 2 𝜌𝑣 2 𝐶𝑑 𝐴. (1.18). 𝐹𝑎 = 𝑚𝑎. (1.19). The rolling resistance force is the result of energy loss in the tire explained by the generation of heat coming from the deformation of the tire area in contact because of the spring properties of the rubber (Reimpell et al., 2001). The parameter 𝑘𝑟 is called the rolling resistance factor, which depends on the tire pressure and on the vertical reaction force N. Between the asphalt and the orchard, the highest 𝑘𝑟 value is presented in dirt/mud terrain, with a factor of 0.037 (Chauhan, 2015). The slope gravity force is the action of pulling or pushing the vehicle when it is climbing or descending an inclined surface. The hardest case scenario to consider in this work is the vehicle ascending on a platform with an angle 𝛼 of 10° in order to be transported. The total weight in this case is going to be only the vehicle carrying the driver. For a second case scenario, the inclination of the orchard considered is an angle 𝛼 of 1° but carrying the full load. The aerodynamics drag force dependent from the geometry 𝐶𝑑 of the vehicle, the cross-sectional area 𝐴, and the density of the air, because a bad combination could create turbulences in the fluid and vacuum effect.
(45) 33. at the back when the shape is short and squared. But it is more dependent on the speed of the vehicle, which is quadratic. Considering that the vehicle is not designed to move at high speed, this force is assumed to be marginal, and its order can be observed in Figure 1-15. Last but not least, in this work the acceleration force is one of the main components of the total traction force because of the heavy weight, and it depend from the total mass and the desired acceleration of the vehicle, which is programmed to be 0.5 m/s2.. Figure 1-15: Ranges of participation in total tractive force at different speeds of a Volkswagen Golf.15 For the technical purpose, the first calculation is going to be the orchard case. Using Equations 1.15 to 1.19, and with the parameters obtained from the literature, the tractive force is: 𝐹𝑟 = 0.037 × 2,940 × 9.81 = 1,067 N 𝐹𝑔 = 2,940 × 9.81 sin 1° = 503 N. 15. Source: See reference (Reimpell et al., 2001).
(46) 34. 𝐹𝑎 = 2,940 × 0.5 = 1,470 N To demonstrate the marginal order of the aerodynamic force, it is calculated this time: 1 𝐹𝑑 = 1.225 × 32 × 0.8 × 2 = 18 N 2 It is important to consider that the forces are applied in different space-time frames, i.e., the aerodynamic only apply when the vehicle is achieving speed incrementally, while acceleration force decrease as the vehicle raises the speed limit desired. The total tractive force calculated next consider all the forces as a maximum peak current demand when the vehicle starts from the rest: 𝐹𝑇 = 1,067 + 503 + 1470 + 18 = 3,058 N Then, with a radius of 0.39 m, the required torque at the wheels is: 𝑇𝑤 = 3,058 × 0.39 = 1,193 Nm Using a safety factor of 1,5 to include the friction losses and the inertia of internal components: 𝑇𝑊 = 1.5𝑇𝑤. (1.20). 𝑇𝑊 = 1.5 × 1193 = 1,790 Nm Finally, the minimum ratio necessary for the traction system is given by: 𝑅𝑎𝑡𝑖𝑜𝑚 = 𝑇𝑚 : 𝑇𝑤. (1.21). 𝑅𝑎𝑡𝑖𝑜𝑚 = 24.12: 1,790 𝑅𝑎𝑡𝑖𝑜𝑚 = 1: 74 Also, the same calculations for the second case scenario, ascending a platform or a steep road of 10°, with a curb weight of 1,000 kg by gravity, resulting in a second minimum ratio of:.
(47) 35. 𝑅𝑎𝑡𝑖𝑜𝑚,2 = 1: 26 The design then needs to be contingent on the highest ratio. The selected components of the traction system are summarized next in Table 1-5. Following the circular economy concept of this work, the gearbox was acquired in the same junkyard than the chassis, in La Pintana. The reduction box was extracted from another project together with the motor, and the gearbox was from a Chevrolet LUV. The universal shaft was fabricated, and the differential comes with the chassis. A particular piece was necessary to design and to manufacture in order to connect the reduction box with the gearbox. Table 1-5: Traction system component list with ratios Component. ratio. BLDC motor. 1:1. Reduction box. 1:10. 4-speed gearbox. 1st gear 1:3.8 2nd gear 1:2 3rd gear 1:1.5 4th gear 1:1. Universal shaft. 1:1. Differential. 1:3. The total system ratio of all the components connected in series depends on the gear selected on the gearbox, then the minimum and maximum values are: 𝑅𝑎𝑡𝑖𝑜𝑆,𝑚𝑖𝑛 = 1: 30 𝑅𝑎𝑡𝑖𝑜𝑆,𝑚𝑎𝑥 = 1: 114 This ratio allows fulfilling the torque requirements. On the other hand, the motor was tested and was not possible to achieve a higher motor speed than 𝜔𝑚 =.
(48) 36. 2,000 rpm because of software limitations. Then, the maximum allowed speeds for the vehicle are given by: 𝑉𝑚𝑎𝑥 = 2ω𝑚 𝜋𝑟𝑤 𝑅𝑎𝑡𝑖𝑜⁄60 𝑉𝑚𝑎𝑥;𝑆,𝑚𝑖𝑛 = 2 × 2,000𝜋0.39. (1.22) 1 1 = 2.7 m/s 30 60 1. 1. 𝑉𝑚𝑎𝑥;𝑆,𝑚𝑎𝑥 = 2 × 2,000𝜋0.39 114 60 = 0.7 m/s Summarizing, the final design of the vehicle has a traction system with a minimum speed limit of 0.7 m/s (2.52 km/h) and a maximum of 2.7 m/s (9.72 km/h), where the maximum torque at the wheel is of 2,750 Nm, and the minimum is 723.6 respectively. The only drawback with the design is that because of the high reduction to achieve maximum torque requirements; the maximum speed was lower than the desired. 0.7 𝑚/𝑠 < 3 𝑚/𝑠 Besides, the length to move the vehicle forward is about 5 meters per cycle, and the resulted time to achieve the next sector is given by the acceleration time up to top speed 𝑡1 , and the constant speed time 𝑡2 : 𝑡 = 𝑡1 + 𝑡2. (1.23). 𝑣𝑓 = 𝑣𝑜 + 𝑎𝑡1. (1.24a). 𝑡1 = 𝑡1 =. 𝑣𝑓 −𝑣𝑜. (1.24b). 𝑎 0.7−0 0.5. = 1.4 s 1. 𝑑1 = 𝑣𝑜 𝑡1 + 2 𝑎𝑡1 2 1 𝑑1 = 0 × 1.4 + 1 × 1.42 = 0.98 m 2. (1.25).
(49) 37. 1. 𝑑2 = 2 (𝑣𝑓 + 𝑣𝑜 )𝑡2 𝑡2 = 𝑣. (1.26a). 2𝑑. (1.26b). 𝑓 +𝑣𝑜. 𝑡2 =. 2(5 − 0.98) = 5.74 s 0.7 + 0.7. 𝑡 = 𝑡1 + 𝑡2 = 1.4 + 5.74 = 7,14 𝑠 The resulted time is not ideal, but it is acceptable to move between the sectors giving space to react with the direction system.. a) Motor BLDC with reduction box. b) Gearbox Chevrolet LUV. c) Cherokee’s differential. d) Universal shaft. Figure 1-16: Components of the traction system..
(50) 38. Figure 1-17: Complete traction system installed on the chassis upside down.. 1.5.3. Platform. Stone fruit orchards in Chile have a wide variety of parameters and configurations. Also, as was mentioned above in the motivation, to facilitate optimum performance of a semi-automated harvesting machine, it is necessary that both orchards and machine be designed on the whole. A project of this type requires many resources to be able to be carried out, considering that an entire sector of an orchard should be worked experimentally, jeopardizing the profitability of the owners but may generate substantial long-term benefits. In the case of this work, neither the resources nor the possibility of designing a whole orchard sector in conjunction with the harvesting machine was feasible, so it was finally decided to focus the design of the platform on obtaining the most considerable flexibility with the available resources. The orchards accessible to test the vehicle were two (see Figure 1-18),.
Figure


+7


Documento similar
These base stations were powered with renewable energy sources (wind, solar and geother- mal) and, in addition, equipped with batteries as well as connected to the traditional
Powered by TCPDF (www.tcpdf.org)... Powered by
By answering this research questions it will possible to fulfill the general objective of this thesis that is to: determine the effect in the convective heat transfer
To control and ensure the compensation of the EVSE reactive power consumption, the EBox communicates with a grid analyzer to know the reactive power value and send the
In order to have a reference of injected field for the coupling analysis, the field reaching the car is measured with a probe placed on top of the vehicle (Fig. The probe
On the implementation, deployment and evaluation of a networking protocol for VANETs: The VARON case
VARON enables the optimization of vehicle-to-vehicle communications in a secure way by combining a network mobility approach – that supports vehicle-to-Internet communications via
By using a maximum power point tracking algorithm, the operating point of the thermoelectric generator is kept under control while using its power‑temperature transfer function
The Battery Chargers community focuses on the various advances in technologies that improve energy efficiency in the transfer of energy in the charging of the batteries of
