Determinants of research versus development : the case of Chilean companies
58
0
0
Texto completo
(2) PONTIFICIA UNIVERSIDAD CATOLICA DE CHILE ESCUELA DE INGENIERIA. DETERMINANTS OF RESEARCH VERSUS DEVELOPMENT: THE CASE OF CHILEAN COMPANIES. ANDRÉS V. ABARA. Members of the Committee: ALFONSO CRUZ TOMÁS REYES JOSÉ MIGUEL BENAVENTE YADRAN ETEROVIC. Thesis submitted to the Office of Research and Graduate Studies in partial fulfillment of the requirements for the Degree of Master of Science in Engineering Santiago de Chile, Enero 2019.
(3) To my family and schoolfellows. ii.
(4) ACKOWLEDGEMENTS. In the first place, I would like to express my gratitude to the advisor of this work, professor Alfonso Cruz, for his advice and support during the process. He did this enriching experience possible. Second, I want to thank Danisa Herrera, Secretary from the post grade direction, for her good disposition, and the people in charge of the island computer from the innovation division of the Chilean Ministry of the Economy, for providing me timely access to data and program outputs. Likewise, I thank the members of the Committee Tomás Reyes, José Miguel Benavente and Yadran Eterovic for their time and invaluable feedback during the evaluation process.. iii.
(5) TABLE OF CONTENTS Page ACKOWLEDGEMENTS ........................................................................................... iii LIST OF TABLES ........................................................................................................v ABSTRACT................................................................................................................ vi RESUMEN ................................................................................................................ vii I.. ARTICLE BACKGROUND ...............................................................................1. II.. DETERMINANTS OF RESEARCH VERSUS DEVELOPMENT: THE CASE OF CHILEAN COMPANIES ...................................................................................7 1. Introduction .....................................................................................................7 2. Conceptual framework ....................................................................................9 3. Data…………………………………………………………………………20 4. Methodology .................................................................................................15 4.1 Econometric model of R&D determinants .........................................15 4.2 Variables .............................................................................................17 5. Results ...........................................................................................................22 5.1 Descriptive statistics ...........................................................................22 5.2 Selection equations for Type II Tobit models.....................................26 5.2 Intensity equations for Type II Tobit Models .....................................28 6. Discussion and conclusions ...........................................................................30. REFERENCES ...........................................................................................................37 APPENDIX .................................................................................................................46 A. PAIRWISE CORRELATION MATRIX OF MODEL VARIABLES .....47.
(6) LIST OF TABLES Page Table 3.1. Number of Observations per Year and Activity. ........................................... 15 Table 5.1. Descriptive Statistics of the Model Variables. ............................................... 25 Table 5.2. Marginal Effects of the Selection Equations .................................................. 27 Table 5.3. Intensity equations results. ............................................................................. 29 Table A.1. Pairwise correlation matrix.. ......................................................................... 48. v.
(7) ABSTRACT. Research and development (R&D) has been extensively studied in the innovation literature but its two constituent components (R versus D) have not received sufficient attention as distinct activities. The present study investigates the characteristics peculiar to each one, generating results that could contribute to the design of more effective public and corporate policies for promoting technological innovation. The proposed analysis uses panel data from Chilean firms active in R&D over the period 2011-2016 that was gathered through R&D spending surveys conducted by the Chilean Ministry of the Economy. Among other advantages, the surveys provide disaggregated data on research and development as separate items of expenditure. Selection models are used to study the determinants of the two activities. The results show that each activity has a distinctive pattern of determinants governing the probability a firm engages in it and the associated level of spending if the firm does. The differences between the two sets of determinants are found to relate to industry characteristics such as market concentration and economic sector, firm characteristics such as size and inter-firm cooperation agreements, and public policy variables such as the receipt of subsidies.. Keywords: R&D Determinants, Research, Development, Innovation. vi.
(8) RESUMEN. Las actividades de investigación y desarrollo (I+D) han sido ampliamente estudiadas por la literatura de la innovación. Sin embargo estos estudios no han distinguido suficientemente las actividades de investigación respecto de las de desarrollo (I versus D), sino que las han asumido como variables indistintas. Esta investigación profundiza en las características propias de cada una de ellas, lo cual permite el diseño de políticas públicas y corporativas de innovación tecnológica más efectivas. Se utiliza un panel de datos de empresas chilenas activas en I+D que cubre el periodo 2011-2016, construido a partir de las encuestas de gasto en I+D del Ministerio de Economía de Chile. Entre otras ventajas, estos datos entregan información desagregada del gasto en investigación y en desarrollo. Se utilizan modelos de selección para estudiar los determinantes de estas dos actividades. Los resultados muestran que hay patrones distintivos en los determinantes de cada una, tanto en la probabilidad de que una firma incurra en ellas como en el nivel de inversión, una vez que decidió hacerlo. Las diferencias en ambos grupos de determinantes se relacionan con características de la industria tales como la concentración del mercado y el sector económico, características de la firma como el tamaño y los acuerdos de cooperación, y en medidas de política pública como el recibimiento de subsidios.. Palabras Clave: Determinantes de la I+D, Investigación, Desarrollo, Innovación. vii.
(9) viii.
(10) 1. I.. ARTICLE BACKGROUND. A major theme in the literature on scientific and technological innovation is the determinants of spending on research and development (R&D).1 The centrality of this analysis is due to the fact that the accumulation of R&D leads to technological change which in turn generates growth in total factor productivity (Griliches, 1979; Nelson & Winter, 1982; Schumpeter, 1942) and thus contributes to countries’ economic development (Romer, 1990). However, most empirical studies have treated R&D as a single activity even though the disaggregation into its two component activities has revealed different behaviors both in their determinants (Aerts & Thorwarth, 2009; BargeGil & López, 2014a; Link, 1982; Mansfield, 1981) and their effect on productivity (Czarnitski & Thorwarth, 2012). R&D can and should be broken down into its main components, research and development.2 In general terms, research involves the acquisition of new knowledge whereas experimental development is the application of knowledge derived from research and practical experience to the production of new products and processes or the improvement of existing ones. In this sense, development is a much more applied activity with more tangible results (Barge-Gil & López, 2014b; Lee & Park, 2017) in the form of such things as patents or intellectual property rights. By contrast, the research phase is more theoretical and specialized (Leifer & Triscari, 1987).. 1. Research and development (R&D) are defined as systematic and creative work aimed at increasing the stock of knowledge and finding new applications for existing knowledge (OECD, 2015). 2 Research can itself be broken down into basic and applied. The OECD (2015) defines these two types of research activities as follows: Basic research: experimental or theoretical work undertaken primarily to acquire new knowledge of the underlying foundation of phenomena, without any particular application or use in view. Applied research: original investigation undertaken in order to acquire new knowledge, directed primarily towards a specific practical aim..
(11) 2. A possible explanation for this undifferentiated treatment is the lack of disaggregate data on them as separate phenomena (Barge-Gil & López, 2014b; Lee & Park, 2017). Yet its heterogeneity should be taken into account in the design of R&D programs when evaluating the efficiency of subsidies to such efforts (Clausen, 2009). Public policies such as tax incentives have proved to be significant in increasing firms’ innovation efforts (Crespi et al., 2016). The reason is that knowledge is a public good and thus attracts suboptimal amounts of private investment due to the ease with which it can flow from the innovating firm to its rivals (Czarnitzki & Thorwarth, 2012), who can then share in its use without sharing in its costs (Arrow, 1962). In the case of Chile, subinvestment in R&D has a long history, currently accounting for only 0.4% of the country’s GDP while the OECD average is 2.3% (OECD, 2018). The purpose of innovation policies should therefore be to reduce the gap between private and socially optimal research and development expenditure. Research and development are quite different from each other in their nature (Leifer & Triscari, 1987; Lim, 2004), purpose (OECD, 2015), in the way they are managed (Barge-Gil & López, 2014b; Leifer & Triscari, 1987) and the stage at which they are executed (Czarnitzki et al., 2011; Rosenberg, 1982). In fact, the development phase is closer to the moment its results are marketed and relates more to a learning by using process, in which gains are generated as a result of the subsequent use of a product. By contrast, the research phase often has no particular intended application and involves a learning by doing process, where gains are internal to production (Rosenberg, 1982). Research is therefore more subject to uncertainty and is less able to attract external investment. This translates into greater financial constraints (Czarnitzki et al., 2011; Lee & Park, 2017) on top of the aforementioned public good effect and thus a level of investment even lower than what is socially desirable (Czarnitzki & Thorwarth, 2012). Early investigation in this area by Link (1982) and Mansfield (1981) on U.S. firms uncovered significant differences in the determinants of research versus those of.
(12) 3. development. Divergences have also been found in the effects of spending on the two activities upon the capacity to innovate (Barge-Gil & López, 2014b) and productivity (Czarnitzki & Thorwarth, 2012). In their study of Spanish of manufacturers, Barge-Gil & López (2014a) detected different effects both in the respective probabilities of undertaking research and development work and the intensity of expenditure on each one of them conditional upon the decision to invest in R&D, highlighting the need for differential analyses of the two components. In light of the foregoing, the objective of the present study was to explore the differences between the determinants of research and those of development. This purpose leads naturally to the following research question we have posed for this study: Do research and development activities have distinct patterns of determinants at the firm level? To this end, an analysis was conducted of the separate intensities of research and development activities and their determinants, using information from the annual surveys of expenditure and employment in research and development conducted for the period 2011 through 2016 by the Instituto Nacional de Estadísticas (INE), Chile’s government statistical bureau. The surveys gather information on private companies known to carry out research and development (INE, 2018), from which an unbalanced panel was constructed of firms active in R&D in the sense that they had engaged in such activities in any year of the indicated period. The resulting database had information on 1,447 firms active during any year of the indicated period, and contained a total of 5,253 observations. The identification of the R&D activity spending determinants was performed by estimating sample selection models. The specific econometric technique used is known as Tobit Type II (Amemiya, 1985). This approach was adopted for two reasons. First, it can correct for self-selection in the sample units,3 and secondly, because it has been widely 3. The self-selection problem arises in this case from the fact that in any given period, not all the firms in the sample report positive R&D spending. The variable of interest thus depends on a previous decision..
(13) 4. applied in innovation studies. Since the R&D variables are observed for a set of entities whose R&D activity over the period of study is not continuous, the sample selection bias issue must be addressed. Not to do so could result in differences in the coefficients and in intercept and marginal effects biases. The approach attempts to estimate the determinants of R&D using two separate equations (Benavente, 2005; Crespi & Zuniga, 2012; García-Quevedo et al., 2014). The first equation models the decision whether to engage in R&D activities or not, denoted the decision or selection equation, while the second equation determines the level of investment in such activities conditional upon a decision taken to engage in them, known as the principal or intensity equation. Assuming normality, a joint estimation of the selection and intensity equations will generate consistent and efficient parameter estimates (Amemiya, 1985), so the model is solved with maximum likelihood. We must also bear in mind that if the two equations’ errors are correlated, heteroscedasticity will be present and the conventional standard error estimator will be inconsistent due to the sample’s inherent selection bias (Wooldridge, 2002). In addition, since we are using longitudinal data the possibility of serial correlation has to be considered. The standard errors are therefore calculated using variance estimates clustered by firm, which yields errors that are robust to both serial correlation and heteroscedasticity (Angrist & Pischke, 2009). The results of the models constitute evidence for the existence of differences in the determinants between research and development activities, uncovering distinct both firm characteristics and company or public policy characteristics. Belonging to the service sector has a particularly positive influence on the probability of engaging in research relative to those in the sector related to the extraction of natural resources. The probability of conducting research rather than development did.
(14) 5. rise with firm size, but for businesses that decided to undertake either of these activities, size was inversely proportional to R&D spending intensity. Public funding turned out to be a major determinant in research intensity, but less so for development intensity. Finally, cooperation on R&D was more detrimental to investment in research than in development. This article contributes to the literature in three ways. First, it characterizes research and development as distinct activities in the context of a developing country, thus allowing for an improved understanding of the processes behind innovation and resource assignment. Second, it extends published analyses of the R&D phenomenon, heretofore focused principally on manufacturing, to the primary and tertiary sectors of the economy (Barge-Gil & López, 2014a, 2014b; Czarnitzki & Thorwarth, 2012; Lim, 2004; Link, 1982). Note in regard to the former case that in Chile the primary sector dominates the country’s economy. Thirdly, this study proposes recommendations for the design of public and corporate policies aimed more specifically at promoting R&D at firm level, recognizing the above mentioned distinct characteristics in order to improve the effectiveness of these policies. Particularly, creating specific R&D programs for the primary and tertiary sectors such as mining and tourism may be useful in promoting R&D at the national level. Concrete measures have been taken for these industries in countries such as Korea and China (Rubalcaba, 2015). In Chile, the mining industry has experienced a noticeable decline in productivity (OECD, 2018), suggesting that increased R&D expenditure by companies in the sector would improve the country’s productivity. The need of more publicity and greater accessibility for project funding programs such as those run by Chilean government organizations like CORFO and CONICYT also arises.4 The projects chosen for funding should be those furthest from the marketing stage. 4. CORFO (Corporación de Fomento de la Producción) and CONICYT (Comisión Nacional de Investigación Científica y Tecnológica) are Chilean government agencies whose missions are to promote.
(15) 6. Data from the Chilean Ministry of the Economy’s innovation surveys (Ministerio de Economía, 2016) show that only 9% of firms that engaged in innovation activity in 20132014 received public financing while 51% of the other firms surveyed said they were unaware of these government sources of support for innovation. A more effective system of legal protection is required if cooperative arrangements are to result in more R&D. This is particularly so for firms specializing in research given that for them, the negative effect of cooperation on spending is particularly strong. Such protection can be achieved or improved through license agreements and efficient procedures for registration of patents and trademarks. Finally, since investment in both and research and development declines with firm size, policies should be developed to promote entrepreneurship through the creation of small businesses, which are more active in R&D. This could be achieved through policies that help reduce the fixed costs associated with R&D investment.. entrepreneurship and innovation, and improve Chile’s human capital and its scientific and technological capabilities..
(16) 7. II.. DETERMINANTS OF RESEARCH VERSUS DEVELOPMENT: THE CASE OF CHILEAN COMPANIES. 1. Introduction. A major theme in the literature on scientific and technological innovation is the determinants of spending on research and development (R&D). The centrality of this analysis is due to the fact that the accumulation of R&D leads to technological change which in turn generates growth in total factor productivity (Griliches, 1979; Nelson & Winter, 1982; Schumpeter, 1942) and thus contributes to countries’ economic development (Romer, 1990). Yet although research and development as a whole embraces a spectrum of undertakings, previous empirical works have not sufficiently distinguished those involved in research from the ones relating to development, considering the twin components of R&D as interchangeable variables rather than two distinct activities. A possible explanation for this undifferentiated treatment is the lack of disaggregate data on them as separate phenomena (Barge-Gil & López, 2014b; Lee & Park, 2017).. Research and development are in fact quite different from each other in their nature (Leifer & Triscari, 1987; Lim, 2004), purpose (OECD, 2015), in the way they are managed (Barge-Gil & López, 2014b; Leifer & Triscari, 1987) and the stage at which they are executed (Czarnitzki et al., 2011). Whereas research involves the acquisition of new knowledge, development entails directing this knowledge towards the creation of new products and processes or improving existing ones. This implies that policies for managing R&D both at the public and private business levels must reflect the different types of effort needed to drive innovation (Clausen, 2009; Lee & Park, 2017). The effectiveness of these policies is a key factor in increasing private R&D investment (Crespi et al., 2016)..
(17) 8. A series of recommendations for conducting R&D surveys contained in the OECD’s Frascati Manual (OECD, 2015) has led to improvements in data collection and the generation of data sets that are comparable internationally. This information has brought forth a stream of new studies on the determinants of the components of R&D (Czarnitzki et al., 2011; Czarnitzki & Thorwarth, 2012; Lee & Park, 2017). These works are still too recent, however, for there to be a consensus on the patterns of determinants that underlie research activities as opposed to those of development. Studies that do disaggregate R&D produce estimates that tend to differ from those found when research and development are treated as a single activity. This heterogeneity may be explained by the fact that the development phase is closer to the market than the research phase, the latter taking place at earlier stages and producing results that are less tangible. The returns to research are therefore more uncertain and more likely to be underfinanced due to market failures (Arrow, 1962; Czarnitzki et al., 2011) such as information asymmetry and appropriability of results (Lee & Park, 2017). Early investigation in this area by Link (1982) and Mansfield (1981) on U.S. firms uncovered significant differences in the determinants of research versus those of development. Divergences have also been found in the effects of spending on the two activities upon the capacity to innovate (Barge-Gil & López, 2014b) and productivity (Czarnitzki & Thorwarth, 2012). In their study of Spanish of manufacturers, Barge-Gil & López (2014a) detected different effects both in the respective probabilities of undertaking research and development work and the intensity of expenditure on each one of them conditional upon the decision to invest in R&D. In light of the foregoing, the objective of the present study was to explore the differences between the determinants of research and those of development. This was tackled by estimating sample selection models and then making a range of statistical.
(18) 9. comparisons of the resulting model coefficients. The selection models typify both the decision to invest and the amount invested in each activity. The data for the models were taken from R&D surveys of firms operating in Chile. This article contributes to the literature in three ways. First, it characterizes research and development as distinct activities in the context of a developing country, thus allowing for an improved understanding of the processes behind innovation and resource assignment. Second, it extends published analyses of the R&D phenomenon, heretofore focused principally on manufacturing, to the primary and tertiary sectors of the economy (Barge-Gil & López, 2014a, 2014b; Czarnitzki & Thorwarth, 2012; Lim, 2004; Link, 1982). Note in regard to the former case that in Chile the primary sector dominates the country’s economy. Thirdly, this study proposes recommendations for the design of public and corporate policies aimed more specifically at promoting each component of R&D at firm level. The remainder of this article is organized in six sections. Section 2 develops the conceptual framework briefly outlined above through a survey of the literature and the statement of the research question for the study, Section 3 sets out the methodology that was followed, Section 4 describes the nature and characteristics of the data set, Section 5 reports our results, and Section 6 presents our conclusions and recommendations.. 2. Conceptual framework. In the years since the seminal work by Griliches (1979), an extensive literature has grown up on the determinants of research and development and its relationship to productivity, inspired by the recognition of R&D as a fundamental input to industrial production (Crespi & Zuniga, 2012; Hall, 2011). However, most studies have treated R&D as a single activity even though the disaggregation into its two component activities has.
(19) 10. revealed different behaviors both in their determinants (Aerts & Thorwarth, 2009; BargeGil & López, 2014a; Link, 1982; Mansfield, 1981) and their effect on productivity (Czarnitski & Thorwarth, 2012). This heterogeneity should be taken into account in the design of R&D programs when evaluating the efficiency of subsidies to such efforts (Clausen, 2009). Public policies such as tax incentives have proved to be significant in increasing firms’ innovation efforts (Crespi et al., 2016). The reason is that knowledge is a public good and thus attracts suboptimal amounts of private investment due to the ease with which it can flow from the innovating firm to its rivals (Czarnitzki & Thorwarth, 2012), who can then share in its use without sharing in its costs (Arrow, 1962). The purpose of innovation policies should therefore be to reduce the gap between private and socially optimal research and development expenditure. Fundamental to our analysis is that R&D can and should be broken down into its main components, research and development. In general terms, research involves the acquisition of new knowledge whereas experimental development is the application of knowledge derived from research and practical experience to the production of new products and processes or the improvement of existing ones. In this sense, development is a much more applied activity with more tangible results (Barge-Gil & López, 2014b; Lee & Park, 2017) in the form of such things as patents or intellectual property rights. By contrast, the research phase is more theoretical and specialized (Leifer & Triscari, 1987). It has further been observed that research and development differ not only in their nature but also temporally and the fact that they allow different forms of learning relevant to the innovation process (Rosenberg, 1982). The development phase is closer to the moment its results are marketed and relates more to a learning by using process, in which gains are generated as a result of the subsequent use of a product. By contrast, the research phase often has no particular intended application and involves a learning by doing.
(20) 11. process, where gains are internal to production. Research is therefore more subject to uncertainty and is less able to attract external investment. This translates into greater financial constraints (Czarnitzki et al., 2011; Lee & Park, 2017) on top of the aforementioned public good effect and thus a level of investment even lower than what is socially desirable (Czarnitzki & Thorwarth, 2012). In order to guide resource assignment and reduce the level of uncertainty in technological R&D programs, project managers must be well-informed on the state of development of the technologies they are considering (European Space Agency, 2008). The necessity for such knowledge is such that various government and military organizations in the English-speaking countries and the European Union have begun to employ a technology maturity scale consisting of as many as nine technology readiness levels (TRL) for technological innovation. This metric was originally devised by the U.S.based National Aeronautics and Space Administration (NASA) for measuring how far a given technology was from being sent into space (Héder, 2017). The scale starts with levels defined in purely scientific and theoretical terms as in basic research, and ends with levels that are applied and operational as in experimental development. Barge-Gil & López (2014a) have demonstrated the heterogeneity of firms’ R&D behavior, highlighting the need for differential analyses of the two components. Estimates obtained in studies where R&D is treated as a single activity tend to differ from the results obtained when research and development are disaggregated into their individual components. The authors’ results on the Schumpeterian hypotheses5 variables found an inverted-U relationship between R&D investment intensity and manufacturing firm size in Spain and that the decline with size is more pronounced for research. In other words, the positive effect of greater size is smaller on research than on development. However, when Tsai & Wang (2005) analyse research and development as a single activity, a (non5. Schumpeter (1942) proposed two hypotheses: (i) R&D activity increases more than proportionally to firm size, and (ii) R&D activity increases with market concentration..
(21) 12. inverted) U-shape relationship between size and R&D spending arises. As regards market concentration, Artés (2009) reports an inverted-U relationship with R&D activity while Link (1982) demonstrates that it is positively related to the development phase of R&D but not the research phase. Results from a range of studies on other variables such as growth of demand show a significant effect on innovation (Becheikh et al., 2006). In particular, Artés (2009) concludes that demand growth has a positive effect on the decision to conduct R&D but the coefficient for the level of R&D investment is not statistically significant. By contrast, when research and development are analyzed separately, Barge-Gil & López (2014a) find that the demand effect on the decision to engage in R&D is positive and significant only for development but on spending intensity the effect is significant for both. As regards financing, Aerts & Thorwarth (2009) report that public funding increments development spending but may crowd out private firms’ own investment in research. Clausen (2009), however, demonstrates using data on Norwegian companies that subsidies earmarked for projects “far from the market” increase private R&D spending mainly through the research component. On the other hand, subsidies for projects “close to the market” crowd out private R&D spending mainly through a reduction in the amount destined for development. To sum up, R&D is made up of a series of components that can be explained by factors whose statistical estimates have been found to differ, thus underlining the need to distinguish in empirical analyses between efforts in research and those in development. Published studies have used a variety of data sources employing different measures of innovation (Hall, 2011), contributing to the variations observed in the results so that no consensus on the determinants of the two R&D components has yet been arrived at..
(22) 13. The purpose of the present work, which is to explore the differences between research and development and establish the determinants of each one, leads naturally to the following research question we have posed for this study: Do research and development activities have distinct patterns of determinants at the firm level? The answer to this question should contribute to the present state of knowledge on the subject because results are comparable internationally and provide support for the design of more effective policies on technological innovation. To our knowledge, this issue has been analyzed solely for the manufacturing sector, and only for developed countries. The present study, by contrast, is focused on a developing economy and incorporates both the natural resource and service sectors as well as manufacturing.. 3. Data. The data for this study were obtained from the annual surveys of expenditure and employment in research and development conducted for the period 2011 through 2016 by the Instituto Nacional de Estadísticas (INE), Chile’s government statistical bureau. The surveys gather information on private companies known to carry out research and development (INE, 2018), from which an unbalanced panel was constructed of firms active in R&D in the sense that they had engaged in such activities in any year of the indicated period. The companies surveyed were classified by industry in accordance with the fourth revision of the International Standard Industrial Classification (ISIC Rev.4) published by the UN (United Nations, (2009)), and ranged from microbusinesses with sales from USD 0.40 to USD 96,144 and large businesses with sales of more than USD 4,006,017. 6. 6. The dollar figures were converted from Chilean pesos using the exchange rate for December 22nd, 2018..
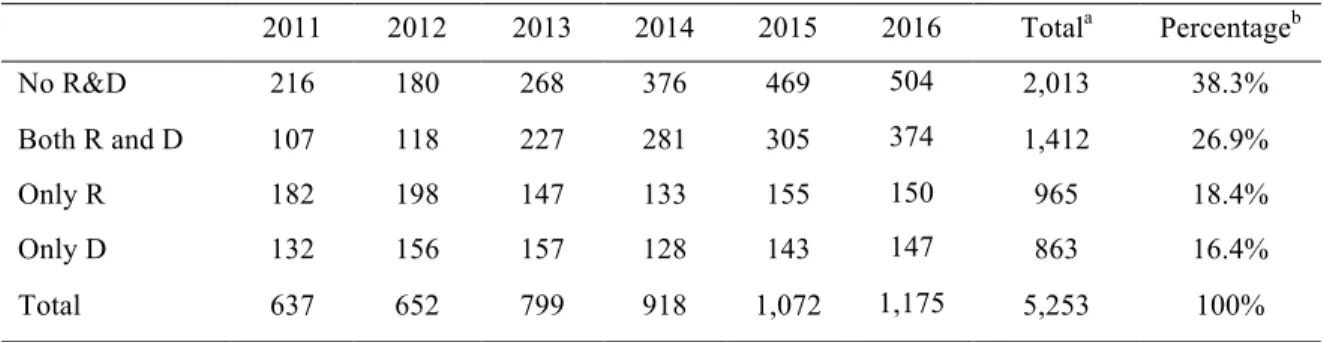
(23) 14. The survey database has three particular advantages for the present study. First, the data are comparable across countries given that they are validated by the OECD in the sense that the method of collection follows the guidelines set out in that organization’s Frascati Manual (OECD, 2015). Second, the data not only provide information on R&D at the aggregate level but also on ‘R’ and ‘D’ individually, an essential feature for determining the characteristics of each one as a separate activity. Finally, since the information takes the form of panel data, it can be used to explore dynamic behavior that could not be analyzed with cross-sectional studies. Altogether, the final data set contained information on 1,447 different companies active in R&D, totaling 5,253 observations for the indicated period. The firms were distributed by activity (‘R’ or ‘D’) and year in Table 3.1. It shows that more than half of the firms performed either of these activities. With respect to firms performing one activity, firms specialized only in research were more common than those specialized only in development. Using the ISIC Rev.4 categories we created a more highly aggregated classification that grouped the 1,447 firms by the three broad sectors of the economy:7 primary (extraction of natural resources); secondary (manufacturing), and tertiary (services). The percentage distribution of the firms by these sectors was 11.0%, 39.1% and 49.9%, respectively.. 7. Primary sector: agriculture, forestry, fishing and mining. Secondary sector: manufacturing; construction; electricity, gas, steam and air conditioning supply; water supply and waste management. Tertiary sector: wholesale and retail trade; transportation and storage; accommodation and food services; information and communication; financial, administrative and real estate activities; education; health; recreation; others..
(24) 15. Table 3.1. Number of Observations per Year and Activity. 2011. 2012. 2013. 2014. 2015. 2016. Totala. Percentageb. No R&D. 216. 180. 268. 376. 469. 504. 2,013. 38.3%. Both R and D. 107. 118. 227. 281. 305. 374. 1,412. 26.9%. Only R. 182. 198. 147. 133. 155. 150. 965. 18.4%. Only D. 132. 156. 157. 128. 143. 147. 863. 16.4%. Total. 637. 652. 799. 918. 1,072. 1,175. 5,253. 100%. a. Total sum of observations per year for each activity.. b. Proportion of total observations for each activity over total sample.. 4. Methodology. 4.1 Econometric model of R&D determinants The specific econometric technique that will be used is known as Tobit Type II (Amemiya, 1985). This approach was adopted for two reasons. First, it can correct for self-selection in the sample units, and secondly, because it has been widely applied in innovation studies. Since the R&D variables are observed for a set of entities whose R&D activity over the period of study is not continuous, the sample selection bias issue must be addressed. Not to do so could result in differences in the coefficients and in intercept and marginal effects biases. The approach attempts to estimate the determinants of R&D using two separate equations (Benavente, 2005; Crespi & Zuniga, 2012; García-Quevedo et al., 2014). The first equation models the decision whether to engage in R&D activities or not, denoted the decision or selection equation, while the second equation determines the level of investment in such activities conditional upon a decision taken to engage in them, known as the principal or intensity equation..
(25) 16. Assuming normality, a joint estimation of the selection and intensity equations will generate consistent and efficient parameter estimates (Amemiya, 1985), so the model is solved with maximum likelihood. We must also bear in mind that if the two equations’ errors are correlated, heteroscedasticity will be present and the conventional standard error estimator will be inconsistent due to the sample’s inherent selection bias (Wooldridge, 2002). In addition, since we are using longitudinal data the possibility of serial correlation has to be considered. The standard errors are therefore calculated using variance estimates clustered by firm, which yields errors that are robust to both serial correlation and heteroscedasticity (Angrist & Pischke, 2009). The ML estimation involves dividing the observations into two groups by type of data, with each group presenting a different type of likelihood. Let !"∗ be the observed R&D expenditure and !$∗ its intensity. The two variables may be explained by a single set of independent variables &" and &$ , respectively. !"∗ determines the censoring of !$∗ given that intensity is only observed when R&D spending is positive. The first group of ∗ observations is the '( data items whose intensity variable !$) is not observed. The. probability the variable is not observed is the probability that expenditure is zero, that is, ∗ that *(!") ≤ 0).. The second observation group is the '" data items whose intensity is observed. The probability of this is defined by the probability function that both the expenditure and ∗ ∗ its intensity are observed, which is the case if !") > 0 and !$) > 0. Thus, the joint ∗ probability can be written as * !$∗ , !") > 0 &" , &$ ). The complete likelihood function is. as follows:. ∗ *( !") ≤ 0). ℒ= 34. ∗ * !$∗ , !") > 0 &" , &$ ) 35. (4.1).
(26) 17. The parameters estimated by maximizing this function will be consistent and asymptotically efficient on the assumption of normality and homoscedasticity of the noncensored error terms (Amemiya, 1985). A problem with ML estimation is that the function is not strictly concave so there is not necessarily a unique solution. In addition, since the inverse Mills ratio function is quasi-linear in its argument,8 if exactly the same variables are used for sets &" and &$ , multicollinearity will result (Wooldridge, 2002). To circumvent this, an exclusion variable must be included (Aerts & Thorwarth, 2009), that is, a variable that is in the selection equation but not the intensity equation. All the model variables are presented in the next subsection.. 4.2 Variables. In accordance with the methodology just described in the previous subsection and most empirical work on innovation (Barge-Gil & López, 2014a; Benavente, 2005; Hall, 2011; Link, 1982), the dependent variables used here were intensities, one each for research and development. They were defined as the ratio of spending on the respective activity to company sales.9 The use of intensities instead of a common spending measure has the advantage that the importance to firms of R&D activities can be evaluated given that their spending on it is normalized in terms of firm size. This avoids the misleading effect of the differences between the amounts invested by large and small companies, which in the. 8. The inverse Mills ratio is a function computed from de selection equation that is included as an additional regressor in the intensity equation. It corrects the sample selection bias. See Wooldridge (2002) for a more detailed explanation. 9 In the case of research intensity, investment was defined as the funding devoted to both basic and applied research..
(27) 18. former case may be much greater considering their more plentiful resources and the wider range of innovation activities they are involved in. The differences between the intensities of the various determinants of research and development were to be identified by explanatory variables. The variables used were in line with the literature testing the validity of Schumpeter’s hypotheses (Schumpeter (1942)) on firm and industry characteristics. Our analysis also attempted to include the more recent notion that innovation is influenced by demand and the market (Cainelli et al., 2006; Schmookler, 1962, 1966). This effect is known as the demand-pull effect. Following is a list describing all of the variables used to identify the different patterns impacting the respective intensities of research and development. Size: defined as the natural logarithm of firm’s average annual number of employees. This measure has been widely used in other studies as a proxy for firm size (Tsai & Wang, 2005), both in the selection and the intensity equations (Álvarez et al., 2015). It is associated with economies of scale and of agglomeration. In other words, larger size results in a greater spread of fixed costs over outputs associated with innovation (Cohen & Klepper, 1996) and use of spillovers (Leiponen, 2000). Age: defined as the natural logarithm of the difference between the current year and the year the firm began operations. Becheikh et al. (2006) maintains that there are two opposite effects of this variable: one which defends the idea (supported by Prakash Pradhan (2011) and García-Quevedo et al. (2014)) that the accumulation of knowledge is necessary for innovation, and the other (backed by Coad et al. 2016) which holds that greater firm age translates into more established procedures and routines that are a barrier to innovation..
(28) 19. Exports: a binary variable equal to 1 for all observations of a firm if it exported in one or more years. Internationalization of the firm’s market demand higher quality and greater product differentiation than local markets (Prakash Pradhan, 2011). This suggests that firms which are more productive or have greater competitive advantages have more access to global markets (Di Cintio et al., 2017). In the case of Chilean businesses, it has been shown that exporters are more likely to innovate than non-exporters (Zahler et al., 2014). This is so because innovation creates the competitive advantages necessary in order to compete internationally (Prakash Pradhan, 2011). It has also been shown for Chilean companies that exporting has a negative effect on R&D intensity (Cruz et al., 2018). This is probably due to the fact that firms which export already have a product that is sufficiently competitive to be marketed internationally (Audretsch et al., 2014) and so they moderate their R&D investment. Public Funding: a dummy variable that takes the value 1 for each year whether a firm received some form of public subsidy. It has been found to be positively related to R&D investment (Afcha & León López, 2014) and has become essential in Latin America for promoting innovation (Crespi et al., 2014; Crespi & Zuniga, 2012). Public funds are obtained conditional on the decision to invest in R&D, so it is included only in the intensity equation (Álvarez et al., 2015; Álvarez & Crespi, 2015; Costa-Campi et al., 2014). Foreign Ownership: a dummy variable equal to 1 when the firm’s capital structure has any foreign ownership. Companies belonging to multinational groups may prefer to carry out their R&D in the parent company’s home country, thus limiting the innovation activity they conduct in the countries hosting their subsidiaries (Resende et al. , 2014). This is especially true if the host country market is too small to justify the fixed costs of R&D (Crespi & Zuniga, 2012). The behavior of this variable is less well established and varies from country to country (Crespi et al., 2014; Crespi & Zuniga, 2012)..
(29) 20. Cooperation: a proxy for cooperation between firms on R&D. It is a binary variable that takes a unitary value if a firm engaged in both intramural and extramural R&D activities in a given year.10 Cooperation arises out of the synergies from simultaneous involvement in intramural and extramural R&D and from incoming know-how information flows (Cassiman & Veugelers, 2002; Lauterbach & Benavente, 2009). It has been argued that collaboration reduces the cost of uncertainty associated with research and development (Leiponen, 2000). However, only firms that are sufficiently able to appropriate the benefits of the innovation process and protect themselves from free-riding by outsiders on R&D collaboration arrangements are willing to participate in such (Cassiman & Veugelers, 2002). Demand: defined as the natural logarithm of the average sales growth at the sector level during the sample period. This variable represents the demand-pull effect (Becheikh et al., 2006; Di Cintio et al., 2017). Others have associated the effect particularly with development activity (Barge-Gil & López, 2014a) given that the latter is closer to the market than research (Czarnitzki et al., 2011). Concentration: represented by the Herfindahl index. It is measured separately for each of the three economic sectors as the summation over all firms of the square of an individual firm’s share in the total sales of its sector. The index changes from year to year. Following García-Quevedo et al. (2014), this metric is included in the model as the exclusion variable, based on the notion that market structure affects long-term decisions (the decision whether or not to invest in R&D) but not short-term ones (the decision regarding how much to invest in R&D) (Artés, 2009). Sector: a dummy variable for each economic sector to reflect the different technological contexts peculiar to each one that remain constant over time. These variables capture the 10. Intramural R&D includes all current expenditures and fixed costs for R&D carried out within the firm whereas extramural R&D is the amount spent outside it (OECD, 2015)..
(30) 21. ease of appropriation of R&D results and technology opportunities as well as other nonobservable sector-specific characteristics (Artés, 2009). Studies that disaggregate research and development deal primarily with certain specific industries, mainly in the manufacturing sector (Barge-Gil & López, 2014a, 2014b; Czarnitzki & Thorwarth, 2012; Link, 1982; Pavitt, 1984) and in a lesser degree to services (Álvarez et al., 2015; Crespi et al., 2014; Cruz et al., 2018; Leiponen, 2000; Tether, 2005). Only rarely is this done with the natural resources sector (George et al., 2015), probably because it is associated with the production of commodities or resources with little added value. Time fixed effects: a dummy variable for each year aimed at controlling time effects that are constant to all firms such as the effect of business cycles and other macroeconomic trends (Coad et al., 2016; Cruz et al., 2018; García-Quevedo et al., 2014). Note finally that all of the explanatory variables defined above are lagged in the models by one period in order to help decrease potential simultaneity bias and reverse causality concerns (Barge-Gil & López, 2014a; García-Quevedo et al., 2014)..
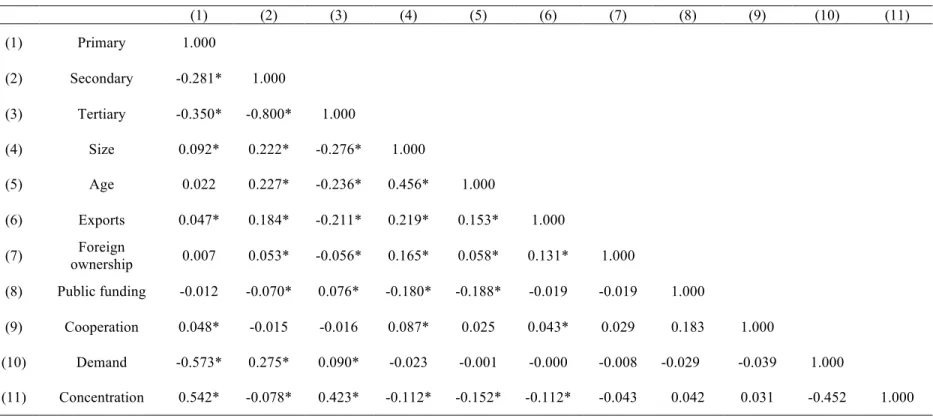
(31) 22. 5. Results. 5.1 Descriptive statistics We characterize each activity separately through a descriptive analysis of the variables used in the models gathered in Table 2;11 the corresponding correlations are found in Table A.1 of Appendix A. The first two columns of Table 2 show the values for the two subsamples of firms that respectively did (R and/or D) and did not (no R&D) carry out any R&D, while the third column gives the p-values for the differences between those values. For the primary and tertiary sectors, the number of observations indicating positive R&D expenditure was smaller than those that indicate no such spending, while for the secondary sector the figure was the other way around. These differences were found to be statistically significant at the 1% level. Firms that invested in R&D were on average larger and older than those that did not, the former averaging 400.54 employees and 22.19 years in operation while the latter averaged 324.02 employees and 19.70 years in operation. These differences were statistically significant at the 1% level, perhaps because R&D is greater in businesses whose procedures and operating units are more established. Positive export and foreign owned figures were significantly more frequent in firms that spent on R&D than those that did not at the 1% level. In other words, involvement with international markets was more evident in firms with positive levels of. 11. To test for multicollinearity, the variation inflation factors (VIF) are calculated for all of the model variables. The largest factor was 4.68 and the mean VIF was 2.03, indicating that for our models multicollinearity was not a problem..
(32) 23. R&D expenditure. By construction, they were the only companies that received public funds and carried out R&D in cooperation with others. Regarding demand, the difference between the two subsamples was statistically significant at the 5% level. Firms conducting R&D tended to operate in sectors with slightly higher sales growth rates. Finally, companies that did not spend on R&D tended to operate in markets that were somewhat more concentrated than those that did. This suggests that sectors dominated by relatively few firms act as a disincentive for firms with less power. Certain of the differences noted above continued to hold when firms that invested only in research (column (4)) or only in development (column (5)) were compared. The corresponding p-values are indicated in the last column of Table 2. Firms dedicated solely to research had the highest R&D intensity (10.01%) while in those devoted only to development the figure was significantly lower (7.06%) at the 1% level. Companies that engaged only in research had a research intensity of 9.39% while those undertaking either R&D activity had a research intensity of 5.24%. Meanwhile, firms performing only development had an intensity level in that component of 6.68%, whereas for those involved in either activity the development intensity was 3.64%. In other words, for either R&D component, firms had higher intensity values when they focused exclusively on one or the other, demonstrating the importance they give to each of the two activities when it is conducted separately. The number of firms from the secondary sector indicating positive development expenditure was higher than those indicating research expenditure, while for the tertiary sector was greater the frequency of observations with research expenditures. These differences were significant at the 1% level..
(33) 24. As regards the characteristics of the firms, neither Size, Age nor the Foreign Ownership coefficients differed significantly to any degree. Where differences were notable, however, was in the variables related to strategic decisions. In the case of exports, 56% of the research-only subsample sold products abroad, a percentage significantly lower than for the development-only subsample where the corresponding figure was 63%. Public funding was provided to 34% of firms doing only research but to just 27% of those active only in development, suggesting that subsidies are a more important source of financing in the early stages of R&D. And as for cooperation, firms devoted exclusively to research were 4% more likely to engage in it than those focused only on development. These differences were significant at the 1% level. Finally, while there was no significant difference in the impact of demand on the subsamples that did and did not conduct any R&D, there was a significant difference at the 1% level in the case of market concentration. Firms specializing in research operate in more concentrated sectors than those specializing in development..
(34) 25. Table 5.1. Descriptive Statistics of the Model Variables. (1). (2). No R&D Variablesa. Mean. (3). R and/or D SD. Mean. SD. p-value. a. (4). (5). (6). Only R. Only D. p-value. Mean. SD. Mean. SD. R&D intensity (%). -. -. 9.45. 18.10. -. 10.01. 19.17. 7.06. 14.74. <0.01. R intensity (%). -. -. 5.24. 13.16. -. 9.39. 18.57. -. -. -. D intensity (%). -. -. 3.64. 9.77. -. -. -. 6.68. 14.26. -. Primary (dummy). 0.12. 0.33. 0.10. 0.30. 0.01. 0.11. 0.32. 0.11. 0.31. 0.69. Secondary (dummy). 0.34. 0.47. 0.43. 0.49. <0.01. 0.35. 0.48. 0.49. 0.50. <0.01. Tertiary (dummy). 0.54. 0.50. 0.47. 0.50. <0.01. 0.53. 0.50. 0.40. 0.49. <0.01. Size (No. employees). 324.02. 996.49. 400.54. 1,331.55. 0.01. 401.54. 1,667.27. 391.14. 985.74. 0.43. Age (years). 19.70. 18.09. 22.19. 23.22. <0.01. 22.22. 23.22. 23.37. 22.91. 0.14. Exports (dummy). 0.52. 0.50. 0.61. 0.49. <0.01. 0.56. 0.50. 0.63. 0.48. <0.01. Foreign ownership (dummy). 0.12. 0.32. 0.15. 0.35. <0.01. 0.14. 0.34. 0.15. 0.35. 0.24. Public funding (dummy). 0.00. 0.00. 0.33. 0.47. <0.01. 0.34. 0.47. 0.27. 0.45. <0.01. Cooperation (dummy). 0.00. 0.00. 0.20. 0.40. <0.01. 0.20. 0.40. 0.16. 0.37. 0.01. Demand (%). 11.50. 7.86. 11.94. 8.30. 0.03. 11.74. 8.27. 11.91. 8.00. 0.34. Concentration. 0.07. 0.04. 0.06. 0.04. 0.01. 0.07. 0.05. 0.06. 0.04. <0.01. Observations a. 2,013. 3,240. Variable statistics are shown without the logarithmic transformation used in the models.. 965. 863. b.
(35) 26. 5.2 Selection equations for Type II Tobit models The selection equation results, although not corrected for selection bias, still serve to highlight the differences in the determinants of the decisions to invest in research or development. The marginal effects for the probability of investing in R&D are shown in the first column of Table 3 while those for research and development decisions separately as dependent variables are displayed respectively in the second and third columns of the table. The differences between the estimates of models (2) and (3) were determined by calculating the p-values using the Wald test, in which the null hypothesis was that the coefficients were the same. Note that the dummy variable for the primary sector was excluded due to the three sector dummies’ linear dependence; the coefficients for the other two sectors were the differences from that of the primary sector. Firms in the secondary sector presented a higher probability of conducting both research and development than the primary sector. Firms in the tertiary sector are more likely to invest in research activities than the primary sector, but they showed no significant effect in the probability of having development expenditures. The firm size coefficient which was significant only for the development decision, had a significantly greater effect for the probability of performing development than research (p-value = 0.015). Briefly put, the bigger the firm, the more likely it engaged in development rather than research. Exports and Cooperation showed positive effects both on the decision to conduct research and the decision to engage in development. As for Concentration, this variable proved to be a determinant only for research activity. The greater was the concentration index, the more probable it was that the firm would conduct research. This result is aligned with the findings in the descriptive analysis..
(36) 27. Table 5.2. Marginal Effects of the Selection Equations (1) R&D decision. (2) Research decision. (3) Development decision. Secondary. 0.222*** (0.052). 0.180*** (0.053). 0.194*** (0.054). 0.813. Tertiary. 0.112* (0.045). 0.116* (0.045). 0.061 (0.045). 0.325. Size t-1. 0.015* (0.007). 0.006 (0.007). 0.024*** (0.007). 0.015. Age t-1. 0.000 (0.014). -0.005 (0.014). -0.023 (0.014). 0.293. Exports t-1. 0.068** (0.024). 0.048* (0.023). 0.078** (0.024). 0.244. Foreign Ownership t-1. 0.034 (0.029). 0.032 (0.033). -0.008 (0.028). 0.289. Cooperation t-1. 0.286*** (0.021). 0.260*** (0.027). 0.205*** (0.029). 0.163. Demand t-1. 0.048 (0.142). 0.102 (0.150). 0.134 (0.144). 0.840. Concentration t-1. 0.062** (0.022). 0.056** (0.020). 0.037 (0.020). 0.491. Year dummies. Yes. Yes. Yes. 3,808. 3,808. 3,808. Variable. Observations. 12. (4) p-value. a. Robust standard errors in parenthesis. a. p-value of the difference between variable means of columns (2) and (3).. * Significant at 10%. ** Significant at 5%. *** Significant at 1%.. 12. The number of observations from the models do not match those from the descriptive analysis because variables are included in the models with one-period time lags..
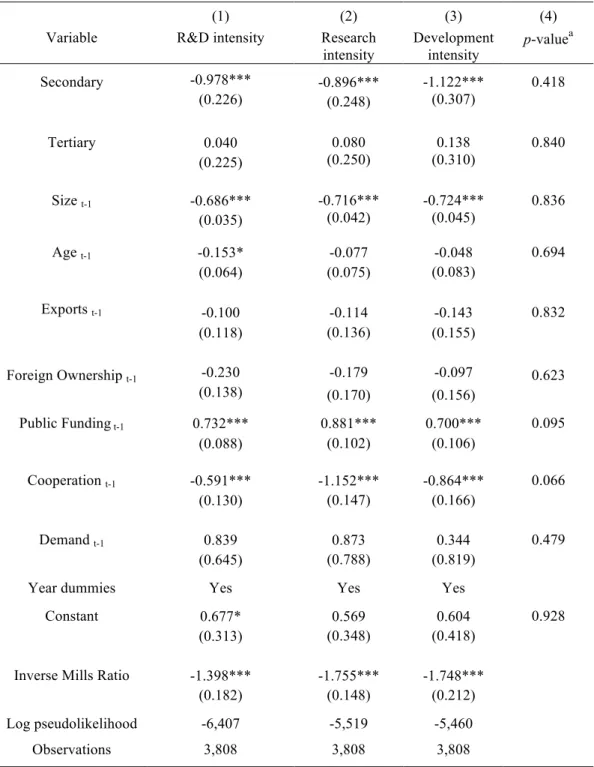
(37) 28. 5.2 Intensity equations for Type II Tobit Models The results of the intensity equations for the three selection models (R&D as a single activity, ‘R’ only, ‘D’ only) solved by maximum likelihood are set forth in Table 4. The coefficient estimates are laid out in similar fashion as in Table 3. The results derived with the intensity equations indicated determinants similar to those generated by the selection equations, but in some cases the signs were different. Firms in the secondary and tertiary sectors presented negative and positive effects, respectively, in all of the models. The secondary sector invests the least in R&D whereas the tertiary sector invests the most. The effect was statistically significant for the former but not for the latter, implying that the secondary sector was significantly different from the primary sector in both R&D activities. As regards firm characteristics, Size and Age were associated negatively with all three investment intensities, although the Age effect lost significance once the two component activities were distinguished. The greater was either characteristic, the less intense were the R&D efforts. The public funding variable had a positive effect in all equations. This implies that subsidies are a determinant for the intensities of both research and development, but the test comparing their coefficients revealed that the effect is significantly greater for the former activity (p-value = 0.095). In other words, an increase in resources devoted to R&D occurs mainly when funds are provided for the research phase. As for the cooperation variable, the effect turned out to be negative in all equations. The coefficient was significantly more negative for research intensity than development intensity (p-value = 0.066)..
(38) 29. Table 5.3. Intensity equations results. (1) R&D intensity. (2) Research intensity. (3) Development intensity. Secondary. -0.978*** (0.226). -0.896*** (0.248). -1.122*** (0.307). 0.418. Tertiary. 0.040 (0.225). 0.080 (0.250). 0.138 (0.310). 0.840. Size t-1. -0.686*** (0.035). -0.716*** (0.042). -0.724*** (0.045). 0.836. Age t-1. -0.153* (0.064). -0.077 (0.075). -0.048 (0.083). 0.694. Exports t-1. -0.100 (0.118). -0.114 (0.136). -0.143 (0.155). 0.832. Foreign Ownership t-1. -0.230 (0.138). -0.179. -0.097. 0.623. (0.170). (0.156). Public Funding t-1. 0.732*** (0.088). 0.881*** (0.102). 0.700*** (0.106). 0.095. Cooperation t-1. -0.591*** (0.130). -1.152*** (0.147). -0.864*** (0.166). 0.066. Demand t-1. 0.839 (0.645). 0.873 (0.788). 0.344 (0.819). 0.479. Year dummies. Yes. Yes. Yes. Constant. 0.677* (0.313). 0.569 (0.348). 0.604 (0.418). Inverse Mills Ratio. -1.398*** (0.182). -1.755*** (0.148). -1.748*** (0.212). Log pseudolikelihood. -6,407. -5,519. -5,460. Observations. 3,808. 3,808. 3,808. Variable. Robust standard errors in parenthesis. a p-value of the difference between variable means of columns (2) and (3). * Significant at 10%. ** Significant at 5%. *** Significant at 1%.. (4) p-value. 0.928. a.
(39) 30. To summarize, the answer to the study research question posed at the beginning of this report is that research and development do indeed have distinct patterns of determinants. Belonging to the tertiary sector has a particularly positive influence on the probability of engaging in research relative to those in the primary sector. The probability of conducting development rather than research did rise with firm size, but for businesses that decided to undertake either of these activities, size was inversely proportional to R&D spending intensity. Public funding turned out to be a major determinant in research intensity, but less so for development intensity. Finally, cooperation on R&D was more detrimental to investment in research than in development.. 6. Discussion and conclusions The empirical literature has traditionally considered R&D as a homogeneous phenomenon. However, research and development are two very distinct activities, both in their objectives and their practices. This being the case, a number of authors have suggested the need for defining policies specific to each one (Clausen, 2009; Czarnitzki et al., 2011). The purpose of the present study has been to explore the differences between the two and identify patterns of determinants for each of them with a view to designing R&D policies that are more effective. To this end, an analysis was conducted of the separate intensities of research and development activities and their determinants, using information from surveys of R&D spending by Chilean firms over the period 2011-2016. The resulting database was an unbalanced panel with information on 1,447 firms active during any year of the indicated period, and contained a total of 5,253 observations. The identification of the R&D activity spending determinants was performed by estimating sample selection models..
(40) 31. The results of the models constitute evidence for the existence of differences in the determinants between research and development activities, uncovering distinct both firm characteristics and company or public policy characteristics. Businesses in the primary sector were less likely to perform both research and development activities in relative terms. Once they decide to invest in those activities, the amount spent is higher than manufacturing firms. This is consistent with Cruz et al. (2018), who found that Chilean companies in natural resources invest on average more in R&D per sales unit than manufacturers. The extraction of raw materials involves technically sophisticated processes and a considerable degree of specialization based on scientific knowledge that must be obtained through research. Once this is achieved, the results suggest that these companies invest in development in order to innovate through improvements to existing products or processes that are relatively incremental given the comparatively unchanging nature of raw materials (Christensen, Dahl, Eliasen, Nielsen, & Ostergaard, 2011). As for businesses in the tertiary sector, they had a higher probability of investing in research than in development. This may be explained by the fact that service firms tend to engage in more intangible innovation activity (Crespi et al., 2014; Tether, 2005), which is inherently oriented towards research rather than development (Leifer & Triscari, 1987; OECD, 2015). As regards the size of the firms, the larger they are, the greater the probability of investing in development, reflecting the fact that big businesses have more market share and are thus more involved in activities relating to the adaptation of products to the consumer. This variable was decisive in explaining expenditure intensities of both research and development. As the size of the firms increased they spent less on R&D, in line with the literature invalidating the Schumpeter hypothesis according to which R&D activity grows with firm size (Baumann & Kritikos, 2016; Cruz et al., 2018; Segarra & Teruel, 2014). This negative effect is due to the fact that R&D intensity is greater in small businesses because they must introduce more disruptive innovations to earn a place in the.
(41) 32. market. Large firms, by contrast, tend to invest in incremental innovation projects (BargeGil & López, 2014a; Cohen & Klepper, 1996) given their focus on improving the efficiency of industrial processes with a view to immediate applications and short-term returns (Costa-Campi et al., 2014). The age of a firm was found to be inversely proportional to R&D intensity, in line with the recent literature (Baumann & Kritikos, 2016; Costa-Campi et al., 2014; Cruz et al., 2018). Older companies tend to develop bureaucracies and routine procedures, creating resistance to innovation (Becheikh et al., 2006). However, this result has been identified in cases where R&D was treated as a single joint activity. In the present study, upon examining research and development separately it was found that firms increasingly specialize in one or other of these activities as they age, suggesting that such specialization may require a certain degree of maturity. To the extent this is so, firm age would no longer be a barrier to innovation. Public funding also proved to be important in increasing R&D intensity. This finding is consistent with the existing literature, which has demonstrated that subsidies are an incentive for spending on innovation (Crespi & Zuniga, 2012) and R&D (Afcha & León López, 2014). But when the two activities were analyzed separately, it was found that the effect was more evident in the research stage. This suggests that the leverage of private resources is greater for research than for development. Receiving public funds provides a stronger stimulus in the stages where the gap between the public and private rates of return on R&D investment are greatest (Arrow, 1962; Clausen, 2009). Cooperation between firms proved to have a positive influence on the decision to invest in R&D activities, but a negative effect on the intensity of R&D spending. A possible explanation for this is that under such arrangements, sensitive information is at risk of being transmitted. This erodes the ability to appropriate the returns to innovation effort (Cassiman & Veugelers, 2002). When the two R&D components were examined.
(42) 33. individually in the intensity equations, the research coefficient turned out to be the more negative one. The reason is that the research stage is more distant from the final market and has more intangible results. Firms doing research are less likely to capture the benefits (Czarnitzki & Thorwarth, 2012), so cooperation agreements have a more depressive effect on research than on development. The effect of foreign ownership was not found to be significant for either of the R&D activities. In other words, multinational firms were not significantly different than domestic ones in their research and development intensities. On the other hand, there was consistency in that the coefficient was always negative for the intensity of any R&D activities. This may have been because multinationals tend to carry out their R&D in the home country of the parent company, thus limiting innovation activity in the host countries of the parent’s subsidiaries (Resende et al., 2014). Demand growth had a positive impact but for both R&D activities the effect was not significantly different from zero. This was due to the fact that demand-pull factors are related rather to R&D outputs (Crépon, Duguet, & Mairesse, 1998) such as technological innovations that may take a long time to materialize and may do so far from the places where the R&D was carried out and for the benefit of very different actors (OECD, 2015). Thus, the market does not exert a significant effect, although it may provide some incentive for R&D spending. Finally, exports increase the willingness to conduct both research and development, and have a negative but not significant effect for the intensity of these investments. This is consistent with what was recently found in another study on Chile, where exporters were shown to invest less in R&D (Cruz et al., 2018). For developing countries the international market does not necessarily constitute an incentive to innovate given that before a firm can export it must already have reached a competitive productivity level (Audretsch et al., 2014)..
(43) 34. The results just presented point to a series of recommendations for future research, public policy design and company R&D management. Research and development have their own characteristics that need to be recognized and studied in order to improve the effectiveness of policies, whether public or corporate, to increase R&D expenditure. The first of such characteristic is the economic sector. Contrary to natural resources industries, manufacturers reduce the resources per sales unit devoted to either research or development. This implies that creating specific R&D programs for industries in the primary sector such as mining, forestry or fishing, may be useful in promoting R&D at the national level. In the tertiary sector, promoting the adoption of information and communication technologies could foster research activities. Concrete measures in this way have been taken in countries such as Korea and China (Rubalcaba, 2015). The provision of public funds is also crucial for driving research. This suggests the need of more publicity and greater accessibility for project funding programs. The projects chosen for funding should be those furthest from the marketing stage. Data from the Chilean Ministry of the Economy’s innovation surveys (Ministerio de Economía, 2016) show that only 9% of firms that engaged in innovation activity in 2013-2014 received public financing while 51% of the other firms surveyed said they were unaware of these government sources of support for innovation. Given that cooperation reduces spending intensity on both components of R&D once the decision to invest is made, a more effective system of legal protection is required if cooperative arrangements are to result in more such activity. This is particularly so for firms specializing in research given that for them, the negative effect of cooperation on spending is particularly strong. Such protection can be achieved or improved through license agreements and efficient procedures for registration of patents and trademarks..
(44) 35. Finally, since investment in both research and development declines with firm size, policies should be developed to promote entrepreneurship through the creation of small businesses, which are more active in R&D. This study will, we believe, be useful for policy makers and R&D managers as well as academics. For policy makers, our findings should help in designing R&D policies that take account of the particular objectives of each R&D component. For R&D managers, they should provide support for decisions on the assignment of R&D resource to processes with different purposes. For academics, our results should contribute to a better understanding of the innovation process because no previously published studies have analyzed the differences between research and development in developing countries, and those that have been conducted in the developed world tend to focus on manufacturing (Barge-Gil & López, 2014a, 2014b; Czarnitzki & Thorwarth, 2012; Link, 1982). The main limitations of this study are that the observations are confined to a period of six years and a relatively modest number of firms. This was due to the fact that the survey used as the data source is relatively new and thus its coverage is still limited. Future surveys will provide additional data that can be incorporated to improve and strengthen the analysis and the conclusions derived from it. Another limitation of this study is of a methodological nature. Separate equations were estimated for research and development but the decision to undertake either of the two activities are likely to be related. This could result in correlation between the error terms of the two equations due to the omission of the same non-observed factors in each one. A possible solution would be to use a model that allows for correlation between the equations’ errors. As for extensions of the present study, our analysis would be enriched by incorporating additional variables. These could include type of innovation, form of cooperation, method of intellectual property rights protection and source of information. Evidence from other countries would also serve to reinforce our conclusions, especially.
(45) 36. developing countries for which fewer studies have been done and heterogeneity is greater. Lastly, future work should also focus on the actual design of ad-hoc public policies that take into account the characteristics peculiar to research and development as distinct activities..
(46) 37. REFERENCES Aerts, K., & Thorwarth, S. (2009). Additionality effects of public R&D funding: “R” versus “D.” Leuven. Afcha, S., & León López, G. (2014). Public funding of R&D and its effect on the composition of business R&D expenditure. BRQ Business Research Quarterly, 17, 22–30. http://doi.org/10.1016/j.cede.2013.01.001 Álvarez, R., Bravo-Ortega, C., & Zahler, A. (2015). Innovation and productivity in services: Evidence from Chile. Emerging Markets Finance and Trade, 51, 593–611. http://doi.org/10.1080/1540496X.2015.1026696 Álvarez, R., & Crespi, G. A. (2015). Heterogeneous effects of financial constraints on innovation: Evidence from Chile. Science and Public Policy, 1–14. http://doi.org/10.1093/scipol/scu091 Amemiya, T. (1985). Advanced Econometrics. Cambridge: Harvard University Press. Angrist, J. D., & Pischke, J.-S. (2009). Mostly Harmless Econometrics: An Empiricist’s. Companion.. Princeton:. Princeton. University. Press.. http://doi.org/10.1111/j.1475-4932.2011.00742.x Arrow, K. (1962). The Economic Implications of Learning by Doing. Oxford Journals, 29(3), 155–173..
Figure


+2
Documento similar