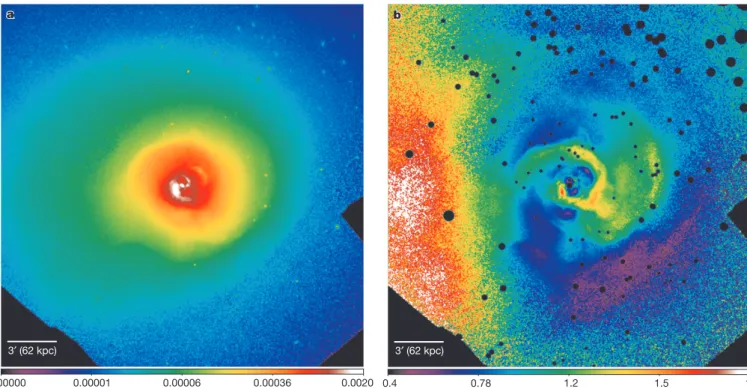
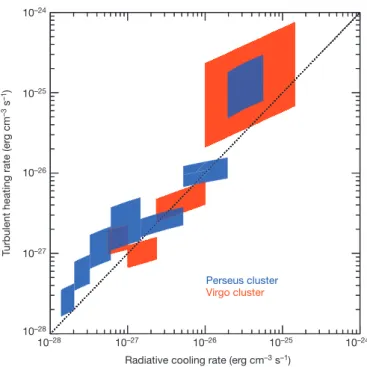
Turbulent heating in galaxy clusters brightest in X rays
Texto completo
Figure
Documento similar
2.5 The Kuhn–Tucker Conditions and Economic Analysis 55 of the standard defined as emissions per unit of output can lead to similar results as in the Averch–Johnson model:
Next we study the evolution of the total mass density profiles of the main galaxy clusters in the dataset to find how stable is their mass distribution across their
Linked data, enterprise data, data models, big data streams, neural networks, data infrastructures, deep learning, data mining, web of data, signal processing, smart cities,
Relationship between the total cluster stellar mass and the photometric blue fraction for the ALHAMBRA cluster and group sample stacked into different redshift bins. The galaxy
An example of projected stellar mass density for the disk, spheroid, and galaxy stellar particles is given in Figure 2 for G-1536, as well as the position of the radial cut we use
In the same direction, if the capacitance retention (expressed as the percentage of the capacitance obtained at low current densities) is plotted versus the current density for
In winter time, solar energy is collected by the solar roof to assist the conditioning system in heating the building and producing domestic hot water.. Figure 4, shows a
Indeed, this work is focused on the study of in- duced flow by natural convection in convergent and inclined channels (described on Figure 1) in the laminar,
