Environmental gradients and the evolution of
successional habitat specialization: a test case with 14
Neotropical forest sites
Susan G. Letcher
1*, Jesse R. Lasky
2,3, Robin L. Chazdon
4, Natalia Norden
5,6, S. Joseph
Wright
7, Jorge A. Meave
8, Eduardo A. P
erez-Garc
ı
a
8, Rodrigo Mu
noz
~
8, Eunice
Romero-P
erez
8, Ana Andrade
9, Jos
e Luis Andrade
10, Patricia Balvanera
11, Justin M. Becknell
12,
Tony V. Bentos
9, Radika Bhaskar
13, Frans Bongers
14, Vanessa Boukili
4, Pedro H. S.
Brancalion
15, Ricardo G. C
esar
15, Deborah A. Clark
16, David B. Clark
16, Dylan Craven
17,
Alexander DeFrancesco
4, Juan M. Dupuy
10, Bryan Finegan
18, Eugenio Gonz
alez-Jim
enez
19, Jefferson S. Hall
7, Kyle E. Harms
20, Jos
e Luis Hern
andez-Stefanoni
10, Peter
Hietz
21, Deborah Kennard
22, Timothy J. Killeen
23, Susan G. Laurance
24, Edwin E.
Lebrija-Trejos
7,8, Madelon Lohbeck
11,14, Miguel Mart
ı
nez-Ramos
11, Paulo E. S. Massoca
9, Rita C. G.
Mesquita
9, Francisco Mora
11, Robert Muscarella
3,25, Horacio Paz
10, Fernando
Pineda-Garc
ı
a
26, Jennifer S. Powers
27, Ruperto Quesada-Monge
28, Ricardo R. Rodrigues
29,
Manette E. Sandor
4, Luc
ı
a Sanaphre-Villanueva
10, Elisabeth Sch
uller
€
30, Nathan G.
Swenson
31, Alejandra Tauro
11, Mar
ı
a Uriarte
3, Michiel van Breugel
7,32, Orlando
Vargas-Ram
ı
rez
33, Ricardo A. G. Viani
34, Amanda L. Wendt
4and G. Bruce Williamson
9,201
Department of Environmental Studies, Purchase College (SUNY), 735 Anderson Hill Road, Purchase, New York
10577, USA;2Earth Institute, Columbia University, 405 Low Library, MC 4335, 535 West 116th Street, New York, NY
10027, USA;3Department of Ecology, Evolution and Environmental Biology, Columbia University, 1200 Amsterdam
Ave., Manhattan, NY 10027, USA;4Department of Ecology and Evolutionary Biology, University of Connecticut, 75 N.
Eagleville Road, Storrs, CT 06269-3043, USA;5Fundacion Cedrela, Diagonal 40A # 18A - 09, Bogot a, Colombia;
6Programa de Biologıa, Facultad de Ciencias Naturales y Matematicas, Universidad del Rosario, Cra 24 # 63C-69,
Bogota, Colombia;7Smithsonian Tropical Research Institute, Apartado 0843-03092, Balboa, Republic of Panama;
8
Departamento de Ecologıa y Recursos Naturales, Facultad de Ciencias, Universidad Nacional Autonoma de Mexico,
Ciudad Universitaria, Circuito Exterior s/n, Mexico 04510 D.F., Mexico; 9Coordenacß~ao de Dinamica Ambiental, Instituto^
Nacional de Pesquisas da Amazonia, Av. Andr^ e Ara ujo 1756, Petropolis, Manaus, Amazonas 69067-375, Brazil;
10
Unidad de Recursos Naturales, Centro de Investigacion Cientıfica de Yucatan, Calle 43 No. 130, Col. Chuburn a de
Hidalgo, C.P. 97200 Merida, Yucat an, Mexico;11Instituto de Investigaciones en Ecosistemas y Sustentabilidad,
Universidad Nacional Autonoma de Mexico Unidad Morelia, Antigua Carretera a Patzcuaro 8701 58190, Morelia,
Michoacan, M exico; 12Department of Biology, University of Alabama, Box 870344, Tuscaloosa, AL 35487, USA;
13
Environmental Change Initiative, Brown University, Box 1951, Providence, RI 02912, USA;14Forest Ecology and
Forest Management, Wageningen University, 6708 PB Wageningen, The Netherlands;15Departamento de Ci^encias
Florestais, Escola Superior de Agricultura Luiz de Queiroz, University of S~ao Paulo, Av. Padua Dias, 11, Piracicaba
S~ao Paulo 13418-900, Brazil;16Department of Biology, University of Missouri–St. Louis, 1 University Blvd, St. Louis,
MO 63121, USA;17Synthesis Centre for Biodiversity Sciences, German Centre for Biodiversity Research, Deutscher
Platz 5e, 04103, Leipzig, Germany;18Production and Conservation in Forests Programme, Centro Agronomico
Tropical para Investigacion y Ense~nanza, 7170 Cartago, Turrialba 30501, Costa Rica;19Soltis Center for Research
and Education in Costa Rica, Texas A&M University, San Isidro de Penas Blancas, Apto. 80-4417, Fortuna, San~
Carlos, Costa Rica;20Department of Biological Sciences, Louisiana State University, 202 Life Science Bldg., Baton
Rouge, LA 70803, USA;21Institute of Botany, University of Natural Resources and Life Sciences,
Gregor-Mendel-Straße 33, 1180 Vienna, Austria;22Department of Physical and Environmental Sciences, Colorado Mesa University,
1100 North Ave, Grand Junction, CO 81501, USA;23Museo de Historia Natural Noel Kempff Mercado, Av. Irala No.
565, Santa Cruz, Bolivia;24School of Marine and Tropical Biology, James Cook University, 1 James Cook Dr,
Townsville, Qld 4811, Australia;25Ecoinformatics and Biodiversity, Department of Bioscience, Aarhus University, 8000
C Aarhus, Denmark;26Escuela Nacional de Estudios Superiores, Unidad Morelia, Universidad Nacional Autonoma de
Mexico, Antigua Carretera a Patzcuaro 8701, 58190, Morelia, Michoac an, Mexico; 27Department of Ecology, Evolution,
and Behavior and Department of Plant Biology, University of Minnesota, 100 Ecology Building, 1987 Upper Buford
Circle, Saint Paul, MN 55108, USA;28Escuela de Ingenierıa Forestal, Instituto Tecnologico de Costa Rica, Apto.
159-7050, Cartago, Costa Rica;29Department of Biological Sciences, ESALQ, University of Sao Paulo, P~ adua Dias
Avenue, 11, Piracicaba, Sao Paulo 13418-900, Brazil;~ 30Division of Viticulture and Pomology, University of Natural
Resources and Life Sciences, Gregor-Mendel-Straße 33, 1180, Vienna, Austria;31Department of Plant Biology,
Michigan State University, 612 Wilson Road, East Lansing, MI 48824, USA;32Yale-NUS College, National University
of Singapore, 6 College Ave. E, 138614 Singapore, Singapore;33Organization for Tropical Studies, La Selva
Biological Station, Apto. 676-2050, San Pedro de Montes de Oca, Costa Rica; and34Departamento de Biotecnologia
e Producßao Vegetal e Animal, Universidade Federal de S~ ~ao Carlos, Rod. Anhanguera, Km 174, CEP 13600-970,
Araras, S~ao Paulo, Brazil
Summary
1. Successional gradients are ubiquitous in nature, yet few studies have systematically examined the evolutionary origins of taxa that specialize at different successional stages. Here we quantify succes-sional habitat specialization in Neotropical forest trees and evaluate its evolutionary lability along a precipitation gradient. Theoretically, successional habitat specialization should be more evolution-arily conserved in wet forests than in dry forests due to more extreme microenvironmental differenti-ation between early and late-successional stages in wet forest.
2. We applied a robust multinomial classification model to samples of primary and secondary forest trees from 14 Neotropical lowland forest sites spanning a precipitation gradient from 788 to 4000 mm annual rainfall, identifying species that are old-growth specialists and secondary forest specialists in each site. We constructed phylogenies for the classified taxa at each site and for the entire set of classified taxa and tested whether successional habitat specialization is phylogenetically conserved. We further investigated differences in the functional traits of species specializing in sec-ondary vs. old-growth forest along the precipitation gradient, expecting different trait associations with secondary forest specialists in wet vs. dry forests since water availability is more limiting in dry forests and light availability more limiting in wet forests.
3. Successional habitat specialization is non-randomly distributed in the angiosperm phylogeny, with a tendency towards phylogenetic conservatism overall and a trend towards stronger conservatism in wet forests than in dry forests. However, the specialists come from all the major branches of the angiosperm phylogeny, and very few functional traits showed any consistent relationships with suc-cessional habitat specialization in either wet or dry forests.
4. Synthesis. The niche conservatism evident in the habitat specialization of Neotropical trees sug-gests a role for radiation into different successional habitats in the evolution of species-rich genera, though the diversity of functional traits that lead to success in different successional habitats compli-cates analyses at the community scale. Examining the distribution of particular lineages with respect to successional gradients may provide more insight into the role of successional habitat specializa-tion in the evoluspecializa-tion of species-rich taxa.
Key-words: determinants of plant community diversity and structure, functional traits, life-history evolution, phylogeny, pioneer species, precipitation gradient, tropical dry forest, tropical wet forest
Introduction
Environmental gradients provide opportunities for understand-ing the evolution of habitat specialization (Grime 1977; Grubb 1977). Many of the gradients observed in ecosystems are asso-ciated with the process of succession, as communities reassem-ble after disturbances (Pickett 1976; Sousa 1984). Successional habitat specialization–the radiation of lineages to take advan-tage of particular points on this successional gradient – is
potentially a strong driver of plant evolution (van Steenis 1958; Gomez-Pompa 1971; Pickett 1976). Grubb (1977) reiterated the importance of the regeneration niche in community assem-bly, and many studies have explored the potential of distur-bance for maintaining diversity (Sousa 1984; Ricklefs 1987; Tilman & Pacala 1993), yet relatively few studies have exam-ined successional gradients as an evolutionary force.
environmen-tal heterogeneity (Gentry 1988). The specialization of tropical trees into successional habitats has long been recognized. Pioneer tree species–the species that establish and dominate early in succession–form an important component of the trop-ical forestflora, particularly in wet forests (van Steenis 1958; Gomez-Pompa 1971; Whitmore 1989). Gomez-Pompa (1971) proposed that the evolution of many tropical plant taxa could only be understood through the lens of secondary forest succes-sion. He postulated that species richness and taxonomic diver-sification in the tropics could be explained, at least partially, by strong selection for growth and survival in early successional habitats following large-scale disturbances. Pioneer species evolved to take advantage of natural disturbances such asfires,
floods, landslides, cyclones and volcanic eruptions, and they have proliferated in recent millennia with the expansion of anthropogenic disturbances (Whitmore 1989; Chazdon 2003, 2014). Yet the exact definition of pioneer species has remained somewhat ambiguous (Swaine & Whitmore 1988; Gitay & Noble 1997), and relatively few studies have examined the evolutionary origins of the taxa that dominate early succes-sional forests vs. the taxa that are more abundant in undis-turbed forest (Gentry 1988; Dalling, Hubbell & Silvera 1998).
The massive expansion of available molecular data in recent decades (Wikstr€om, Savolainen & Chase 2001; Ma-gallon & Castillo 2009; Stevens 2014) gives us unprecedented power to examine the distribution of traits on the angiosperm phylogeny and test hypotheses about their evolutionary ori-gins. Like extinction risk (Fritz & Purvis 2010), successional habitat specialization is a complex emergent characteristic of a species, stemming from the interaction of many traits and the environment. Here, we develop a new conceptual model of how the strength of environmental gradients during succes-sion affects the evolution of successucces-sional habitat specializa-tion. We test the model by evaluating the phylogenetic conservatism of habitat specialization in tropical forest trees across a precipitation gradient.
Successional processes involve changes in resource avail-ability and abiotic conditions (Fig. 1). The magnitude of these changes depends on the intensity of the disturbance that begins the succession (Sousa 1984) and also on the similarity between the starting point and the endpoint in succession (Pickett 1976). In ecosystems where the early successional and late-successional stages are structurally similar (e.g. grass-lands, shrublands and open forests), these resource/condition gradients are less strong than in ecosystems where succes-sional stages differ greatly in structure (e.g. tropical wet for-ests). Changes in conditions and resource availability during succession mediate the success of individuals that arrive at a site. When successional gradients are weak, the valley between adaptive peaks on the fitness landscape is shallow: being a specialist at one end of the successional gradient involves little reduction infitness at the other end of the gra-dient (Fig. 1). When successional gragra-dients are strong, though, being a specialist at one end of the gradient has a considerable fitness cost at the other end of the gradient. Thus, we expect to see fewer independent origins of succes-sional habitat specialization where gradients are strong.
Instead, we expect to see conservatism of habitat specializa-tion; specialist lineages consist of close relatives that radiated within that habitat rather than crossing the fitness barrier between habitats (Fig. 1).
Neotropical forest succession involves numerous environ-mental gradients. As succession proceeds, light availability decreases, temperatures (and diel temperature fluctuations) decrease, and relative humidity increases (Bazzaz & Pickett 1980; Swaine & Whitmore 1988; Finegan 1996; Guariguata & Ostertag 2001; Ruiz, Fandi~no & Chazdon 2005). These environmental gradients are present in every forest during succession, but the relative strength of the gradients depends on the similarity in abiotic conditions between early succes-sional and late-successucces-sional habitats, which in turn is a func-tion of habitat structure. Precipitafunc-tion is a major driver of structural differences among Neotropical forests. Tropical dry forests have lower stature and greater canopy openness than wet forests (Ewel 1977; Holbrook, Whitbeck & Mooney 1995). In dry forests, light conditions differ less strongly between early successional and late-successional habitats (Holbrook, Whitbeck & Mooney 1995; Lebrija-Trejos et al.
2011). In mature wet forests, generally 1–2% of the incident sunlight reaches the forestfloor except in canopy gaps (Chaz-don & Fetcher 1984). In dry forests, 5–10% of the incident sunlight reaches the forestfloor in the wet season, with higher values during the dry season when many species are leafless (Coomes & Grubb 2000; Poorter 2009). Canopy closure in dry forests during succession is slower than in wet forests (Ewel 1977; Ruiz, Fandi~no & Chazdon 2005; Letcher & Chazdon 2009; Lebrija-Trejoset al.2010), potentially leaving a longer window of time for pioneer species to colonize in dry forests. The microclimatic stressors that plant seedlings face are markedly different between open areas and forest un-derstorey in wet forests and less distinct in dry forests (Ewel 1977). The precipitation gradient in Neotropical forests there-fore produces a gradient in the environmental dissimilarity of early successional and late-successional habitats.
Because the mechanisms driving habitat specialization in wet and dry forests are likely to depend on plant functional traits rather than species phylogenetic relatedness per se, we predict that the functional traits characterizing the early suc-cessional specialist species will differ between wet and dry forests (Lohbeck et al. 2013). Early successional habitats in wet forests are presumed to favour tree species with traits associated with fast growth and cheap construction costs: rapid height growth rates, high rates of photosynthesis, high leaf nutrient concentration, thin leaves–high SLA, small eas-ily dispersed seeds and low density wood (Bazzaz & Pickett 1980; Guariguata & Ostertag 2001; Poorteret al.2004; Poor-ter & Rose 2005). In dry forests, the most important early successional traits are likely to be related to desiccation toler-ance; thus, dry forest SG specialists should have lower growth rates and photosynthetic rates, lower SLA and higher wood density than wet forest SG specialists (Bazzaz & Pick-ett 1980; Poorter 2009; Lebrija-Trejoset al.2010).
Analysis of functional trait variation among specialist groups will provide critical insights into the selective pres-sures that may have led to the evolution of successional spe-cialization of trees in tropical forest regions. This synthesis paper is thefirst to test the hypothesis of phylogenetic conser-vatism of successional habitat affinities of plant lineages, with a robust comparison among fourteen regions spanning wet and seasonally dry forests in the tropical Americas. The data sets we analyse form an unprecedented base of information
for understanding habitat specialization in relation to phylog-eny and functional traits in Neotropical forests.
Materials and methods
Based on existing woody vegetation surveys in a range of wet and seasonally dry Neotropical lowland forests, we examined the phyloge-netic distribution and functional traits of trees that are specialists in successional vs. mature forest. We tested whether patterns in succes-sional habitat specialization and trait conservatism differ across forest
regions along a rainfall gradient. We identified 14 sites across the
Neotropics (Fig. 2), all in lowland forests (<1000 m asl),
represent-ing a precipitation gradient from 788 to 4000 mm per year. We selected sites with extensive sampling of both old-growth and
second-ary forest with good species-level identification of at least 75% of
stems. For 12 of the 14 sites, functional trait data are available for a large fraction of the species present (Table 1). Many of these sites include ongoing monitoring projects. When using data from moni-tored sites, we selected a single year of data to focus on, generally the most recent year of data available with full taxonomic resolution (Table 1). In 12 of the 14 sites, the samples are spread over a fairly small geographic range (Table S1), but larger regional sampling areas were necessary in the Atlantic forest sites (FES and FOD) due to the heavily fragmented nature of the remaining forest patches in that
landscape (Rodrigueset al.1989; Rodrigues 1999).
The data incorporated in this paper include columnar cacti, palms and woody trees; we omitted lianas, understorey shrubs and other growth forms. At all sites, trees were sampled using plot-based meth-ods (see Table S1 and references cited in Table 1 for details), and
R
High lability of SG specialization; multiple origins and low conservatism of specialization since fitness peaks for SG and OG habitats are not strongly separated
Low lability of SG specialization; few origins and high conservatism of specialization since fitness peaks for SG and OG habitats are far apart
Increasing dissimilarity of early and late successional habitats Increasing conservatism of successional habitat specialization
= SG specialist = OG specialist
= SG specialist = OG specialist
Fig. 1.Resource availability and abiotic conditions change during succession. The species that are prevalent early in succession contend with different stressors and take advantage of different resources than later successional species. In successional systems where the endpoint is structurally similar to the starting point, these resource/condition gradients are weak, and where the endpoint is structurally distinct, the gradients are strong. Species that are adapted to take advantage of
early successional environments
(second-growth specialists, indicated here as ‘SG
specialist’) are less successful in
late-successional conditions, producing a‘valley’
between adaptive peaks on the fitness
landscape. This trade-off is particularly
pronounced when successional gradients are
strong. Thus, assuming that the traits
underlying successional habitat specialization are conserved on the angiosperm phylogeny, we expect to see fewer origins and greater
conservatism of SG specialization in
successional systems with stronger
environmental gradients. Old-growth
unknown individuals were collected for identification using local and international herbarium collections. Trees at each site that could be
identified as belonging to a distinct genus but could not be matched
to described species were given internally consistent morphospecies
names at that site (e.g. Dussia sp. A_SAR). Individuals that were
not identified below the family level were omitted from analysis. We
also limited the taxonomic scope of our study to angiosperms, omit-ting tree ferns and gymnosperms, which contributed a negligible amount of biomass in these sites. At all sites, multiple-stemmed viduals were only counted once. For nine sites, we include all
indi-viduals ≥5 cm diameter at 1.3 m height (DBH), and for two sites
(SAR and GUA), we include individuals ≥10 cm DBH. At FES
and FOD, we include all individuals ≥4.8 cm DBH since this was
the diameter threshold used in sampling. At 13 out of 14 sites, we were able to use the same size classes in old-growth and secondary
forest, but at BRA, we include stems≥5 cm DBH in secondary
for-ests and stems ≥10 cm DBH in old-growth forests due to
con-straints of data availability. If anything, the size class sampling discrepancy at BRA will detect a greater abundance of old-growth-adapted species in the second-growth forest at that wet forest site, since the tree species that are characteristic of old growth are often present in small size classes in the undergrowth of older secondary forests (Chazdon 2008). Since the sites where we used different stem size class criteria span the precipitation gradient (Table 1), we can
be fairly confident that any effect of size class sampling is not
con-founded with the effect of precipitation.
We compiled a species list from all 14 sites and checked
synon-ymy using http://www.tropicos.org (Missouri Botanical Garden
2014). We applied the multinomial model of Chazdonet al.(2011)
to classify the trees at each site according to their successional
habi-tat affiliations. Given species abundances in two different habitats,
the model classifies species into habitat 1 specialists, habitat 2
spe-cialists, generalists or too rare to classify with confidence. One major
advantage of this method over prior classification algorithms is the
ability to make a statistical determination of whether a species is
common enough to be classified with confidence (Chazdon et al.
2011). Another advantage of this classification algorithm is that it
explicitly corrects for differences in sampling intensity across
habi-tats, thus avoiding the bias inherent in other classification methods
when incomplete samples are used (Chazdon et al. 2011; Parker
2013; Chaoet al.2015). Particularly in species-rich assemblages, the
observed relative abundance of speciesiin a given sample (pi) is a
biased estimator of its actual relative abundance, due to the contribu-tion of undetected species to the denominator of the actual relative
abundance (Chazdon et al. 2011; Chao et al. 2015). This bias is
more severe for rare species than for common species (Chao et al.
2015). The multinomial classification algorithm of Chazdon et al.
(2011) uses Turing-Good coverage estimation (Good 1953; Chazdon et al.2011 Appendix B) to correct pi for the contribution of unde-tected species to the assemblage.
In this study, we used secondary forest and nearby old-growth for-est as the two types of habitats. Species in each region were divided into second-growth (SG) specialists, old-growth (OG) specialists, gen-eralists and too rare to classify. We used the settings recommended
for the model given the structure of our data set (Chazdon et al.
2011): a simple majority threshold (K=1/2) since sample sizes of
individuals at each site are large (Table 2) andP=0.005 to correct
for the family-wise error rate since each site had a large number of
species to be classified. In all of our further analyses, we used only
the species that were abundant enough to be classified with confi
-dence in at least one site.
Phylogenies were constructed using the method of Letcher et al.
(2012) with updated information on node ages. The species list was mapped onto a maximally resolved supertree of angiosperms (R20120829) using Phylomatic version 3 (http://phylodiversity.net/ phylomatic/; Webb & Donoghue 2005). Branchlengths were assigned using the bladj algorithm in Phylocom 4.2.1 (Webb, Ackerly &
Kembel 2008). Node ages were based on Wikstr€om, Savolainen &
Chase (2001), employing the corrections for node names in
Phylomat-ic trees identified by Gastauer & Meira-Neto (2013) and updated node
ages from Magallon & Castillo (2009) where available. We
con-structed one supertree of all classifiable taxa (SG specialists, OG
spe-cialists and generalists), applied the branchlength corrections and then used Phylomatic (Webb & Donoghue 2005) to take subsets of this tree for the taxa at each site.
We examined the phylogenetic signal in species’habitat
special-izations using theDstatistic (Fritz & Purvis 2010), a metric of
phy-logenetic conservatism that is robust to differences in phyphy-logenetic
tree size and the prevalence of the trait being examined.Dassesses
the phylogenetic signal of a binary trait. It wasfirst used to
investi-gate the relative strength of phylogenetic signal in extinction risk caused by different types of environmental threats (Fritz & Purvis 2010). Like extinction risk, successional habitat specialization is a complex emergent trait that is related to many underlying characters.
One feature that makesDparticularly useful for our analysis is that
it is specifically designed to investigate the relative strength of
phy-logenetic signal in a binary trait among different groups, with pro-gressively lower values indicating a higher level of phylogenetic signal (Fritz & Purvis 2010). Values below zero indicate extreme clustering, zero indicates clustering (Brownian expectation), one indi-cates randomness, and values above one indicate overdispersion. The
method gives twoPvalues, one from a test whether the trait is
dis-tributed randomly on the phylogeny and one from a test whether the trait is clumped as would be expected from Brownian motion
des-cent with modification (Fritz & Purvis 2010). Most measures of
phylogenetic signal focus on assessing the significance, rather than
the relative strength, of the phylogenetic signal in binary traits, but
since D is comparable across data sets, it can be used to assess
whether particular features of the groups examined – or particular
environmental features – are linked to greater phylogenetic signal
strength (Fritz & Purvis 2010). In our analysis, we test whether there is a relationship between average annual rainfall and the Fig. 2.The 14 sites span a wide range of locations in the Neotropical
strength of phylogenetic signal in successional habitat specialization. Based on the predictions in Fig. 1, we would expect to see lower
values of D(i.e. greater phylogenetic signal strength) in sites with
higher rainfall.
In order to examine the relative strength of the phylogenetic signal
in our data, we analysedDfor the whole data set using the tree of all
classifiable taxa, and for each site using the site-specific phylogeny.
BecauseDis only applicable to binary traits, we conducted two
dif-ferent tests in each case: one for SG specialists vs. [OG
special-ists+generalists] and one for OG specialists vs. [SG
specialists+generalists]. We used the phylo.d function in the
pack-age caper (Orme et al. 2013) to calculate D, using R 2.13.1 (R Development Core Team 2013).
We examined a wide range of functional traits related to seeds, leaves, wood density and plant stature (Table 3). Not every trait was available for every species; for instance, we did not measure wood or leaf traits for cacti. The number of taxa included for each trait at each site is given in Table 3. For two sites (SAR and OSA), seed length
was reported as categorical values (seed length: <1, 1–6, 6–15,
15–30, 30–50, 50–100 and>100 mm). Tree height at OSA was a
categorical variable (canopy or subcanopy). All other traits were reported as continuous variables: seed dry mass (mg), seed length
(mm), specific leaf area (SLA; cm2g 1), leaf dry matter content
(LDMC; mg g 1), wood specific gravity (WSG; unitless) or wood
density (g cm 1), and maximum height (m). Leaf and seed traits were
collected according to standard protocols (Cornelissenet al.2003b).
Wood density was reported at NIZ, CHM, FES and FOD, while WSG was reported at KIU, GUA, CAR, PAN, LUQ and SAR. Because of differences in measurement protocols including core diam-eter and length, drying temperature, and whether corrections were made for radial variation, WD and WSG measurements are not directly comparable among sites (Williamson & Wiemann 2010).
To examine the associations of particular functional traits with suc-cessional habitat specialization, we used functions developed by Pur-vis & Rambaut (1995) that calculate phylogenetically independent contrasts for a set of variables and then test for evolutionary relation-ships in the contrasts using linear models. We used the functions crunch (for continuous data) and brunch (for categorical data) in caper(Orme et al.2013) to model the relationship between habitat specialization, coded as a binary variable and each of the functional
traits measured. Again, we did two sets of tests for each site–trait
combination, one using SG specialists vs. [OG specialists+
general-ists] and one using OG specialists vs. [SG specialists+generalists].
Results
Our 14 sites contained a total of 162 532 individuals and 2654 species, from 87 families and 28 orders (higher taxa following APG III, Stevens 2014). Three hundred and ele-ven of these species, accounting for 1306 individuals (0.8%), were morphospecies; the rest were identified at the species level and linked to a valid name. The number of species present at each site ranged from 62 in the dry forest at CAR to 743 in the moist forest at BRA (Table 2). Across the whole data set, 921 species (34.7%) were common enough to be classified with confidence using the multino-mial model (Chazdon et al. 2011) in at least one site. Of these, 355 species were SG specialists, 52 of which were classified as SG specialists at multiple sites. A total of 443 species were classified as OG specialists, 56 at multiple sites. Only, 10 species had conflicting classifications at dif-ferent sites. The algorithm classified between 12.5 and 72.5% of species at each site with confidence (Table 2). However, since the species that are classified with confi -dence are the common species (Chazdon et al. 2011), these relatively low percentages of species made up large percent-ages of the individuals at each site; >60% in every site, with a median of 90.0% (Table 2).
Although the classification algorithm can be sensitive to the age of the secondary forests sampled (Chazdonet al. 2011), we did notfind evidence of such sensitivity in this data set: there was no relationship between the median secondary for-est age and the per cent of individuals classified as secondary forest specialists (R2=0.033, P=0.56). There was also no relationship between median secondary forest age and rainfall (R2=0.093, P=0.33; Table 1), suggesting that these vari-ables are not confounded in our data set.
Table 2. The number of species and individuals at each site, and the per cent of species and individuals that were classified with confidence
using the multinomial model of Chazdonet al.(2011). The remaining species at each site were classified as too rare for reliable estimates of
hab-itat specialization
Site No. spp.
No. individuals in secondary forest
No. individuals in old-growth forest
% of spp. classified
with confidence
% of individuals
classified with
confidence
No. secondary forest specialist spp.
No. old-growth specialist spp.
No. generalist spp.
CHM 91 496 533 29.7 81.3 10 5 12
NIZ 110 629 892 30.9 87.2 9 21 4
KIU 137 8712 686 31.4 93.0 10 7 26
CHI 115 1269 7947 43.5 96.2 16 25 3
GUA 168 3587 1027 39.3 89.5 23 22 21
FES 350 15 817 1556 30.3 90.5 40 33 32
CAR 62 1043 720 46.8 95.3 11 8 9
FOD 378 12 766 835 28.8 84.3 31 61 16
BRA 743 2010 2272 12.5 63.0 28 51 10
PAN 349 12 849 47 814 72.5 99.3 93 129 31
CHJ 149 2403 257 16.1 75.3 11 11 2
LUQ 133 5383 8161 54.1 98.4 29 28 14
SAR 507 5921 7768 29.6 87.7 38 78 38
Table 3. Results from the brunch/crunch analysis (Purvis & Rambaut 1995) of the relationship between successional habitat specialization and
functional traits.‘SG’stands for second-growth specialization;‘OG’is old-growth specialization (shaded rows).Nis the number of species that
were classifiable with the multinomial model (Chazdonet al.2011) at each site and habitat category for which the trait was measured. For seed
length and maximum height, a dagger (†) indicates that the trait was measured as categorical. For wood traits, a double dagger (††) indicates that
wood density was measured instead of wood specific gravity. See text for details. Functional trait data were available for all sites except CHI and
BRA. R is the brunch/crunch-corrected correlation coefficient between habitat specialization and trait values; for instance, the negative coefficient
for seed length at CHM indicates that SG specialists had lower seed size than generalists/OG specialists at that site
Successional habitat specialization in our data set was significantly non-random, with D values lower than 1, suggesting a tendency towards phylogenetic clustering (SG specialization: D=0.7641, Prandom<0.0001, PBrownian<
0.0001; OG specialization: D=0.7159, Prandom<0.0001,
PBrownian<0.0001). For SG specialization, values of D for
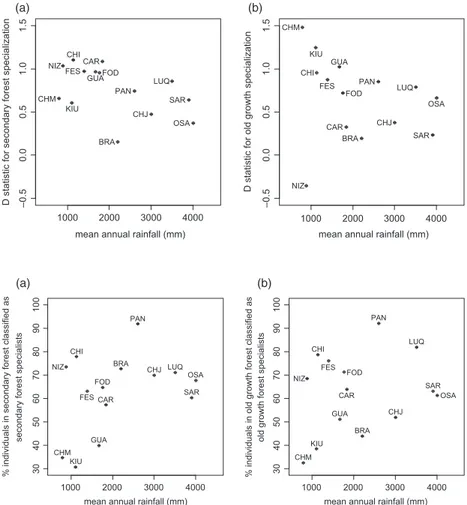
individual sites fell between 0.158 (clustering) and 1.11 (slight overdispersion). There was a trend towards lowerDvalues (i.e. stronger phylogenetic signal) in the wetter forest sites (Fig. 3a), although the correlation between D values and precipitation was weak and not significant (R2=0.212,P=0.09). For OG
specialization, values ranged from 0.35 to 1.48. There was also a tendency towards lowerDvalues in wetter forest sites (Fig. 3b) except for the dry forest at NIZ, which had the lowest value of all. The relationship here was not significant (R2=0.065,P=0.37). There were also suggestive trends in the proportion of stems that were specialists along the precipita-tion gradient: wetter sites had a higher proporprecipita-tion of individuals classified as specialists (Fig. 4), although again the correlations were weak and not significant (R2=0.243,P=0.105 for SG specialists,R2=0.095,P=0.282 for OG specialists).
Considering the relationship between functional traits and secondary habitat specialization, relatively few traits showed a strong relationship with habitat specialization when phyloge-netically independent contrasts were taken into account (Table 3). Seed length (measured infive sites) showed signifi -cant relationships with SG specialization in three sites and OG specialization in one site. The slope of all the significant relationships was negative in SG and positive in OG, indicat-ing that seed length tends to be shorter in SG specialists and longer in OG specialists (Table 3). However, seed mass (mea-sured in five sites) showed no significant relationship with habitat specialization in any site (Table 3). Leaf traits (SLA and LDMC) also showed relatively few significant relation-ships with habitat specialization. SLA (measured in 11 sites) was negatively related to OG specialization at two sites and positively related to SG specialization in one site; LDMC (measured infive sites) was positively related to SG special-ization in only one site. Maximum height (measured in 10 sites) had a significant negative relationship to SG specializa-tion in three sites and a significant positive relationship with OG specialization in two sites, indicating that maximum height is lower in SG specialists, but there was also a signifi -cant negative relationship between OG specialization and
maximum height in one site (LUQ). Wood specific gravity/ wood density (measured in 11 sites; see Table 3) had a signif-icant negative relationship with SG specialization in four sites and a significant positive relationship with OG specialization in two sites, indicating denser wood in OG trees.
Examining the distribution of secondary forest specialist taxa across the angiosperm phylogeny (Fig. 5), clustering of successional habitat specialization is evident in some lineages. Certain families have a large representation of SG specialists, for example Melastomataceae and Myrtaceae (Fig. 5). Other families have a greater proportion of OG specialists, for example Sapotaceae and Primulaceae (Fig. 5). In some cases, closely related groups of taxa differed in the prevalence of SG vs. OG specialists; see, for instance, Salicaceae and Viola-ceae; Clusiaceae and HypericaViola-ceae; Moraceae and UrticaViola-ceae; Burseraceae and Anacardiaceae (Fig. 5).
Despite overall conservatism of successional habitat spe-cialization, there have been multiple origins of SG and OG specialists in a wide range of lineages. Successional habitat specialization occurs in every major clade of angiosperms (Table 4). The Rosid I and II clades contain a large number of SG specialists, but the flora of this region as a whole is Rosid-dominated (Gentry 1988; Chave et al. 2006; Fig. 5; Table 4). Many clades contain both generalist and specialist taxa without clear patterns of clustering; for instance, Faba-ceae, Rubiaceae and the Magnoliids (Fig. 5).
Discussion
This is thefirst study, to our knowledge, to demonstrate that successional habitat specialization tends to be conserved among angiosperms, with significantly non-random patterns of successional habitat specialization evident in a broad sam-ple of the angiosperm phylogeny from a diverse range of Neotropical forest sites. In a previous study of Neotropical trees, Nordenet al. (2012) found that the SG specialists and OG specialists at SAR are both significantly clustered on the angiosperm phylogeny; here, we extended the scope of the study and confirmed that there is phylogenetic clustering of successional habitat specialists in numerous sites across a broad geographic area.
not significant, the direction of the pattern generally agrees with our predictions about the evolution of successional habi-tat specialization along a gradient of dissimilarity between early successional and late-successional habitats (Fig. 1). There is a trend towards greater conservatism of successional habitat specialization in wetter forests, suggesting that special-ization may be less evolutionarily labile in these systems. In addition, when we consider the abundance of individuals, spe-cialists tend to make up a larger fraction of the individuals in wet regions than in dry regions–more SG specialists in sec-ondary forests and more OG specialists in old-growth forests (Fig. 4). These trends are much more evident in SG special-ists than OG specialspecial-ists, perhaps due to the strong constraints on the life-history strategies of pioneer species and the ephemeral nature of their habitat.
Based on the differences in the abiotic environment of wet and dry forests during succession, we predicted that func-tional trait profiles would differ between wet and dry forest SG specialists, with wet forest pioneers exhibiting traits for rapid growth and light gathering while dry forest pioneers should exhibit traits related to desiccation tolerance. Lohbeck
et al.(2013) reported contrasting successional changes in the community-weighted means of functional traits in wet and dry forests in Mexico, with traits indicating the importance of light availability driving successional changes in wet forests and water availability driving changes in dry forests. In our
broader data set, however, we identified relatively few traits that were strongly and consistently associated with succes-sional habitat specialization (Table 3).
The lack of strong relationships that we observed between functional traits and successional habitat specialization is somewhat surprising, given the directional changes in plant functional traits that are generally observed during tropical forest succession (Bazzaz & Pickett 1980; Finegan 1996; Guariguata & Ostertag 2001; Chazdon et al. 2003; Lebrija-Trejoset al. 2010; Dupuy et al. 2012; Lohbeck et al. 2013; Chazdon 2014; Bhaskar, Dawson & Balvanera 2014). One potential explanation is the methodological differences between our study and previous work. Studies that use com-munity-weighted means are strongly influenced by the most abundant species in a community. The community-weighted mean approach is useful for understanding the synecology of co-occurring species (sensu Odum & Odum 1959), but less useful for understanding the autoecology of each species. The brunch/crunch algorithms treat each species as a data point, rather than each individual (Purvis & Rambaut 1995). These algorithms also explicitly correct for the lack of phylogenetic independence among data points. For highly phylogenetically conserved traits, comparisons that do not take phylogenetic non-independence into account may overestimate the magni-tude and significance of differences among groups (Felsen-stein 1985).
1000 2000 3000 4000
–0.5
mean annual rainfall (mm)
D statistic for secondary forest specialization
OSA
1000 2000 3000 4000
–0.5
mean annual rainfall (mm)
D statistic for old growth specialization
OSA
Fig. 3.D(Fritz & Purvis 2010) for second-growth specialization (panel a) and
old-growth specialization (panel b) plotted
against annual rainfall at the 14 sites. D
values approaching 0 indicate a more
clumped distribution of the trait on the phylogeny. Three-letter codes correspond to the site names given in Table 1.
1000 2000 3000 4000
30
mean annual rainfall (mm) OSA
% individuals in secondary forest classified as
secondary forest specialists
1000 2000 3000 4000
30
mean annual rainfall (mm) OSA
% individuals in old growth forest classified as
old growth forest specialists
(a) (b)
Fig. 4.The per cent of individuals in
secondary forest classified as SG specialists
(panel a), and the per cent of individuals in
old-growth forest classified as OG specialists
Another explanation for the lack of strong trait-successional habitat association that we observed is the importance of intraspecific variation in plant traits, and particularly the
onto-genetic shifts that occur between seedlings and adults (Clark & Clark 1992; Poorter & Rozendaal 2008). We measured wood and leaf traits of adults, following standard protocols,
Fabaceae
Rosid I
Rosid II
Magnoliids Melastomataceae
Euphorbiaceae
basal Asterid
Asterid I
Asterid II Urticaceae
Salicaceae Moraceae
Violaceae
Anacardiaceae
Burseraceae
Sapindaceae Meliaceae
Malvaceae
Rubiaceae Boraginaceae
Sapotaceae Lecythidaceae
Arecaceae
Primulaceae
Apocynaceae
Hypericaceae Clusiaceae
Annonaceae Lauraceae Myrtaceae
Chrysobalanaceae
Malpighiaceae
Polygonaceae Nyctaginaceae Rutaceae
Fig. 5.The phylogeny for the 921 species that were common enough to be classified with confidence. Branch colours indicate second-growth specialists (red), old-growth specialists (blue) and generalists (grey). The labels of smaller families are omitted for clarity.
Table 4. The number of species in each major angiosperm clade that was classified with confidence using the multinomial model of Chazdon et al.(2011) at each of the 14 sites. The numbers in parentheses indicate the number of species in that clade classified as secondary forest
spe-cialists and old-growth forest spespe-cialists, respectively; for example, 8 (0, 3) indicates that eight species were classified with confidence, zero as
secondary forest specialists, three as old-growth specialists and the rest as generalists
Asterid I Asterid II Basal Asterid Eudicot Magnoliid Monocot Rosid I Rosid II
CHM 2 (0, 0) 0 6 (2, 2) 0 1 (1, 0) 0 13 (6, 2) 5 (1, 1)
NIZ 2 (0, 2) 0 6 (2, 2) 0 1 (0, 1) 0 19 (7, 10) 6 (0, 6)
KIU 6 (0, 1) 0 11 (2, 2) 0 0 0 16 (5, 4) 10 (3, 0)
CHI 4 (1, 3) 0 7 (3, 4) 0 0 0 20 (7, 12) 13 (5, 6)
GUA 9 (3, 3) 0 9 (3, 3) 0 3 (1, 0) 0 26 (11, 6) 19 (5, 10)
FES 5 (1, 3) 2 (1, 0) 9 (4, 1) 0 7 (3, 2) 2 (0, 2) 38 (14, 12) 42 (17, 13)
CAR 4 (2, 1) 1 (0, 0) 2 (0, 1) 0 1 (0, 0) 1 (0, 1) 10 (3, 3) 9 (6, 2)
FOD 13 (3, 10) 2 (1, 1) 15 (5, 5) 0 14 (5, 5) 3 (1, 2) 27 (9, 14) 34 (7, 24)
BRA 0 0 21 (2, 19) 0 9 (4, 3) 2 (0, 1) 37 (12, 19) 20 (10, 9)
PAN 27 (9, 14) 3 (2, 0) 21 (7, 12) 1 (1, 0) 24 (3, 17) 5 (0, 5) 97 (38, 46) 75 (33, 35)
CHJ 0 0 2 (1, 1) 0 1 (1, 0) 0 11 (4, 5) 10 (5, 5)
LUQ 10 (5, 2) 3 (2, 0) 7 (2, 5) 0 3 (1, 1) 2 (1, 1) 26 (8, 12) 20 (10, 7)
SAR 16 (2, 13) 2 (0, 1) 16 (4, 10) 0 20 (5, 7) 5 (1, 4) 60 (14, 25) 35 (12, 18)
but the seedling may be the most relevant life stage for under-standing how traits mediate community assembly during suc-cession (Poorter & Markesteijn 2008; Lu et al. 2014), and seedling traits are not always directly related to adult traits (Cornelissenet al.2003a; Poorter 2007).
Although few of the traits that we studied showed strong associations with successional habitat specialization, the sig-nificant trait relationships that we identified generally did con-form to expectations based on the physiological ecology of plants during succession. For seed size, our data supported the widespreadfinding that secondary forest trees have smal-ler seeds (Swaine & Whitmore 1988; Chazdon et al. 2003). In three of thefive sites where we had seed length data, we found that SG specialists tended to be smaller seeded than OG specialists in both wet and dry forests. Small-seeded taxa likeCecropiaandMiconiaare important pioneers in both wet and dry forest (Dalling et al. 2002). The absence of large-seeded taxa in early successional forests may be a product of dispersal limitation; small seeds are more easily transported, and the large animals that disperse large-seeded taxa may not venture into secondary forest habitats (Guariguata & Ostertag 2001; Dallinget al.2002; Chazdonet al.2003). Germination of smaller seeds also tends to be sensitive to either light or diel temperature fluctuations (Vazquez-Yanes et al. 1990; Pearsonet al.2002), which could contribute to the high abun-dance of small-seeded taxa in secondary forests.
For leaf traits, very few of the traits that we investigated showed a consistent relationship with successional habitat specialization. Recent work on leaf traits in tropical forest species has demonstrated that leaf traits have high intraspe-cific variation in moist forest (Rozendaal, Hurtado & Poorter 2006) and dry forest (Markesteijn, Poorter & Bongers 2007). The plasticity of traits, rather than the magnitude of interspe-cific trait variation, may be a key factor in understanding how leaf traits mediate plant success in different light environ-ments (Markesteijn, Poorter & Bongers 2007). Ontogenetic shifts may be a particularly important factor complicating our ability to generalize about leaf traits that mediate success in different environments (Clark & Clark 1992; Chazdon et al.
2010). Seedling leaf traits may be more informative than adult leaf traits for understanding community assembly (Rozendaal, Hurtado & Poorter 2006; Poorter 2007), and the relationship between seedling and adult leaf traits is not necessarily straightforward (Cornelissenet al.2003a).
Maximum height was one of the traits that showed the strongest relationships with successional habitat specialization (Table 3). According to our data, SG specialization is nega-tively related to maximum height (i.e. SG specialists tend to be shorter statured) and OG specialization is positively related to maximum height, especially in dry forests. The only site where we found a negative association between OG special-ization and maximum height was in the wet forest at LUQ (Table 3). In wet and moist forests, the shorter statured trees are often long-lived, slow-growing understorey species that persist in low light (Bazzaz & Pickett 1980; Poorter, Bongers & Bongers 2006; Kitajima & Poorter 2008). Since dry forest trees have slower growth rates (Ewel 1977; Ruiz, Fandi~no &
Chazdon 2005), light-demanding short-statured species can persist longer before being overtopped. A light-demanding short-statured strategy would not be advantageous in wet for-ests, where canopy closure occurs rapidly (van der Meer & Bongers 1996) and where canopies are generally higher (Ewel 1977; Bazzaz & Pickett 1980).
Wood density is an important functional trait related to growth rate, structural stability and longevity of trees (Chave
et al. 2006). Tropical secondary forest trees tend to have lower wood density, faster growth and shorter life spans (Woodcock 2000; Guariguata & Ostertag 2001; Wiemann & Williamson 2002). In our data set, we found significant rela-tionships between successional habitat specialization and wood traits in only half the sites studied. However, the stud-ies that have found stronger and more consistent relationships between successional stage and wood density, with low wood density in early successional tree species (Woodcock 2000; Wiemann & Williamson 2002), did not correct for phyloge-netic relatedness. Since wood density is a highly conserved trait in most tropical tree lineages (Chaveet al.2006), analy-sis of wood traits may be particularly susceptible to overinfl a-tion of significance due to phylogenetically non-independent data points (Felsenstein 1985).
The great diversity of lineages that have produced SG spe-cialists and OG spespe-cialists (Fig. 5) complicates our ability to generalize about the life-history traits and functional traits of the species that specialize at the ends of the successional hab-itat gradients in Neotropical forests. Trade-offs along multiple axes govern the way that species partition resources during succession; different lineages have different physiological and anatomical strategies for confronting the range of stresses that occur along successional gradients (Harmset al. 2001; Poor-ter & Markesteijn 2008; Baraloto et al. 2010; Lebrija-Trejos
et al. 2010; Pineda-Garcıa, Paz & Tinoco-Ojanguren 2011; Luet al.2014). The great diversity of functional traits found in tropical tree seedlings in forests across a precipitation gra-dient (Markesteijn & Poorter 2009; Pineda-Garcıa, Paz & Ti-noco-Ojanguren 2011; Luet al. 2014) and the relatively low number of strong correlations between functional traits and successional habitat specialization (Table 3) both suggest that there are many ways of being a successful pioneer.
Costa Rican wet forests and identified clades of angiosperms that were more abundant than the null model expectation in every stage of succession. Extending this work to three wet forest sites (Brazil (BRA), Mexico (CHJ), and an expanded set of sites in Costa Rica (SAR)), Letcheret al.(2012) found significantly under- and overrepresented clades for each stage of succession examined.
The scale at which phylogenetic conservatism is measured can have a strong impact on the detection of conservatism; traits can be overdispersed within clades yet conserved across the phylogeny as a whole or vice versa (Cooper, Jetz & Freckl-eton 2010; Fritz & Purvis 2010). Focusing on particular lin-eages, instead of the angiosperm phylogeny as a whole, may provide more insight into the evolution of successional habitat specialization (Richardsonet al.2004). A tantalizingfinding of Letcher (2010) was that some genera contained species that were overrepresented in several distinct age categories; for instance, oneMiconia species (Melastomataceae) was signifi -cantly associated with old-growth forest, and two others were significantly associated with young forest. OneProtiumspecies (Burseraceae) was significantly associated with old-growth for-est, while another was indicative of older secondary forest. This pattern suggests that taxa can radiate into specialists at particular stages in the successional gradient, asfirst envisioned by Gomez-Pompa (1971) for genera such asPiperand Acaly-phaover four decades ago. The new availability of phyloge-netic data provides opportunities to study these patterns.
Incorporating phylogenetic relatedness into the study of succession has revealed new insights about community assembly (Letcher 2010; Letcher et al. 2012; Norden et al.
2012). Incorporating the study of succession into biogeogra-phy and evolutionary biology could provide new insights as well. When exploring the biogeography and evolution of spe-cies-rich taxa, it may be illuminating to include an investiga-tion of successional habitat specializainvestiga-tion as well as climate and dispersal history (Chanderbali, van der Werff & Renner 2001; Richardsonet al.2004).
In sum, our results show that successional habitat special-ization is a conserved trait for Neotropical trees; though, there are many different pioneer lineages and a concomitant diver-sity of functional traits associated with successional habitat specialization. Our data further suggest that successional habi-tat specialization may be more evolutionarily labile in dry for-ests than in wet forfor-ests, potentially due to the lower dissimilarity of early successional and late-successional habi-tats in dry forests. Future studies will test the strength and generality of this pattern and reveal the extent to which radia-tion into successional niches has shaped plant evoluradia-tion.
Acknowledgements
We thank three anonymous referees whose suggestions improved the manuscript.
The authors gratefully acknowledge thefinancial and logistical support of the
fol-lowing agencies and grants: at CHJ, NWO-WOTRO grant W85-326 to MvB and FB, and SEMARNAT-CONACyT 2002-C01-0597 and SEP-CONACyT CB-2005-01-51043 to MMR; at NIZ, SEP-CONACyT (CB-2009-01-128136) and DGAPA-UNAM (IN 216007-3) grants to JAM; at SAR, NSF DEB-0424767, DEB-0639114 and DEB-1110722 to RLC, Andrew W. Mellon Foundation to
DAC and DBC, NSF predoctoral fellowships to VB and S.G.L. and an OTS grad-uate fellowship to S.G.L.; at BRA, NSF DEB-0614044 to S.G.L., Conselho
Nac-ional de Desenvolvimento Cientifico e Tecnologico (CNPq) to RCGM, and NSF
DEB-1147434 and DEB-0639114 to GBW; at CAR and LUQ, Institute of Latin American Studies, a Cross-Cutting Initiatives Earth Institute (Columbia Univer-sity), and NSF and NASA grants to the University of Puerto Rico; at CHI, BOL-FOR grants to DK and TJK and DEB9201 1026, National Geographic Society 5570-95, and Tinker Foundation grants to TJK; at GUA, support from the Insti-tute on the Environment (University of Minnesota), NASA (NS000107), NSF DEB-1053237 and McKnight Land Grant Professorship (University of
Minne-sota) to JSP, support from the Vicerrectorıa de Investigacion-Universidad de
Costa Rica and Organization for Tropical Studies to E.G.-J. and R.Q.-M.; at KIU,
FOMIX-Yucatan grant YUC-2008-C06-108863 to J.L.H.S. and CONACYT
scholarship 46701 to L.S.V.; at OSA, the Blue Moon Fund; at PAN, data from Barro Colorado Island were supported by NSF 0640386,
DEB-0425651, DEB-0346488, DEB-0129874, DEB-00753102, DEB-9909347,
DEB-9615226, DEB-9615226, DEB-9405933, DEB-9221033, DEB-9100058, DEB-8906869, DEB-8605042, DEB-8206992 and DEB-7922197 to S.P. Hub-bell, the Center for Tropical Forest Science, the Smithsonian Tropical Research Institute, the John D. and Catherine T. MacArthur Foundation, the Mellon Foun-dation, the Small World Institute Fund and numerous private individuals; funding for the Agua Salud Project (secondary forest) came from the HSBC climate part-nership, STRI, the Panama Canal Authority, the Frank Levinson Family Founda-tion and the Motta Family FoundaFounda-tion; at CHM, PAPIIT-UNAM IN208012 to H. Paz, SEP-CONACYT 2012-179045 to A. Martinez-Yrizar, and SEP-CONACYT 2009-129740 and PAPIIT-UNAM IN229007-3 to P.B. We also gratefully
acknowledge ourfield assistants, technicians, taxonomists and parataxonomists,
and the landowners who provided access to their forests. This is publication #671 in the Technical Series of the Biological Dynamics of Forest Fragments Project, BDFFP-INPA-SI.
Data accessibility
Except where otherwise noted, the phylogenetic tree used in this study and data on plot locations, species abundances and functional traits are archived at doi:10.5061/dryad.d87v7.
Species abundance data for:
GUA: DOI:10.1016/j.foreco.2008.10.036,
CAR and LUQ: http://luq.lternet.edu/research/luquillo-forest-dynamics-plot-lfdp,
PAN: old-growth data at http://ctfs.arnarb.harvard.edu/webatlas/datasets/bci/; secondary forest data at http://ctfs.arnarb.harvard.edu/Public/plotdataaccess/. KIU: DOI 10.1111/j.1744-7429.2011.00783.x and DOI 10.1007/s10980-010-9561-3.
Functional trait data for:
GUA: doi: 10.1111/j.1365-2435.2010.01701.x,
PAN: doi: 10.1890/09-2335.1, doi: 10.1007/s00442-015-3339-x.
CAR/LUQ: uploaded to TRY on 5/26/15 as ‘CTFS Luquillo Forest
Dynamics Plot – Swenson’; it will be available in the next data base
update.
References
Balvanera, P., Lott, E., Segura, G., Siebe, C. & Islas, A. (2002) Patterns ofb
-diversity in a Mexican tropical dry forest.Journal of Vegetation Science,13,
145–158.
Baraloto, C., Paine, C.E.T., Poorter, L., Beauchene, J., Bonal, D.,
Domen-ach, A.-M., Herault, B., Pati~no Roggy, J.-C. & Chave, J. (2010)
Decou-pled leaf and stem economics in rain forest trees. Ecology Letters, 13,
1338–1347.
Bazzaz, F.A. & Pickett, S.T.A. (1980) Physiological ecology of tropical
succes-sion: a comparative review.Annual Review of Ecology and Systematics,11,
287–310.
Bhaskar, R., Dawson, T.E. & Balvanera, P. (2014) Community assembly and
functional diversity along succession post-management.Functional Ecology,
28, 1256–1265.
van Breugel, M., Bongers, F. & Martınez-Ramos, M. (2007) Community-level
species dynamics during early secondary forest succession: a test of the
Ini-tial Floristic Composition hypothesis.Biotropica,39, 610–619.
van Breugel, M., Martınez-Ramos, M. & Bongers, F. (2006) Community
van Breugel, M., Hall, J.S., Craven, D.J., Bailon, M., Hernandez, A., Abbene, M. & van Breugel, P. (2013) Succession of secondary forests and their
lim-ited role for the conservation offloristic diversity in a human-modified
tropi-cal landscape.PLoS One,8, e82433.
Chanderbali, A.S., van der Werff, H. & Renner, S.S. (2001) Phylogeny and his-torical biogeography of Lauraceae: evidence from the chloroplast and nuclear
genomes.Annals of the Missouri Botanical Garden,88, 104–134.
Chao, A., Hsieh, T.C., Chazdon, R.L., Colwell, R.K. & Gotelli, N.J. (2015) Unveiling the species-rank abundance distribution by generalizing
Good-Tur-ing sample coverage theory.Ecology,96, 1189–1201.
Chave, J., Muller-Landau, H.C., Baker, T.R., Easdale, T.A., ter Steege, H. & Webb, C.O. (2006) Regional and phylogenetic variation of wood density
across 2456 Neotropical tree species. Ecological Applications, 16, 2356–
2367.
Chazdon, R.L. (2003) Tropical forest recovery: legacies of human impact and
disturbance. Perspectives in Plant Ecology, Evolution and Systematics,6,
51–71.
Chazdon, R.L. (2008) Chance and determinism in tropical forest succession. Tropical Forest Community Ecology(eds W.P. Carson & S.A. Schnitzer),
pp. 384–408. Blackwell, Malden.
Chazdon, R.L. (2014)Second Growth: The Promise of Tropical Forest
Regen-eration in an Age of Deforestation. University of Chicago Press, Chicago, IL.
Chazdon, R.L. & Fetcher, N. (1984) Photosynthetic light environments in a
lowland tropical rain forest in Costa Rica.Journal of Ecology,72, 553–564.
Chazdon, R.L., Careaga, S., Webb, C.O. & Vargas, O. (2003) Community and phylogenetic structure of reproductive traits of woody species in wet tropical
forests.Ecological Monographs,73, 331–348.
Chazdon, R.L., Finegan, B., Capers, R.S., Salgado-Negret, B., Casanoves, F., Boukili, V. & Norden, N. (2010) Composition and dynamics of functional groups of trees during tropical forest succession in northeastern Costa Rica. Biotropica,42, 31–40.
Chazdon, R.L., Chao, A., Colwell, R.K., Lin, S.-Y., Norden, N., Letcher, S.G., Clark, D.B., Finegan, B. & Arroyo, J.P. (2011) A novel statistical
method for classifying habitat generalists and specialists. Ecology, 96,
1332–1343.
Clark, D.A. & Clark, D.B. (1992) Life history diversity of canopy and
emer-gent trees in a neotropical rain forest.Ecological Monographs,62, 315–344.
Coomes, D.A. & Grubb, P.J. (2000) Impacts of root competition in forests and
woodlands: a theoretical framework and review of experiments.Ecological
Monographs,70, 171–207.
Cooper, N., Jetz, W. & Freckleton, R.P. (2010) Phylogenetic comparative
approaches for studying niche conservatism.Journal of Evolutionary
Biol-ogy,23, 2529–2539.
Cornelissen, J.H.C., Cerabolini, B., Castro-Dıez, P., Villar-Salvador, P.,
Mont-serrat-Martı, G., Puyravaud, J.P., Maestro, M., Werger, M.J.A. & Aerts, R.
(2003a) Functional traits of woody plants: correspondence of species
rank-ings betweenfield adults and laboratory-grown seedlings?Journal of
Vegeta-tion Science,14, 311–322.
Cornelissen, J.H.C., Lavorel, S., Garnier, E., Dıaz, S., Buchmann, N., Gurvich,
D.E., Reich, P.B., ter Steege, H., Morgan, H.D., van der Heijden, M.G.A., Pausas, J.G. & Poorter, H. (2003b) A handbook of protocols for standardised
and easy measurement of plant functional traits worldwide.Australian
Jour-nal of Botany,51, 335–380.
Dalling, J.W., Hubbell, S.P. & Silvera, K. (1998) Seed dispersal, seedling
establishment and gap partitioning among tropical pioneer trees.Journal of
Ecology,86, 674–689.
Dalling, J.W., Muller-Landau, H.C., Wright, S.J. & Hubbell, S.P. (2002) Role
of dispersal in the recruitment limitation of neotropical pioneer species.
Jour-nal of Ecology,90, 714–727.
Dupuy, J.M., Hernandez-Stefanoni, J.L., Hernandez-Juarez, R.A.,
Tetetla-Ran-gel, E., Lopez-Martınez, J.O., Leyequien-Abarca, E., Tun-Dzul, F. & May
Pat, F. (2012) Patterns and correlates of tropical dry forest structure and
com-position in a highly replicated chronosequence in Yucatan, Mexico.
Biotro-pica,44, 151–162.
Ewel, J.J. (1977) Differences between wet and dry successional tropical
ecosys-tems.Geo-Eco-Trop,1, 103–117.
Felsenstein, J. (1985) Phylogenies and the comparative method.American
Nat-uralist,125, 1–15.
Finegan, B. (1996) Pattern and process in Neotropical secondary rain forests:
thefirst 100 years of succession.Trends in Ecology and Evolution,11, 119–
124.
Flynn, D.F., Uriarte, M., Crk, T., Pascarella, J.B., Zimmerman, J.K., Aide, T.M. & Caraballo Ortiz, M.A. (2010) Hurricane disturbance alters secondary
forest recovery in Puerto Rico.Biotropica,42, 149–157.
Fritz, S.A. & Purvis, A. (2010) Selectivity in mammalian extinction risk and threat types: a new measure of phylogenetic signal strength in binary traits. Conservation Biology,24, 1042–1051.
Gastauer, M. & Meira-Neto, J.A.A. (2013) Avoiding inaccuracies in tree
cali-bration and phylogenetic community analysis using Phylocom 4.2.
Ecologi-cal Informatics,15, 85–90.
Gentry, A.H. (1988) Changes in plant community diversity andfloristic
compo-sition on environmental and geographic gradients. Annals of the Missouri
Botanical Garden,75, 1–34.
Gitay, H. & Noble, I.R. (1997) What are functional types and why should we
seek them?Plant Functional Types: Their Relevance to Ecosystem Properties
and Global Change(eds T.M. Smith, H.H. Shugart & F.I. Woodward), pp.
1–19. Cambridge University Press, Cambridge.
Gomez-Pompa, A. (1971) Posible papel de la vegetacion secundaria en la
evo-lucion de laflora tropical.Biotropica,3, 125–135.
Good, I.J. (1953) The population frequencies of species and the estimation of
population parameters.Biometrika,40, 237–264.
Grime, J.P. (1977) Evidence for the existence of three primary strategies in
plants and its relevance to ecological and evolutionary theory.American
Nat-uralist,111, 1169–1194.
Grubb, P.J. (1977) The maintenance of species richness in plant communities:
the importance of the regeneration niche.Biological Review,52, 107–145.
Guariguata, M.R. & Ostertag, R. (2001) Neotropical secondary forest
succes-sion: changes in structural and functional characteristics.Forest Ecology and
Management,148, 185–206.
Harms, K.E., Condit, R., Hubbell, S.P. & Foster, R.B. (2001) Habitat
associa-tions of trees and shrubs in a 50-ha neotropical forest plot.Journal of
Ecol-ogy,89, 947–959.
Hernandez-Stefanoni, J.L., Dupuy, J.M., Tun-Dzul, F. & May-Pat, F. (2011)
Influence of landscape structure and stand age on species density and
bio-mass of a tropical dry forest across spatial scales.Landscape Ecology,26,
355–370.
Holbrook, M.N., Whitbeck, J.L. & Mooney, H.A. (1995) Drought responses of
Neotropical dry forest trees.Seasonally Dry Tropical Forests(eds S.H.
Bull-ock, H.A. Mooney & E. Medina), pp. 243–276. Cambridge University Press,
Cambridge.
Kennard, D.K. (2002) Secondary forest succession in a tropical dry forest: pat-terns of development across a 50-year chronosequence in lowland Bolivia. Journal of Tropical Ecology,18, 53–66.
Killeen, T.J., Jardim, A., Mamani, F. & Rojas, N. (1998) Diversity, com-position and structure of a tropical semideciduous forest in the
Chiquita-nia region of Santa Cruz, Bolivia. Journal of Tropical Ecology, 14,
803–827.
Kitajima, K. & Poorter, L. (2008) Functional basis for resource niche
partition-ing by tropical trees.Tropical Forest Community Ecology(eds W.P. Carson
& S.A. Schnitzer), pp. 160–181. Wiley-Blackwell, Hoboken, NJ.
Laurance, S.G.W., Andrade, A. & Laurance, W.F. (2010) Unanticipated
effects of stand dynamism on Amazonian tree diversity. Biotropica, 42,
429–434.
Lebrija-Trejos, E., Perez-Garcıa, E.A., Meave, J.A., Bongers, F. & Poorter, L.
(2010) Functional traits and environmentalfiltering drive community
assem-bly in a species-rich tropical system.Ecology,91, 386–398.
Lebrija-Trejos, E., Perez-Garcıa, E.A., Meave, J.A., Poorter, L. & Bongers, F.
(2011) Environmental changes during secondary succession in a tropical dry
forest in Mexico.Journal of Tropical Ecology,27, 477–489.
Leigh, E.G. (1999)Tropical Forest Ecology: A View from Barro Colorado
Island. Oxford University Press, Oxford, UK.
Letcher, S.G. (2010) Phylogenetic structure of angiosperm communities during
tropical forest succession.Proceedings of the Royal Society B: Biological
Sciences,277, 97–104.
Letcher, S.G. & Chazdon, R.L. (2009) Rapid recovery of biomass, species rich-ness, and species composition in a forest chronosequence in northeastern
Costa Rica.Biotropica,41, 608–617.
Letcher, S.G., Chazdon, R.L., Andrade, A.C.S., Bongers, F., van Breugel, M.,
Finegan, B., Laurance, S.G., Mesquita, R.C.G., Martınez-Ramos, M. &
Wil-liamson, G.B. (2012) Phylogenetic community structure during succession:
evidence from three Neotropical forest sites.Perspectives in Plant Ecology,
Evolution and Systematics,14, 79–87.
Lohbeck, M., Poorter, L., Lebrija-Trejos, E., Martınez-Ramos, M., Meave, J.A.,
Paz, H., Perez-Garcıa, E.A., Romero-Perez, I.E., Tauro, A. & Bongers, F.
(2013) Successional changes in functional composition contrast for dry and
wet tropical forest.Ecology,94, 1211–1216.
Losos, J.B. (2008) Phylogenetic niche conservatism, phylogenetic signal and the relationship between phylogenetic relatedness and ecological similarity