Article in Surface Review and Letters · September 2015 DOI: 10.1142/S0218625X15500912
CITATION
1
READS
85
5 authors, including:
Some of the authors of this publication are also working on these related projects:
Tropical tree plantation ecology and silvicultureView project
Modeling of Tectona grandis heartwood formationView project Alexander Berrocal
Costa Rican Institute of Technology (ITCR)
29PUBLICATIONS 132CITATIONS
SEE PROFILE
Roger Moya Roque
Costa Rican Institute of Technology (ITCR)
176PUBLICATIONS 853CITATIONS
SEE PROFILE
M, Rodríguez-Solís
Costa Rican Institute of Technology (ITCR)
9PUBLICATIONS 2CITATIONS
SEE PROFILE
Ricardo Starbird
Costa Rican Institute of Technology (ITCR)
18PUBLICATIONS 34CITATIONS
SEE PROFILE
SURFACE CHEMICAL AND COLOR
CHARACTERIZATION OF JUVENILE
TECTONA
GRANDIS
WOOD SUBJECTED TO STEAM-DRYING
TREATMENTS
ALEXANDER BERROCAL*, RÓGER MOYA† and MARÍA RODRIGUEZ-SOLIS‡
Escuela de Ingenier{a Forestal Instituto Tecnologico de Costa Rica Apartado 159-7050, Cartago, Costa Rica
RICARDO STARBIRD
Escuela de Qu{mica, Instituto Tecnologico de Costa Rica Apartado 159-7050, Cartago, Costa Rica
FREDDY MUÑOZ Escuela de Ingenier{a Forestal Instituto Tecnologico de Costa Rica Apartado 159-7050, Cartago, Costa Rica
Received 4 June 2015 Revised 22 September 2015 Accepted 23 September 2015
Published
The color ofTectona grandiswood is an attribute that favors its commercialization, however, wood color from fast-growth plantation trees is clear and lacks uniformity. The aim of this work is to characterize steamed teak wood by means of the Fourier transform infrared spectroscopy (FTIR) andLabcolor systems. Two moisture conditions (green and 50%) and two grain patterns (°at and quarter) of boards were analyzed through the application of di®erent steaming times (0, 3, 6, 9, 12, 15 and 18 h). The FTIR results showed that the bands at 1158, 1231, 1373 and 1419 cm1did not show any change with steaming, whereas the bands at 1053, 1108, 1453, 1506, 1536, 1558, 1595, 1652, 1683, 1700 and 1733 cm1presented a decrease in the intensity with the steaming time. The band at 1318 cm1was the only one that increased. Lightness (L) was the most a®ected parameter, followed by yellowness (b), while redness (a) showed the smallest change. Surface color change (E) presented the lowest value between 3 h and 6 h of steam-drying in the boards with °at grain, whereas for boards with quarter grain, the smallestEvalue was obtained after 18 h of steaming.
Keywords: Wood treatment; steam-drying treatment; surface analysis; tropical wood; color uniformity.
†Corresponding author.
1. Introduction
Tectona grandisL.f. has been largely planted in many tropical regions, including Latin America, Asia, Africa and Oceania, covering approximately 6 million ha.1Thanks to its physical, mechanical and aesthet-ical properties, the wood of this tropaesthet-ical species has become one of the most important in international markets.2
Additionally, teak wood color is considered a major attribute regarding commercialization.3 Thu-lasidas et al.4indicated that teak wood is a premier hardwood valued for the attractiveness of its golden yellow or brown color.
Teak color has been widely studied in the past few years.2 The color of the wood from trees grown in plantations is lighter than the color of the wood from natural forests.5,6 For this reason, the price of the wood from trees from short-rotation plantations is lower in the timber market.4
In addition to its lighter color, the great variability of the heartwood color of teak wood is another in-convenience.3,7 For example, Moya and Berrocal7 found approximately 15% variation in the wood color parameters (lightness (L), redness (a) and yellow-ness (b)). Thulasidaset al.4found a similar variation in wood from homegarden trees. Finally, Moya and Marín5 found 31–53% variation in the color para-meters (L,a,b) in cloned trees.
There are various techniques to homogenize the color of the wood or to try to achieve more uniform darker colors.8 Steam-drying treatment has been known for a long time as one of the most e®ective methods to improve the dimensional stability, decay resistance and durability of wood, while simulta-neously darkening the wood color.9In terms of the mechanism for the dark color development, the properties and quantities of major chemicals and ex-tractive compositions in wood are modi¯ed during the steam-heat treatment.9
Wood color can also be homogenized through drying. However, studies on how to obtain darker teak wood are still un¯nished.2For example, in a ¯rst attempt, Berrocal and Agüero10 applied a system of preservation and coloring in order to homogenize the color of the sapwood and the heartwood. Salas and Moya,11meanwhile, found that lightness diminished while redness and yellowness increased after the process of wood drying with three di®erent methods
(air, kiln and solar drying), thus resulting in darker wood.
Other forms of changing the color of teak wood have been implemented which focus on growing trees. They are focused on when the trees are growing. Recently, Moya and Marín5proposed the genetic se-lection of trees with similar color conditions to that of trees growing in plantation conditions, in order to achieve darker and less variable improved teak wood. The color change produced by steaming or drying is caused by chemical changes in the wood surface. The Fourier transform infrared spectroscopy (FTIR) has made it possible to perceive those changes. Spe-ci¯cally, changes occurring in the 800–1800 cm1 band are being studied.12Huanget al.13and Lionetto et al.14 have shown that employing the ratio I
1316/
I1336 provides information concerning the process of degradation of the amorphous and crystalline cellu-lose zones during the steaming. Moreover, changes due to steaming at peaks at 1738, 1596 and 810 cm1 show alterations in the wood hemicellulose and lignin.12,15
Although e®orts have been made to standardize the color of teak wood from plantation trees, little research has been conducted as to the changes pro-duced by steaming in combination with drying on the wood of trees from fast-growth plantations. There-fore, the aim of the present study is to establish the changes of color (measured byLabcolor systems) as well as the chemical changes (by FTIR measure-ments) occurring in the wood surface, using various steaming times (0, 3, 6, 9, 12, 15 and 18 h) in °at and quarter pattern boards in two conditions of moisture content (MC): green and 50%. This work will allow to establish the best conditions regarding steaming time and MC ofTectona grandiswith di®erent grain patterns.
2. Materials and Methods
2.1.
Provenance of the wood, sampling
and moisture condition
density was 475treesha1, with an average diame-ter at breast height (DBH) of 23 cm and 14 m height. The heartwood percentage at DBH varied from 65% to 80%. Approximately, four 2.5 m long logs were extracted from the selected trees. Nine trees were selected from plantation because this number of trees are typically used for determining wood properties.13
The logs were sawn using a grain pattern to pro-duce 25-mm-thick boards, allowing for °at-grain- and quarter-grain-patterned boards. About 120 boards were selected, out of which 60 where °at-grain- and the remaining 60 were quarter-grain-patterned. The boards from each grain pattern were then separated into two groups of 30 boards each. One group pat-terned green condition — was stored to retain the moisture. A second group was air-dried to reach 50% MC. Once both conditions of MC were reached, seven test samples approximately 2.5 cm in width and 35 cm long were extracted from each one of the boards.
2.2.
Steam-drying treatment
For each steam-drying test with water, 30 test sam-ples of each grain pattern and moisture condition were used (7 steaming times2 grain patterns2 moisture conditions30 samples¼840 samples). A steam pilot wooden chamber (200 cm30 cm 30 cm) was used (Fig. 1) and the steam was provided by a 19-l water-heating tank. An electric resistance was employed to boil the water (Fig. 1).
Steam-drying treatments are described in Table 1; about seven di®erent treatments were applied. For each grain pattern and for each moisture condition, four di®erent baths were conducted. The treatments consist of one control sample and six treatments including steaming of the wood in six di®erent dry-ing times, with a di®erence of 3 h between them (Table 1). First, water steam was added into the chamber for a conditioning period of 3 h during which the chamber reaches approximately 70C. The wood to be steam-dried is separated into each grain pattern and moisture condition in seven packages of 30
(a) (b)
Fig. 1. (a) Pilot steaming chamber utilized and (b) intensity at 1031 cm1 band at di®erent steaming times inTectona grandiswood with °at pattern and quarter pattern with di®erent steaming times.
Table 1. Description of the steam-drying treatments applied toTectona grandiswood in plantations.
No. Steaming time (h) Descriptions
1. 0 Control treatment, 0 h steaming and samples dried to 12% MC.
2. 3 Wood was steamed for 3 h and dried to 12% MC.
3. 6 Wood was steamed for 6 h and dried to 12% MC.
4. 9 Wood was steamed for 9 h and dried to 12% MC.
5. 12 Wood was steamed for 12 h and dried to 12% MC.
6. 15 Wood was steamed for 15 h and dried to 12% MC.
7. 18 Wood was steamed for 18 h and dried to 12% MC.
boards each. The control package is left without steam and the other six packages are introduced into the chamber once it has been conditioned and steaming continues. Every 3 h, one package is taken out of the chamber and the wood is dried to reach 12% MC. The steaming time was selected according to previous research in tropical species.16
2.3.
Measurement and analysis
of the FTIR spectra of the
surface of the wood
Once the steam-drying treatment with di®erent times (0, 3, 6, 9, 12, 15 and 18 h) is ¯nished for each grain pattern, three di®erent boards were taken randomly from each time and grain pattern and two small samples were extracted from the surface of the board. Their dimensions (widthlengththickness) were 1 cm1 cm 21 mm (this part is in the surface of the board). The FTIR spectra of the three samples were measured on the surface of the wood by means of a Nicolet 380 FTIR spectrometer (Thermo Scienti¯c) using a single re°ectance ATR cell (equipped with a
diamond crystal). All data were recorded at room temperature, in the spectral range of 4000–700 cm1, by accumulating 64 scans with a resolution of 1 cm1. The FTIR spectra obtained were then processed by the softwares Spotlight 1.5.1, Hyperview 3.2 and Spectrum 6.2.0 developed by Perkin Elmer, Inc. Baseline correction was applied at 1800–800 cm1 and the main components in this vibration band were identi¯ed. This band was selected as several studies have identi¯ed it as the range where the variation in the changes of the surface of the wood mostly occurs,17,18 which are described in Table 2. The height of each peak for each steaming time was recorded and standardized taking the I1031band as a reference, given its stableness in all the conditions studied. The ratio between the various peaks in the range of 800–1800 cm1 (Eq. (1)) was then calculat-ed, as well as the band at 1031 cm1(1) all times and di®erent grain patterns. This band was selected be-cause large di®erences were not observed among treatments. The intensity was 0.155 cm1 in wood with °at pattern and 0.118 cm1 in wood with radial pattern with di®erent steaming times (Fig. 1(b)).
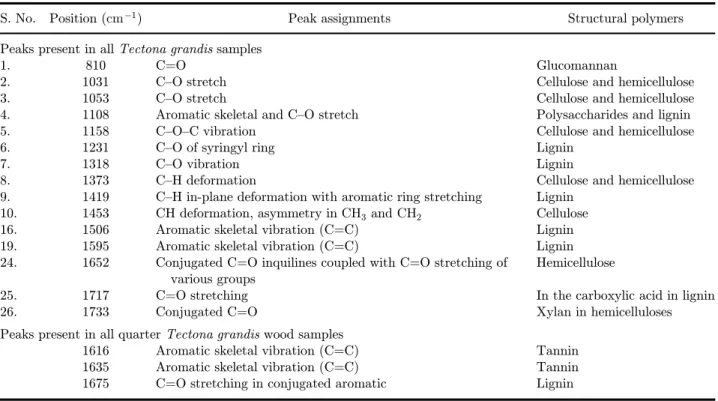
Table 2. Summary of FTIR bands observed between 800cm1 and 1800cm1 in steam-treated Tectona grandiswood surface.
S. No. Position (cm1) Peak assignments Structural polymers
Peaks present in allTectona grandissamples
1. 810 C¼O Glucomannan
2. 1031 C–O stretch Cellulose and hemicellulose
3. 1053 C–O stretch Cellulose and hemicellulose
4. 1108 Aromatic skeletal and C–O stretch Polysaccharides and lignin
5. 1158 C–O–C vibration Cellulose and hemicellulose
6. 1231 C–O of syringyl ring Lignin
7. 1318 C–O vibration Lignin
8. 1373 C–H deformation Cellulose and hemicellulose
9. 1419 C–H in-plane deformation with aromatic ring stretching Lignin
10. 1453 CH deformation, asymmetry inCH3andCH2 Cellulose
16. 1506 Aromatic skeletal vibration (C¼C) Lignin
19. 1595 Aromatic skeletal vibration (C¼C) Lignin
24. 1652 Conjugated C¼O inquilines coupled with C¼O stretching of various groups
Hemicellulose
25. 1717 C¼O stretching In the carboxylic acid in lignin
26. 1733 Conjugated C¼O Xylan in hemicelluloses
Peaks present in all quarterTectona grandiswood samples
1616 Aromatic skeletal vibration (C¼C) Tannin
1635 Aromatic skeletal vibration (C¼C) Tannin
1675 C¼O stretching in conjugated aromatic Lignin
Ratio of intensityðIn=T1031Þ
¼Intensity of peaks between1800to800cm1
Intensity of 1031cm1 :
ð1Þ
2.4.
Surface color measurement and
determination of color change
For all conditions of MC and grain pattern, color was evaluated before the steam-drying treatment. Wood surface color was also determined after each steam-drying treatment once the wood reached approxi-mately 12% MC. The MiniScan XE Plus19 spectro-photometer was utilized to obtain the values of the standardized chromatological system CIELab. The range for this measure is from 400 nm to 700 nm, with 11 mm opening at the point of measurement. The observation of the re°ection included the spec-ular component (SCI mode), at an angle of 10, which is normal for the surface of the specimen (D65/10); a visual range of 2(Standard observer, CIE 1931) and an illumination standard of D65 (corresponding to daylight at 6500 K).
In the analysis of color change, the change in the color parameters (L,a,b) was calculated ¯rst with the aid of Eq. (2).
P ¼PbPa; ð2Þ
where P ¼represents the absolute value of wood color parameters (L,aorb) change between after and before steaming process. Pb is the wood color parameters (L, a or b) after the steam-drying treatment and Pa is the wood color parameters (L, a orb) before the steam-drying treatment.
Following, color change was determined, utiliz-ing the parameter E calculated according to the ASTM D 2244 standard20 whose formula is de-tailed in Eq. (3). The color di®erence (E) was determined for (i) color change that occurred in the wood surface, taking the color before steam-drying treatment as a model, (ii) color change after the steam-drying treatment and (iii) the surface color of wood coming from the natural forest and mature trees,5 aimed at establishing the treatment with the lowest color di®erence with respect to commonly commercialized wood of natural forests (over 100-year-old).
E¼pffiffiffiffiffiffiffiffiffiffiffiffiffiffiffiffiffiffiffiffiffiffiffiffiffiffiffiffiffiffiffiffiffiffiffiffiffiffiffiffiffiffiffiffiffiffiffiffiffiffiffiffiffiffiffiffiffiðLÞ2þ ðaÞ2þ ðbÞ2; ð3Þ
where E¼wood color di®erence, L¼L be-fore steaming L after steaming; a¼a before steaming a after steaming and b¼b before steaming b after steaming. For color change in (ii), the values ofL,a andb after steaming were substituted by L¼44:94, a¼12:44 and b¼24:26, which correspond to the color
para-meters measured in the wood coming from the natural forest.
2.5.
Statistical analysis
In each grain pattern (°at or quarter pattern), a variance analysis (ANOVA) was applied. The aim was to know whether di®erences in the parameter before and after steam-drying treatment exist. The model included the following sources of variation: steaming time (t) at seven levels (0, 3, 6, 9, 12, 15 and 18 h), MC at two levels (green and 50%) and inter-action betweentand MC. The SAS GLM procedure (SAS Institute, Inc.) was used to conduct the analysis of variance.
In addition, a forward stepwise analysis was ap-plied to determine the e®ects of the three color parameters a, b and L on the teak wood color before and after steam-drying treatment, with wood from natural forests as a model. For the FTIR spectra, a scatter plot and then regression analysis were conducted taking into account the steaming time (x-axis) and the intensity ratio values (y-axis). The change in the intensity ratio peak assignment was thus observed for the di®erent steaming times.
3. Results and Discussion
3.1.
Surface chemistry of steamed
Tectona grandis wood measured by
means of the FTIR spectra
Although the entire range of the spectra ð4000– 400cm1Þwas not presented, signals were present in all the steaming periods and grain patterns in the region 3500–2500cm1, corresponding to stretching of O-H group (close to 3400cm1), C–H and
Peak assignments varied slightly in each type of wood (°at or quarter grain) and MC (green and 50%) in the band studied (1000–1800cm1). Table 2 summarizes in its ¯rst part the common peaks for di®erent types of wood treatment and presents the peak assignments, as well as to which polymer they are assigned, based on reports from Moore and Owen,21Li et al.18and Bonifaziet al.23
The infrared spectra of the di®erent treatments studied had revealed that the positions of most bands and their intensities in the ¯ngerprint region are similar while some are slightly di®erent (Fig. 2). It was found that the chemical components with the signal at 810, 1035, 1053, 1108, 1158, 1231, 1318, 1373 (C–H in-plane deformation for polysaccharides), 1419 (C–H in-plane deformation), 1453 (C–H deformation and aromatic skeletal vibrations), 1506 (aromatic skeletal vibrations), 1558, 1595 (aromatic skeletal vibrations), 1652 (conjugated carbonyl), 1683;1700; 1717and1733cm1 (stretching of the carbonyl group C¼O) are present in all surfaces in the di®erent treatments (Figs. 2(a) and 2(b)), while chemical components with the signal at 1540;1554;1575;1616
;1635;1675and1695cm1were observed in the FTIR spectra of the radial samples when the wood was not steam-treated (Figs. 2(c) and 2(d)).
As for the variation of the intensity ratio for each one of the peaks within the band of 800–1800cm1, it was observed that the signal at 1158, 1231, 1373 and 1419cm1 did not show any trend in the index, due to the treatment of the wood with di®erent steaming times and grain patterns of the boards. Meanwhile, the signals at 1053, 1108, 1453, 1506, 1536, 1558, 1595, 1652, 1683, 1700 and 1733 cm1showed diminution of the index of vibration re-garding the steaming time (Figs. 3(a), 3(b) and 3(d)– 3(l)). The only vibration where the index augmented was 1318cm1(Fig. 3(c)). In the same way, the vari-ation coe±cient varied from 10% to 22% at di®erent intensities (Table 3) and any tendency was not found. As for the signals at 1540, 1554, 1575, 1616, 1635, 1675 and 1695cm1, present in the FTIR spectra of the quarter pattern samples of wood not treated with steam, they diminished or disappeared once the wood was steam-treated (Figs. 3(c) and 3(d)).
As for the bands associated to cellulose (1053, 1373, 1158 and 1453cm1), a decrease in the signals in the band between 1053cm1 and 1453cm1 (Figs. 3(a) and 3(d)) was observed, while the signals
at 1318cm1 increased (Fig. 3(c)). Meanwhile, the signals 1373 and 1158cm1 did not show any mod-i¯cations. The diminutions observed in the cellulose indicate either the occurrence of changes in its structure or the formation of other compounds, such as the formation of aliphatic alcohols during steam-ing,18 which becomes evident in the change of the intensity at 1055cm1.
A major aspect to emphasize of the steaming process inTectona grandis wood, is the variation in the intensity of the signals at 1053cm1 (Fig. 3(a)) and the increment in the intensity at 1318cm1 (Fig. 3(c)). These changes are designated to increase the glucose ring stretching vibration, and may be due to the cleavage and dehydration of amorphous car-bohydrates and/or crystallization of the paracrystal-line region of cellulose.14The increment in the intensity ratio in the signal at 1318cm1(Fig. 3(c)) indicates a decrease in the percentage of cellulose crystallinity.18 This reveals that the amorphous regions of the teak wood increase with the steaming time.14
The changes in the intensity of the signals associ-ated with hemicelluloses and lignin—shown in peaks at 1733cm1 (O-acetyl-4-O-methylglucurono-xylan) (Fig. 3(l)), and 1595cm1 (belonging to C¼O stretching vibrations in the carboxyl group of glu-curonic acid unit in xylan) (Fig. 3(h))—to the aro-matic skeletal vibrations plus C–O stretch of lignin24 and to vibrations caused by the equatorially aligned hydrogen at theC2 atom in the mannose residue of glucomannan,15clearly indicating the changes in the structure of the hemicelluloses and the structure of the lignin of teak wood as a result of steaming.
result the di®erences between softwood and hard-wood species.
Nevertheless, those changes behaved di®erently with the steaming time and the grain pattern. For example, with the change of intensity at 1595cm1 (Fig. 3(h)), associated to lignin, the main change occurs at 3 h of steaming, with no more changes thereafter. On the other hand, regarding the intensity associated to xylan, an increment in the ratio I1733/I1031 is observed with the steaming time (Fig. 3(l)), indicating further change in the structure of this hemicellulose due to the steaming process.
The intensity of vibration of the xylan band at 1453cm1 (Fig. 3(d)) ascribed to CH2 symmetric bending on the xylose ring15 only showed small changes for the di®erent steaming times. Because the 1456cm1 peak, associated to the xylan backbone, was nearly una®ected, it is probable that no major degradation of the xylan backbone had occurred, and that the primary e®ect on the xylan was a side group splitting.12
The larger decrease in the relative signal between 1596cm1 to 1733cm1 (Figs. 3(h)–3(l)), especially during the ¯rst 3 h of steaming of the °at pattern
Fig.
3.
Changes
in
the
ratio
of
intensity
(
In
/
T1031
)
band
at
di®erent
steaming
times
in
Tectona
grandis
wood
with
°at
pattern
and
quarter
pattern
with
di®erent
steaming
samples, and the steady diminution in quarter pat-tern samples (Fig. 3(h)), in combination with the lower change in intensity at 1506cm1 (Fig. 3(e)), indicate that a loss of the C¼O group linked to the aromatic skeleton of lignin has probably occurred.
This could indicate that cross-links have been formed between aromatic units in the lignin. Obviously, dif-ferent behaviors are observed for hemicelluloses and lignin in relation to the degradation under steam conditions. This points to the degradation of
Table 3. Coe±cient of variation (%) of change in the ratio of intensity (In=T1031) band at di®erent steaming
times inTectona grandiswood with °at pattern and quarter pattern with di®erent steaming times.
Radial grain Tangential grain Radial grain Tangential grain
IT TS(h) 50% Green 50% Green IT TS(h) Green 50% Green 50%
1053 0 16 23 21 17 1108 0 19 23 13 20
3 15 14 14 19 3 15 16 15 20
6 22 20 15 24 6 15 32 16 23
9 19 29 15 22 9 12 30 13 22
12 18 24 13 20 12 18 26 20 24
15 9 18 14 31 15 12 19 19 35
18 17 21 16 22 18 12 23 23 21
1318 0 17 10 11 21 1453 0 22 15 21 18
3 23 13 15 15 3 21 17 21 20
6 20 24 17 22 6 20 16 20 18
9 20 21 17 18 9 16 17 18 19
12 20 15 18 24 12 22 18 20 21
15 18 15 13 21 15 16 17 18 17
18 18 14 14 21 18 18 21 22 20
1506 0 16 12 24 21 1536 0 15 15 17 18
3 12 19 19 20 3 21 15 16 16
6 19 17 17 20 6 22 16 18 17
9 16 22 26 23 9 19 14 20 20
12 25 19 19 24 12 16 17 15 13
15 17 17 22 21 15 22 20 17 16
18 14 25 24 21 18 19 19 12 14
1558 0 15 12 15 12 1595 0 15 12 15 17
3 13 11 15 10 3 10 15 17 19
6 12 11 14 10 6 13 17 18 18
9 11 11 12 13 9 17 18 16 16
12 14 13 15 11 12 14 11 16 13
15 11 13 13 13 15 19 14 15 18
18 11 12 13 9 18 21 12 16 17
1652 0 17 13 17 13 1683 0 13 23 17 20
3 16 12 19 17 3 16 18 18 20
6 17 17 16 17 6 17 18 18 20
9 17 16 17 19 9 15 20 20 21
12 14 11 15 19 12 19 22 22 20
15 15 13 15 19 15 15 21 22 19
18 18 12 15 16 18 15 21 19 19
1700 0 19 22 22 12 1703 0 19 14 16 12
3 15 19 23 14 3 15 17 13 14
6 14 19 20 12 6 14 13 17 12
9 16 15 18 12 9 16 15 18 12
12 13 21 23 11 12 13 13 13 14
15 19 16 23 12 15 14 16 13 13
18 14 22 15 14 18 14 13 15 13
hemicelluloses and lignin following di®erent path-ways. Lignin cross-linking is probably a radical reac-tion25 which might be favored by the increased density of the wood material while the hemicellulose degradation is probably more favored by the more open access to dissolution of carbohydrates.26
3.2.
Color change in Tectona grandis
surface wood induced by steaming
and drying
Wood color before the steam-drying treatment showed di®erences by grain pattern and MC. Flat pattern boards in the two moisture conditions studied (green and 50%) presented lower values of lightness (L) and higher values of redness (a) relative to quarter pattern boards. As for yellowness (b), the color showed no di®erence between °at and quarter patterns before steaming (Table 4). Di®erences in color by grain pattern have been pointed out for several species.27,28
The di®erences in the color parametersLanda and the lack of di®erence among parameterb, may be explained by two studies: (i) according to Gier-lingeret al.,29redness (a) and lightness (L) indexes
are more correlated with wood extractive content, while the yellowness index is primarily related to the lignin's photochemistry; (ii) on the other hand, Valverde and Moya30mention that many extractives settle in the radial parenchyma cells, which means that in a radial surface, color will change more than that in a tangential surface. Therefore, L and a should be expected to change in green condition, since the extractives are exposed and the lignin still has not begun to photodegrade as the drying process has not started, which explains why the di®erences inb are not observed in °at and quarter pattern boards.
The magnitude of the color parameters changed in the di®erent steaming–drying times (Table 4), L in particular, followed byband, to a lesser extent,a. The steam-drying treatment increased lightness (L) signi¯cantly in °at and quarter grain green-condition boards (Table 4); however, when the board presents MC above 50%, the e®ect is the opposite, signi¯cantly reducingL.
This behavior is re°ected in the di®erential values of luminosity (LÞ.L values in °at and quarter pattern steam-dried woods were positive for wood in green condition, as opposed to 50% MC wood, where L values were negative (Figs. 5(a) and 5(b)). No Fig. 4. FTIR spectra from 775cm1to 835
de¯ned behavior was observed in °at pattern among the di®erent times (Fig. 5(a)). The lowest value of L in °at pattern boards was observed during the
9 h of steam-drying and in the 3 h of steaming, for green-condition wood and 50% MC, respectively (Fig. 5(a)). For quarter pattern board, the L values were not the lowest, after 12 h of steaming of the green-condition wood, while an increase in the steaming time in 50% MC wood was observed (Fig. 5(b)).
Meanwhile, the parameter of redness (a) was statistically una®ected in °at and quarter pattern boards in green condition between 0 h and 12 h of steaming–drying. Nevertheless, in the 15- and 18-h steaming treatment, the parametera decreased sig-ni¯cantly in both types of grain pattern (Table 4). This is re°ected in the fact that the largest di®erential redness value (a) was observed at those steaming
times in the two types of grain pattern (Figs. 5(c) and 5(d)). Steam-drying results vary between °at and quarter patterns when the wood has 50% moisture content. For °at grain boards, the redness value increases statistically with any steaming–drying time, while in quarter pattern boards, this color parameter was not statistically a®ected (Table 4). Again, this behavior may refer to the changes in the di®erential redness values (a), which were positive (above one) for °at pattern boards at all steaming times (Fig. 5(c)). In the quarter pattern boards, the same values were negative, without exceeding 0.5 (Fig. 5(d)).
The color parameter b decreased statistically after steaming–drying for both grain patterns in green condition, but for the wood with 50% MC, it was only a®ected statistically in the °at pattern boards that have been subjected to the steam-drying treatment during 3 and 9 h of streaming and in
Table 4. Lab system color parameters of Tectona grandis wood before and after the di®erent steaming–drying times.
Steaming time (h)
MC Color parameters Time 0 3 6 9 12 15 18
Flat pattern
Green L Before 40:1A 41.5A 43.4A 43.7A 42.2A 41.2A 42:7A
After 55.2B 53.9B 54.2B 53.5B 55.7B 55.5B 54.4B
a Before 11:7A 10.8A 10.4A 11.1A 11.3A 11.5A 11:1A
After 11.0A 11.2A 10.4A 9.9A 10.3A 9.9B 9.6B
b Before 29.0A 28.4A 29.1A 28.9A 29.4A 28.3A 29:4A
After 27:8A 25.4B 27.0B 26.2B 27.9A 26.5B 25.6B
50% MC L Before 56:5A 53.5A 54.9A 55.1A 55.4A 57.4A 55:8A
After 51.2B 50.5B 50.4B 51.7B 51.4B 50.0B 50.2B
a Before 8.1A 8.0A 8.2A 7.8A 8.0A 7.4A 7:3A
After 9.4B 9.6B 9.1A 9.4B 9.3B 8.4B 8:5A
b Before 22:9A 23.8A 25.6A 25.7A 27.6A 27.8A 27:7A
After 23:8A 25.7B 26.3A 28.6B 29.0A 28.1A 28:4A
Quarter pattern
Green L Before 45:4A 46.6A 43.3A 45.2A 46.3A 45.2A 43:6A
After 54.5B 57.3B 56.6B 57.5B 56.1B 55.1B 53.7B
a Before 9:1A 9.4A 10.3A 9.8A 9.2A 9.5A 10:4A
After 8:7A 8.9A 9.4A 9.0A 8.6A 7.8B 7.6B
b Before 29:9A 29:4A 28.5A 29.1A 29.7A 29.1A 27:1A
After 27.8B 27.5B 26.5B 28.1A 27.3B 25.3B 24.3B
50% MC L Before 61:3A 62.7A 62.5A 62.1A 62.5A 62.2A 61:5A
After 60:2A 60.5B 60.2B 59.5B 57.5B 56.0B 54.4B
a Before 8:4A 8.1A 9.1A 9.0A 8.7A 8.5A 8:7A
After 8:8A 8.3A 8.6A 8.8A 8.2A 8.0A 8:2A
b Before 27:8A 30.9A 27.8A 27.5A 26:8A 29:5A 29:1A
After 29:2A 28.6A 28.3A 28.4A 26.6A 25.8B 24.5B
quarter pattern boards between 15 h and 18 h of steaming (Table 4). The di®erential change of yel-lowness (b) showed that the greatest di®erentials are observed at 3 and 9 h in °at pattern board, and after 15 h of steaming in quarter pattern boards (Figs. 5(e) and 5(f)).
The behavior of the color parameters is compared to other studies, such as Salas and Moya11 and Basri et al.,31which were conducted under similar moisture or grain pattern conditions. The above mentioned authors found thatLandbdiminished statistically when the wood is dried, whereasa was statistically una®ected. The results were only congruent for 50% MC wood and not for °at pattern (Table 4) or green-condition wood. In the evaluation of the surface color change (E) after the steam-drying treatment, compared
to the teak from natural forest, a minor change was obtained in the °at grain wood between 3 h and 6 h steaming–drying, for both moisture conditions. Fur-thermore, color change tends to decrease in quarter pattern boards with increasing steaming–drying time (Fig. 6).
achieve the desirable color. According to the E values found with the di®erent steaming times and grain patterns (Fig. 6), the lowest color di®erence between steamed wood and model teak is achieved after 3 h of the steam-drying of the °at pattern boards at 50% moisture content and 6 h of steam-drying of the green condition wood. Meanwhile, for quarter pattern boards, the best condition is 18 h of the steam-drying (Fig. 5).
Color changes relative to changes in the mod-i¯cations of the chemical composition of the surface of °at pattern boards, coincide with the diminution of the relative intensity between 1596 and 1733cm1 (Figs. 3(h)– 3(l)) and the lowest value of the wood color di®erence indexE in this type of grain pat-tern (Fig. 6). As for the quarter patpat-tern board, with the constant change of the ratio of intensity (ratio In/I1031), it also coincides with the decrease of the color change with the steaming time (Fig. 6). This means that color changes of the wood probably occur due to the loss of the C¼O group linked to the aro-matic skeleton of lignin. Speci¯cally, cross-links have been formed between aromatic units in the lignin. However, hemicellulose degradation may also be oc-curring. Glucose, for example, showed alteration in the signals at 1318cm1 (Fig. 3(c)) or xylan, indi-cated by the alteration in the bands at 1453cm1 (Fig. 3(d)), which favor dissolution of carbohydrates during steaming,31leaving it more exposed to lignin. As a result, redness (a) in the wood tends to be higher in the case of °at green wood after 3 h of
steaming (Fig. 3(c)), and the di®erences in the values of a in quarter pattern boards after 18 h of steaming are greater.
4. Conclusion
The FTIR bands at 1031, 1053, 1108, 1158, 1231, 1318, 1373, 1419, 1453, 1506, 1558, 1595, 1652, 1717 and 1733cm1 signals in the range studied (800–1800cm1) were found to be present in the surfaces of all the di®erent treatments. On the other hand, the chemical components with signals at 1540, 1554, 1575, 1616, 1635, 1675 and 1695cm1 were evidenced in the FTIR spectra of the quarter pattern samples of wood not subjected to steaming, therefore, were only present in wood before steaming. Regarding the signals at 1158, 1231, 1373 and 1419cm1, it was not possible to observe any trend in this intensity; however, bands at 1053, 1108, 1453, 1506, 1536, 1558, 1595, 1652, 1683, 1700 and 1733cm1 showed a de-crease in the vibration ratio with the steaming time. The only signal where this ratio augmented was at 1318cm1 probably due to the reduction of the cel-lulose crystallinity by the steaming–drying process, however further research is required to con¯rm it.
Di®erent steaming–drying times changed the magnitude of the color parameters,L in particular, followed by yellowness (b) and then by redness (a). The evaluation of the color change of the surface due to steaming–drying, with teak wood from natural forests as the model, shows that °at pattern boards present the lowest change between 3 h and 6 h of steaming– drying in the two moisture conditions, while in quarter pattern boards, color change tends to diminish with the increase of the steaming–drying time.
Color changes relative to changes in the mod-i¯cations of the chemical composition of the surface of °at pattern boards, coincide with the diminution of the relative intensity between 1596cm1 and 1733cm1 (Fig. 1) and the lowest value of the wood color di®erence indexE in this type of grain pat-tern (Fig. 5). As for the quarter patpat-tern boards, the constant change of the ratio of intensity (ratio In/I1031) also coincides with the decrease of the color change with the steaming time. This means that color changes of the wood probably occur due to the loss of the C¼O group linked to the aromatic skeleton of lignin.
Acknowledgments
The authors wish to thank the Vicerrector{a de Investigacion y Extensionat theInstituto Tecnologico de Costa Rica (ITCR), and we thank Life Forestry Costa Rica S.A. for providing a sample of their 11-year-old teak trees from their plantations for the present study.
References
1. FAO, Planted Forests and Trees, Global Planted Forests Thematic Study: Results and analysis, Work-ing Paper No. 38, FAO, Rome (2006).
2. R. Moya, B. Bond and H. Quesada,Wood Sci. Tech-nol.48(2014) 411.
3. R. Moya and J. Calvo,Ann. For. Sci.69(2012) 947. 4. P. K. Thulasidas, K. M. Bhat and T. Okuma,J. Trop.
For. Sci.18(2006) 51.
5. R. Moya and B. Marin,New Forests42(2011) 3296. 6. K. M. Bhat,Wood News9(1999) 48. 11. C. Salas and R. Moya,Drying Technol.32(2014) 301. 12. J. Guo, K. Song, L. Salmen, Y. Yin, Carbohydrate
Polym.115(2015) 207.
13. X. N. Huang, D. Kocaefe, Y. Kocaefe, Y. Boluk and C. Krause,Appl. Surf. Sci.264(2013) 117.
14. F. Lionetto, R. Sole, D. Cannoletta, G. Vasapollo and A. Ma®ezzoli,Materials5(2012) 1910.
15. J. S. Stevanic and L. Salmen, Holzforschung 63
(2009) 497.
16. D. Varga and M. E. Van der Zee,Holz Roh. Werk.66
(2008) 11.
17. L. Calienno, C. Pelosi, R. Picchio, G. Agresti, U. Santamaria, F. Balletti and A. L. Monaco, Stud. in Conserv.60(2015) 131.
18. M. Y. Li, S. C. Cheng, D. Li, S. N. Wang, A. M. Huang and S. Q. Sun,Chin. Chem. Lett.26(2015) 221. 19. R. S. Hunter and R. W. Harold, HunterLab: The
Measurement of Appearence (John Wiely and Sons, New York, 1995).
20. American Society for Testing and Materials (ASTM), ASTM D2244-11: Standard Practice for calculation of Color Toleraces and Color di®erences from instru-mentally measured color coordinates, ASTM, West Conshohocken, PA (2014).
21. A. K. Moore and N. L. Owen,Appl. Spectrosc. Rev.
36(2001) 65.
22. N. H. Okoye, A. N. Eboatu, J. S. Fabiyi, P. I. Udeozo, R. U. Arinzea and S. C. Odinma,Am.-Eurasian J. Sci. Res.9(2014) 45.
23. G. Bonifazi, L. Calienno, G. Capobianco, A. Lo Mon-aco, C. Pelosi, R. Picchio and S. Serranti, Polym. Degrad. Stab.113(2015) 10.
24. M.Akerholm and L. Salmen,Polymer42(2001) 963. 25. L. P. Ramos,Qu{m Nova26(2003) 863.
26. G. Garrote, H. Domínguez and J. C. Parajó,Holz Roh. Werk.59(2001) 53.
27. B. Dos Santos, V. Sâmia, G. I. Bolzon and J. L. Monteiro de Matos,Cerne20(2014) 337.
28. M. Nakamura, Y. Miyake and T. Nakano,J. Wood Sci.
58(2012) 505.
29. N. Gierlinger, D. Jacques, M. Grabner, R. Wimmer, M. Schwanninger, P. Rozenberg and L. E. Pâques,Trees
18(2004) 102.
30. J. C. Valverde and R. Moya, Color Res. Appl. 39
(2014) 519.
31. E. Basri, D. Rohadi, T. Priadi and I. Wahyudi,J. Ilmu Tek. Kayu Tropis2(2004) 57.
32. W. Cui, P. Kamdem and T. Rypstra,Wood Fiber Sci.
36(2004) 291.