Rule-Based Control of Off-Grid Desalination Powered by
Renewable Energies
A. Serna1, F. Tadeo1, D. Torrijos2 1University of Valladolid, 47005 Valladolid, Spain
E-mail: [email protected],
2
SETA S.L., Rivas-Vaciamadrid, Madrid, Spain
Abstract - A rule-based control is presented for
desalination plants operating under variable,
renewable power availability. This control algorithm is based on two sets of rules: first, a list that prioritizes the reverse osmosis (RO) units of the plant, based on the current state and the expected water demand; secondly, the available energy is then dispatched to these units following this prioritized list. The selected strategy is tested on a specific case study: a reverse osmosis plant designed for the production of desalinated water powered by wind and wave energy. Simulation results illustrate the correct performance of the plant under this control strategy.
Keywords - Renewable energies, off-grid, desalination, rule-based control, reverse osmosis.
I. INTRODUCTION
Desalination is becoming increasingly used in many areas of the world to satisfy the demand of water. This process produces water (for human or industrial use) by removing most of the salts, generally from sea or brackish waters. Desalination systems are ubiquitous. The capacity estimation for 2015 goes beyond 120 Mm3/day and the cost of drinkable water obtained from desalination is steadily decreasing. Although currently most large-scale desalination plants are connected to the grid, renewable energies are being introduced especially in small desalination plants located in areas without a reliable electricity grid. Australia is an important exception, where the biggest seawater desalination plants are powered by renewable energies: see [1] and [2] for a detailed description of desalination plants powered by renewable energy sources.
This paper concentrates on Reverse Osmosis (RO) plants, as this is the most frequently used process for small and medium sized plants. RO uses high pressures to force water molecules through a semi permeable membrane, retaining salt particles on the high pressure side (see, for example [3], and [4] for
some general references of RO desalination). The pressure required goes from 40 to 80 bars, depending on the salt concentrations (see for example [5]). This pressure is supplied by high-pressure pumps (positive-displacement, centrifugal, etc) that consume a significant amount of electric power. When renewable energy sources are the main source of energy, a central problem is balancing the power consumption with the power production; this is solved here using the active load concept used in micro grids (see [6], [7] and references therein).
More precisely, small desalination plants are considered here, as they are frequently installed in remote areas powered by renewable energies (see [8] and [9]), and a proposal for its control, that has been developed in the context of the H2 Ocean Project*, is presented and evaluated here. In fact, many different ideas have been proposed in the literature for the control of these systems, as control significantly improves the performance (see for example [10], [11], [12] and [13] for some previous control proposals). In this case, following the proposal studied by some of the authors in [14], the desalination plant is considered to be partitioned in several stages, consisting of parallel lines connected through buffer tanks.
Each of them operates at a constant working point and can be connected or disconnected depending on the available energy and the amount of water stored in each tank. Thus, the control proposal discussed here is based on deciding which sections would be switched on or shut down. So, only the energy available at each time is used; while unused energy would be temporarily stored in batteries for later use. In order to minimize the use of batteries, most of the power should be immediately consumed by the desalination system; yet at the same time the water in all the sections of the process should be secured (by ensuring that the water is properly stored in the buffer tanks), and thus no production is lost.
Section II the problem statement is presented. Section III discusses the control system. Section IV presents the case study. Section V evaluates the results and a discussion is given. Finally the paper ends with a conclusion section.
II. PROBLEM STATEMENT
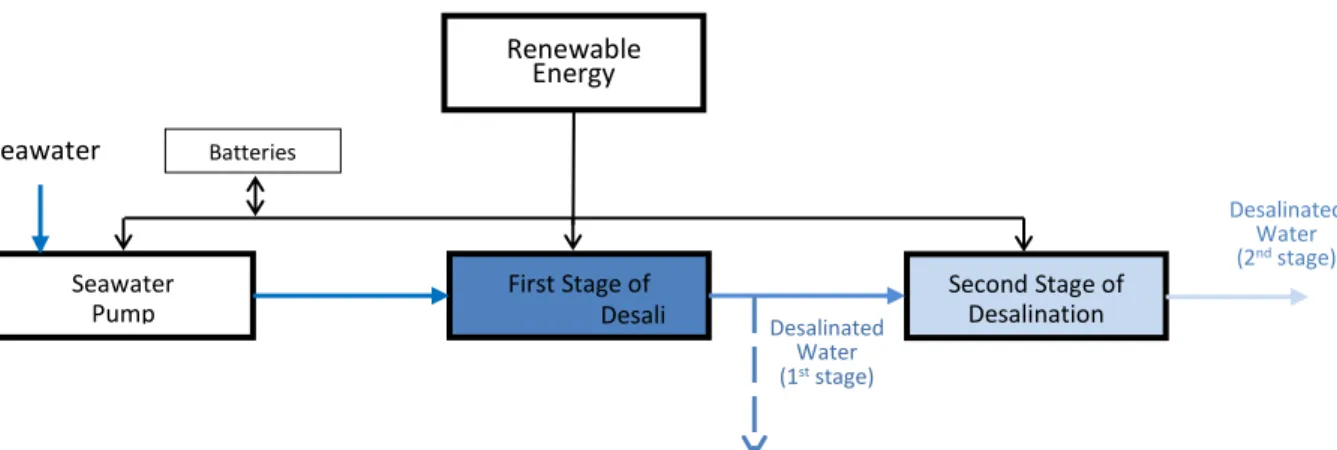
Figure 1 presents the main components of the desalination plants studied here. If the power supply changes by time, the production of water is also going
to change by time in order to adapt to the available power. Changing the working point of the plant by selecting a different flow/pressure set point is not adequate for most Reverse Osmosis systems, as they are designed to correctly operate at a given set point, although connection and disconnection of the devices of the desalination plant may have constraint in practice. Thus, in a previous paper by the authors [14], it was proposed to partition the high pressure part of the RO plant in
Fig .1. Renewable-Energy Powered Desalination system under study
the devices of the desalination plant may have constraint in practice. Thus, in a previous paper by the authors [14], it was proposed to partition the high pressure part of the RO plant in different parallel sections. Each section is operating as a standard RO plant (producing water at a fixed working point), regardless of being connected or disconnected when needed, as it follows a pre-programmed sequential functional chart. This proposal was selected as it is simple to implement in the existing control systems of Desalination Plants, making it possible to operate the whole plant as an active load by temporally
disconnecting components until the predicted
electrical consumption is fully used.
Unfortunately, the approach previously presented is not suitable enough in case there is a significant number of units of consumption being used, as it would conflict with the control objectives. Particularly speaking, it is not quite adequate for multi-stage desalination plants operated by lines, as the number of components with high electrical consumption (high pressure pumps) is too big to make a functional block diagram that accurately represents the control
objectives. Thus, an alternative procedure is presented in the next section, which combines the possibility of implementation of existing control hardware (PLCs) with the fulfillment of conflicting control objectives.
III. CONTROL SYSTEM
This section studies the control system to be developed for that class of desalination plants. There are some previous works that use rule-based control strategies in the case of energy management [15, 16]. In [15] a rule-based control for a case of a series of a hybrid vehicle is designed; whereas in [16] a type of control strategy in case of ice storage systems is developed. In our proposal, we have selected a ruled-based control strategy for a reverse osmosis plant powered by renewable energy as it is simple enough to be implemented and give good results out of its operation.
A. Control Structure
For simplicity, the controller is presented for a single First Stage of
Desali a ion Batteries
SecondStage of Desalination Seawater
Pump
Renewable Energy
Seawater
Desalinated Water (1st stage)
Desalinated Water
seawater pump plant with two high pressure pumps for the first stage and two high pressure pumps for the second stage of the reverse osmosis. Parallel
approaches can be developed for other
configurations, maybe by adding more components and supplying different rated powers. The main aim is to ensure a smooth operation of the facility by means of the control system. We need to balance power consumption with the available power, by deciding which components of the plant are connected or disconnected. These components are:
The seawater pump (SWP).
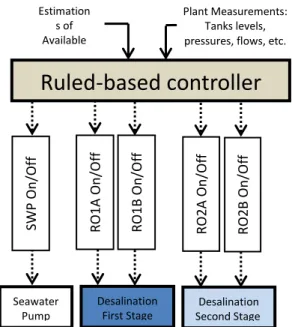
Each of the lines and stages of the desalination system: in the simplified structure presented in Figure 2, they would be denoted RO1A, RO1B, RO2A and RO2B.
The control variables are then the connection of the SWP and the different sections of the Reverse Osmosis (see Figure 2).
B. Control Objectives
The main objectives can be written in a prioritized way as follows:
Keep all the buffer tanks over a minimum level, so the next section can operate properly.
Once a unit of consumption is connected, it should be kept operating at its nominal value as long as there is enough energy.
Fig .2. Proposed structure of the control system
C. Control Algorithm
The control strategy is based on two consecutive steps that are defined by different rules:
1.
At each sampling time
create a prioritized list of units of the water plant based on the current state of the plant (i.e., the tank levels and the units that are currently operating) and the expected water demand. This list of prioritized
units is denoted
{𝑈
𝑖}
𝑖=1𝑁 . Another list of predictedenergy demands should be associated,
denoted
{𝐸
𝑖}
𝑖=1𝑁 . These lists are generated based on the knowledge of the process, in order to fulfill the requirements given in section III.B. For example, the following algorithm is used for the structure in Figure Figure 3 to generate
Initialize:
{𝑈
𝑖}{𝑆𝑊𝑃, 𝑅𝑂1𝐴, 𝑅𝑂1𝐵, 𝑅𝑂2𝐴, 𝑅𝑂2𝐵}
At each sample time:
IF the level of SWT is LOW THEN increase the priority of SWP
decrease the priority of RO1A and RO1B
IF the level of BT1 is LOW THEN
increase the priority of RO1A and RO1B decrease the priority of RO2A and RO2B
IF the level of BT2 is LOW THEN
increase the priority of RO2A and RO2B IF the level of SWT is HIGH THEN
decrease the priority of SWP increase the priority of RO1A and RO1B
IF the level of BT1 is HIGH THEN
decrease the priority of RO1A and RO1B increase the priority of RO2A and RO2B
IF the level of BT2 is HIGH THEN
decrease the priority of RO2A and RO2B Estimation
s of Available
Energy
R
O2A
On
/O
ff
R
O2
B On
/O
ff
Desalination First Stage
Desalination Second Stage Seawater
Pump
Ruled-based controller
Plant Measurements: Tanks levels, pressures, flows, etc.
RO1A On
/O
ff
RO1B On
/O
ff
SWP
On
/Of
2.
Distribute the available energy
from among the units, following the prioritized list
{𝑈
𝑖}
𝑖=1𝑁;
; when possible, energy is assigned to those units with a higher priority. That is, a list of units that would be operating during the next sample, denoted {𝑂𝑗}𝑗=1𝑚
, is generated together with the
corresponding list of predicted energy
demands{𝐸𝑂𝑗}𝑗=1 𝑚
. The disconnected elements would
be {𝐷𝑗}𝑗=1 𝑁−𝑚
,, with the corresponding unsatisfied
energy demands{𝐸𝐷𝑗}𝑗=1 𝑁−𝑚
.
The energy consumed
by the connected units fulfill
∑
𝑚𝑗=1𝐸𝑂
𝑗≤ 𝐸
, while
all the units in the set of disconnected units fulfill
𝐸 − ∑
𝑚𝑗=1𝐸𝑂
𝑗≤ 𝐸𝐷
𝑘∀𝑘
These lists can be generated by examining the list of
predicted energy demands,
{𝐸
𝑖}
𝑖=1𝑁,
, generated inparallel with
{𝑈
𝑖}
𝑖=1𝑁,
, as given by the following Algorithm:1.
At each sampling time
Initialize{𝐸𝑂} = { }; {𝐸𝐷} = { };
m=0;
FOR𝑖 = 1: 𝑁
IF
𝐸
𝑖≤ 𝐸 − ∑
𝑚𝑗=1𝐸𝑂
𝑗THEN
m=m+1
𝑂
𝑚= 𝑈
𝑖𝐸𝑂
𝑚= 𝐸
𝑖OTHERWISE
𝐷
𝑖−𝑚= 𝑈
𝑖𝐸𝐷
𝑖−𝑚= 𝐸
𝑖IV. CASE STUDY
As a practical case study, the proposed control strategy was applied to a desalination plant for an industrial process designed to produce up to 68 m3/h of demineralized (DEMI) water and up to 20 m3/h of drinkable and service water. It consumes renewable
electricity with variable production. A schematic diagram is presented in Figure 4.
The characteristics of each of its units of consumption are as follows:
A 51 kW (PSWP) seawater pump that provides a
nominal flow rate of 256 m3/h (QSW).
Q
DEQ
DE HIGH PRESSURE PUMPHP2A
HP1B
HP2B
DEMI Water Tank
BT2
RO1A
RO1B
RO2A
RO2B
Seawater
Intake
Pretreatment Tank SWT
Osmotised Tank
BT1
SEAWATER
PUMP (SWP)
HIGH PRESSURE PUMP
HP1A
Osmotised
Water
(1
ststage)
DEMI Water
(2
ndstage)
Brine Recirculation
Figure 3: Structure of the desalination plants under study
Q
OS The first stage of the Reverse Osmosis plant RO1 consists of two similar lines, each designed to produce 57 m3/h (QOS) of water when
connected (with a recovery ratio of around 45%),
consuming 155 kW (PHP1) per line
(corresponding to approximately 2.7 kWh/m3)
when they are operating.
The second stage, RO2, also consists of two similar lines, which, when connected, produces
34 m3/h (QDE) of demineralized water (recovery ratio of 75%), in each line, consuming around 38 kW (PHP2) per line (approximately 1 kWh/m3 of
demineralized water produced).
To validate the proposed control system,
meteorological data at the target location was used, and previously derived production models for power and water were used [7, 13, 14].
V. RESULTS AND DISCUSSION
Some preliminary results for 20 days of operation are shown in Figures 5 to 13. The evaluation over 20 days confirms the correct operation of the control system for the parameters considered in the previous sections. As can be seen in Figure 5, the value of the power consumed by the system is lower than the available power. Figure 6 depicts the amount of DEMI water that is consumed in the electrolysis process. Figure 7 shows the pretreatment level tank.
Figure 8 shows the osmotized level tank. Figure 9 shows the DEMI water tank. In all cases, the levels are between the minimum and maximum defined to maintain them within a safety range. Figure 10 depicts the operation of the SWP. SWP is not
switched on/off very frequently (the exact value can be seen in Table 1). Figures 11 and 12 show the operation of the first and second Reverse Osmosis stages, respectively. As in the previous figure, the performance of both stages of the Reverse Osmosis process can be considered correct. Figure 13 gives a zoom of the simulation results during 3 days of operation of all the figures explained above.
Finally, Table 1 summarizes the total parameters and
consumption for the summer results. This
corresponds to a mean production of 32.39 m3/h of water for the electrolysis, consuming a mean power of 219.79 kW.
HP2B
38Kw
DEMI Water Tank BT2
(58 m3
)
RO1A
RO1B
RO2A
RO2B
SeawaterIntake
Pretreatment Tank SWT (58m3)
Osmotised Water Tank BT1
(58 m3
)
256 m3/h54000 TDS 155kW
HP1A
HP1B
155kW
34 m3/h 3 TDS
34 m3/h 3 TDS
HP2A
38Kw
94 m3/h 57 m3/h
368 TDS
57 m3/h 368 TDS
Osmotized
Water (1
stStage)
DEMI Water
(2
ndStage)
20 m3/h 368 TDS
68 m3/h 3 TDS
Brin
e
141 m3/h 91000 TDS
Brin
e
26 m3/h 570 TDS
Figure 4: Case Study
SWP
Table 1. Parameters and consumptions
Mean Power Available (kW)
Mean Power Consumed
(kW) DEMI Water (m
3/h) Osmotised Water (m3/h)
271.66 219.79 32.39 55.71
Sea Water Pump ON/OFF (times/day)
1st Reverse Osmosis Stage
ON/OFF (times/day)
2nd Reverse Osmosis Stage
ON/OFF (times/day)
5.8 6.2 14.6
Figure 5 Power available and consumed by the desalination unit
Figure 6 Demineralized (DEMI) water
Figure 7 Pretreatment Tank level (winter)
Figure 8 Osmotized Tank level (winter)
0 2 4 6 8 10 12 14 16 18 20
0 100 200 300 400 500 600
Time(days)
Power (kW) Consumed
Available
0 1 2 3 4 5 6 7 8 9 10 11 12 13 14 15 16 17 18 19 20
0 10 20 30 40 50 60 70
Time (days) DEMI Water (m3/h)
Tank level (m)
0 2 4 6 8 10 12 14 16 18 20
0 0.2 0.4 0.6 0.8 1
Time (days)
0 2 4 6 8 10 12 14 16 18 20
0 0.2 0.4 0.6 0.8 1
Figure 9 DEMI Tank level (winter)
Figure 10 Operation of the seawater pump (SWP)
Figure 11 Operation of the first stage of the desalination unit (RO1A + RO1B)
Figure 12 Operation of the second stage of the desalination unit (RO2A + RO2B)
0 2 4 6 8 10 12 14 16 18 20
0 0.2 0.4 0.6 0.8 1
Time (days)
500
Tank level (m)
0 2 4 6 8 10 12 14 16 18 20
OFF ON
Time (days)
0 2 4 6 8 10 12 14 16 18 20
OFF 1 ON 2 ON
Time (days)
0 2 4 6 8 10 12 14 16 18 20
OFF 1 ON 2 ON
Figure 13 Zoom. From up to down and left to right: Power available and consumed by the desalination unit, water flow to electrolyzers, pretreatment, osmotized and DEMI tank level, operation of the SWP, first and second stage of the desalination unit.
VI. CONCLUSION
This work has discussed the problem of operating reverse osmosis (RO) plants under variable power
availability conditions, which is a problem
encountered when local green energy sources are used in off-grid locations. A rule-based control strategy has been designed based on giving preference, at each sample time, to the operation of the high pressure (HP) pumps of the RO plant that require action to avoid the occurrence of not fulfilling the water demand. The tanks make it possible to dampen variations in production as long as they have enough water stored; so a central aspect of the control system is the use of the information from the measured tank levels.
The proposed controller was evaluated for a specific RO plant, powered by wind and wave energies that produce demineralized water. Simulation results are provided to depict the correct operation of the plant with the designed controller. It must be pointed out that the proposed estimation is based on lines that
operate at a fixed working point. However, current technical advances in the integration of frequency variators in HP pumps would enable some more adequate applications to operate the lines at variable set points: the adaptation of the proposed rule-based control strategy to these alternative installations would be the aim of future work. Finally, it is planned to include information on predicted energy availability and water demand.
REFERENCES
[1] Rodriguez, L.G. (2002) Seawater Desalination Driven by Renewable Energies: A Review Desalination, 143:pp.103–113.
[2] Mathioulakis, E., Belessiotis, V. and Delyannis, E. (2007) Desalination by Using Alternative
Energy: Review and State-of-the-Art,
Desalination. 203:pp.346–365.
5 6 7 8
OFF 1 ON 2 ON
Time (days)
5 6 7 8
OFF 1 ON 2 ON
Time (days)
5 6 7 8
OFF ON
Time (days)
5 6 7 8
0 0.2 0.4 0.6 0.8 1
Time (days) 05 6 7 8
0.2 0.4 0.6 0.8 1
Time (days) 5 6 7 8
0 0.2 0.4 0.6 0.8 1
Time (days)
5 6 7 8
0 10 20 30 40 50 60 70
Time (days)
5 6 7 8
0 100 200 300 400 500 600
Time (days)
DEMI Water (m3/h) Power (kW)
Tank level (m)
[3] Fritzmann, C. Lowenberg, J. Wintgens, T. and Melin, T. (2007) State-of-the-Art of Reverse Osmosis Desalination, Desalination, 216:pp.1– 76.
[4] Penate, B. and Rodriguez, L. G, (2012) Current Trends and Future Prospects in the Design of
Seawater Reverse Osmosis Desalination
Technology, Desalination, 284:pp.1–8.
[5] Wong, M. C., Martinez, K. G., Ramon, Z. and Hoek, E. M. V. (2012) Impacts of Operating Conditions and Solution Chemistry on Osmotic
Membrane Structure and Performance.
Desalination, 287:pp. 340–349.
[6] Lopes, J.A., Moreira C. L. and Madureira, A. G. (2006) Defining Control Strategies for Microgrids Islanded Operation. IEEE Transactions on Power Systems, 21(2), pp.916-924.
[7] Vandoorn, T. L., Renders B., Degroote, L., Meersman, B. and Vandevelde, L. (2011) Active Load Control in Islanded Microgrids Based on the Grid Voltage. IEEE Transactions on Smart Grid, 2(1), pp.139-151.
[8] Seibert, U., Vogt, G., Brenning, C., Gebhard, R. and Holz, F. (2004) Autonomous, Desalination System Concepts for Seawater and Brackish Water in Rural Areas with Renewable Energies. Desalination, vol. 168, pp. 29-37.
[9] Tadeo, F., Palacin, L. G., Salazar J. and de Prada C., (2011) Desalination in Remote Areas: A Prediction-Based Approach, in Proc. IDA World Congress, Perth, Australia.
[10] Robertson, M. W., Watters, J. C., Desphande P. B., Assef, J. Z , Alatiqi, I. M. (1996) Model Based Control for Reverse Osmosis Desalination Processes. Desalination, 104:pp.59–68.
[11] Gambier, A. and Badreddin, E. (2003)
Application of Hybrid Modeling and Control Techniques to Desalination Plants. Desalination, 152:pp.175–184.
[12] McFall, C., Bartman, A., Christofides, P. and Cohen, Y. (2008) Control and Monitoring of a High-Recovery Reverse-Osmosis Desalination Process. Industrial & Engineering Chemistry Research, 47:pp.6698–6710.
[13] Palacin, L., Tadeo, F., de Prada, C., Elfil, H. and Salazar, J. (2011) Operation of Desalination Plants Using Hybrid Control, Desalination and Water Treatment. Vol. 25, pp. 119-126.
[14] Serna, A. and Tadeo, F. (2013) Offshore Desalination Using Wave Energy, Advances in Mechanical Engineering vol., Article ID 539857, 8 pages.
[15] Jalil, N., Kheir, N.A. and Salman, M. (1997) A Rule-Based Energy Management Strategy for a
Series Hybrid Vehicle, American Control
Conference, 1997. Proceedings of the 1997 (Vol. 1, pp. 689-693). IEEE.
[16] Drees, K.H, and Braun. J.E. (1996)