TítuloDevelopment and calibration of a new dripper based rainfall simulator for large scale sediment wash off studies
15
0
0
Texto completo
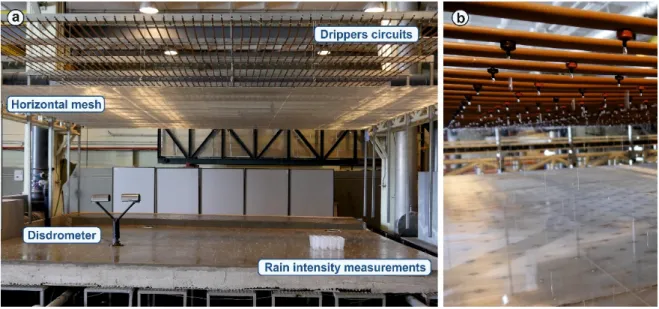
(2) Water 2020, 12, 152. 2 of 15. rainfall, and are often used in laboratory and field studies [10–13] to increase the understanding of pollutant wash-off processes in urban catchments. The use of rainfall simulators with suitable rain uniformity and with drop size and velocity distributions similar to real rain is crucial for the reliability and transferability of experimental results. However, the difficulties in replicating natural rain lead to a wide range of designs, these falling into two main groups in terms of the way in which the raindrops are produced: (i) pressurized nozzle simulators, and (ii) drop-forming simulators, with no definitive solution having been identified [14,15]. Both typologies have been used not only in wash-off studies but also in soil erosion studies, and both present benefits and drawbacks that must be considered during experimental design, in light of the objectives of a particular study. Moreover, the variety of designs makes the measurement of rain properties such as uniformity, intensity, and raindrop size and velocity distribution essential to ensure the comparability of experimental results. Pressurized nozzle simulators are commonly preferred for studies with simulated rainfall due to their simple design and installation. Generated raindrops emerge from nozzles with a considerable initial velocity, so this typology produces satisfactory raindrop velocity distributions at lower fall heights, reaching terminal drop velocities as in natural rain. A disadvantage here is that nozzles require a relatively large orifice to generate a mean raindrop similar to real rain, and this results in a high intensity storm if the nozzle sprays continuously [16]. An oscillating bar [17–20] or a solenoid-controlled simulator [21] can be used to pause the spray and hence reduce the rainfall intensity. However, Armstrong and Quinton [22] examined the effect of intermittent rain in runoff sediment concentrations, concluding that results can be affected. When the spray stops, water depths decrease over the street surface and the sediments are more exposed to the next period of high intensity rain, causing a greater detachment of soil particles. These nozzle-based designs can generate rainfalls with suitable spatial uniformity in small-scale catchments, which is the case in most studies carried out to date [5,11–13,23] covering areas smaller than 10 m2 . However, the use of several nozzles to cover larger areas makes it difficult to maintain spatial uniformity [24]. In addition, as seen in Naves et al. [25] where four nozzles were used to simulate rain in a 36 m2 physical model, non-uniform rain significantly affects the mobilization of sediment particles through these large-scale catchments, thus compromising the reliability of wash-off results. As an alternative, drop-forming simulators have been seen to result in a better control of physical rain parameters than nozzle simulators [26–29]. The spatial uniformity of simulated rain benefits from the use of these kinds of simulators, because of the increase in the number of points where drops are generated, but the complex assembly of existing drop-forming simulators, which use needles to generate raindrops, have also limited their application to small-scale studies of a few square meters. This study focuses on the development of a new drop-forming rainfall simulator to study wash-off and sediment transport processes in the 36 m2 urban drainage physical model presented in Naves et al. [25]. The proposed rainfall simulator uses pressure-compensating irrigation drippers to simplify the generation of raindrops, being capable of covering large areas and maintaining the appropriate spatial uniformity associated with drop-forming simulators. In the remainder of the article, the calibration of this rainfall simulator will be presented, looking at spatial uniformities and size distributions of the raindrops generated. Then, the rain properties of the definitive solution are characterized in detail and compared with local rain measurements. 2. Materials and Methods 2.1. Rainfall Simulator Description The rainfall simulator that has been developed is located in the Hydraulic Laboratory of the Centre of Technological Innovation in Construction and Civil Engineering (CITEEC) at the University of A Coruña. It consist of two hose circuits placed above an urban drainage physical model with an approximate surface of 36 m2 . PCJ-CNL drippers (Netafim, Tel Aviv, Israel) of 1.2 and 2 L/h are.
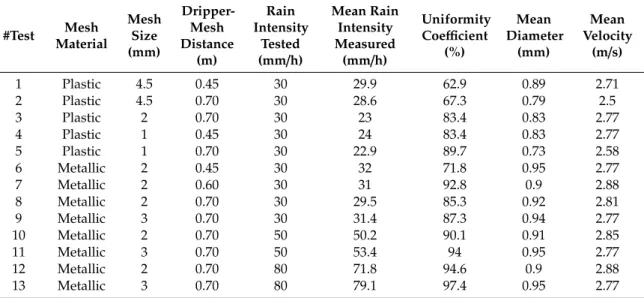
(3) Water 2020, 12, 152. 3 of 15. Water 2020,in12,each x FOR PEER REVIEW 3 of of 15 inserted circuit forming two grids of drippers with longitudinal and transversal separation 0.20 m. Using this layout, the density of drippers in each circuit is 25 per m2 . Therefore, the simulator is able able to to generate generate rain rain intensities intensities of of 30 30 mm/h, mm/h, 50 50 mm/h mm/h and, and, if if both both circuits circuits are are working working at at the the same same is time, 80 mm/h. Pressure-compensating and anti-drain drippers have been chosen to avoid changes time, 80 mm/h. Pressure-compensating and anti-drain drippers have been chosen to avoid changes in in flow rates to pressure variations and to avoid once the pressure is decreased flow rates duedue to pressure variations and to avoid waterwater losseslosses once the pressure is decreased below below a certain value. The generated raindrops always fall on the same point of the model surface a certain value. The generated raindrops always fall on the same point of the model surface and and have an approximate diameter 4 mm, which is very high comparedtotonatural naturalrain. rain. To To fix fix this this have an approximate diameter of 4ofmm, which is very high compared problem, a horizontal mesh is installed bellow the dripper circuits in order to break and distribute problem, a horizontal mesh is installed bellow the dripper circuits in order to break and distribute these uniform uniform drops, drops, improving improving rain rain uniformity uniformity and these and achieving achieving heterogeneous heterogeneous drop drop size size distribution. distribution. Figure 11 shows shows aa general general view view of of the the simulator simulator in in its its final final configuration, configuration, and and aa detail detail of of the the drippers drippers Figure inserted in the circuits. inserted in the circuits.. Figure (a) General General image image of of the the rainfall rainfall simulator simulator in in its its final final configuration configuration above above the urban drainage Figure 1. 1. (a) the urban drainage physical and vessels physical model. model. Disdrometer Disdrometer and vessels for for measuring measuring rain rain intensity intensity are are also also shown. shown. (b) (b) Detail Detail of of both both types types of of drippers drippers inserted inserted in in the the circuits circuits above above the the horizontal horizontalmesh. mesh.. 2.2. Calibration Procedure 2.2. Calibration Procedure Rain intensity, spatial uniformity, and the kinetic energy of raindrops, which depends on their size Rain intensity, spatial uniformity, and the kinetic energy of raindrops, which depends on their and velocity, are the key rain variables that affect the wash-off process in the detachment of particles. size and velocity, are the key rain variables that affect the wash-off process in the detachment of Therefore, these variables were considered during the calibration process in a comparison with natural particles. Therefore, these variables were considered during the calibration process in a comparison rain. First, as seen in Naves et al. [25], non-uniform simulated rain can modify surface sediment with natural rain. First, as seen in Naves et al. [25], non-uniform simulated rain can modify surface transport and lead to unreliable results in wash-off experiments. Therefore, the main objective during sediment transport and lead to unreliable results in wash-off experiments. Therefore, the main the calibration of this new rainfall simulator was to achieve a high rain spatial uniformity across the objective during the calibration of this new rainfall simulator was to achieve a high rain spatial entire physical model surface, as occurs with natural rain [15]. In addition, a realistic raindrop size uniformity across the entire physical model surface, as occurs with natural rain [15]. In addition, a distribution was also sought during the calibration process. Finally, the rainfall generator was installed realistic raindrop size distribution was also sought during the calibration process. Finally, the rainfall and fixed as high as possible, approximately 2.6 m from the model surface, to allow larger raindrops to generator was installed and fixed as high as possible, approximately 2.6 m from the model surface, achieve their terminal velocity. to allow larger raindrops to achieve their terminal velocity. The calibration focused on establishing the optimal typology and position of the horizontal mesh The calibration focused on establishing the optimal typology and position of the horizontal mesh that breaks and distributes generated raindrops. Rain intensity, spatial uniformity, and mean drop that breaks and distributes generated raindrops. Rain intensity, spatial uniformity, and mean drop size and velocity were analyzed for nine different combinations of mesh size, material, and distance size and velocity were analyzed for nine different combinations of mesh size, material, and distance to drippers in order to simulate rainfall with a high spatial uniformity and realistic raindrop size to drippers in order to simulate rainfall with a high spatial uniformity and realistic raindrop size distribution. In these tests, rain intensity was set firstly at the lowest rain intensity that it is possible to distribution. In these tests, rain intensity was set firstly at the lowest rain intensity that it is possible generate (30 mm/h), since this is expected to be the most demanding case in terms of rain uniformity. to generate (30 mm/h), since this is expected to be the most demanding case in terms of rain Then, configurations with better performance were also analyzed for the rain intensities 50 and 80 mm/h. uniformity. Then, configurations with better performance were also analyzed for the rain intensities The typologies and ranges tested during the calibration process are summarized in Table 1. 50 and 80 mm/h. The typologies and ranges tested during the calibration process are summarized in Table 1..
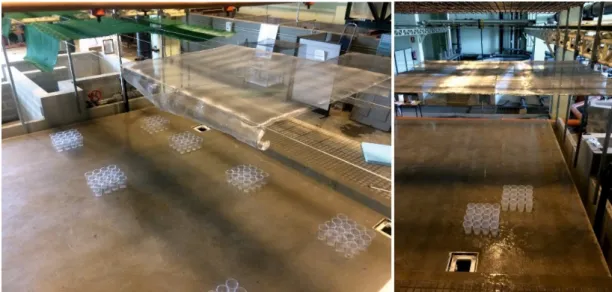
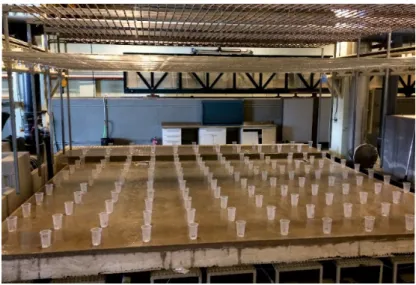
(4) Plastic and metal. 1–4.5. 0.45–0.70. 30–80. Rain intensity and uniformity were measured in each case using 16 vessels of 0.1 m in diameter as rain gauges, disposed together in a 4 × 4 grid covering a total surface area of 0.16 m2 (Figure 2). Rain intensity was obtained from the water mass collected by each vessel during a 15 min period of Water 2020, 12, 152 4 of 15 rain, and the result was then used to determine the Christiansen’s uniformity coefficients (UC) [30] as: Table 1. Typologies and ranges considered during ∑ |𝑥̅ −rainfall 𝑥 | simulator calibration.. 𝑈𝐶 = 100 1 −. Mesh Materials. Mesh Size (mm). 𝑛𝑥̅ (m) Dripper-Mesh Distance. Rain Intensity Tested (mm/h). (1). Plastic metal 1–4.5 0.45–0.70 30–80 of vessels. is the rain intensity in each vessel, 𝑥̅ their average, and 𝑛 the total number where 𝑥 and 2 A laser Parsivel disdrometer (OTT HydroMet, Kempten, Germany) was used during calibration (Figure 1a) to measure the mean diameter and velocity raindrops. This equipment Rain intensity and uniformity were measured in eachof case using 16 vessels of 0.1 m inprovides diameterthe as 2 and classify 2 number of raindrops that pass through a horizontal laser surface of approximately 54 cm rain gauges, disposed together in a 4 × 4 grid covering a total surface area of 0.16 m (Figure 2). Rain them intowas 32 obtained diametersfrom andthe 32 water velocity non-uniform measuring the intensity mass collected byranges each vessel duringthe a 15magnitude min periodand of rain, duration of signal attenuations [31]. In view of the wide variability of natural rain found in the and the result was then used to determine the Christiansen’s uniformity coefficients (UC) [30] as: literature [32–36], with mean raindrop diameters from 0.63 to 2.49 mm, raindrop size and velocity P ! xi | distributions of local natural rain were also measured n1as|xa−means of establishing reference values for UC = 100 1 − (1) the comparison of the different configurations tested during calibration. For this, the disdrometer nx was installed in February 2017 on the roof of the laboratory of CITEEC (A Coruña, Spain) with a where intensity i is the rainof samplexfrequency 10 s. in each vessel, x their average, and n the total number of vessels.. Figure 2. 2. Vessels Vesselsdisposed disposed over model surface to measure rain intensity and uniformity for over thethe model surface to measure rain intensity and uniformity for different different mesh and distances to during drippers during calibration. mesh types andtypes distances to drippers calibration. 2. A laser Parsivel disdrometer (OTTSimulator HydroMet, Kempten, Germany) was used during calibration 2.3. Rain Properties of Calibrated Rainfall (Figure 1a) to measure the mean diameter and velocity of raindrops. This equipment provides the Once the simulator had been calibrated, rain intensity, spatial uniformity, and raindrop size and number of raindrops that pass through a horizontal laser surface of approximately 54 cm2 and classify velocity distribution were measured for the three rain intensities that it is able to generate. In a way them into 32 diameters and 32 velocity non-uniform ranges measuring the magnitude and the duration similar to the calibration methodology, rain intensity and uniformity were obtained from the water of signal attenuations [31]. In view of the wide variability of natural rain found in the literature [32–36], collected in 144 vessels placed over the full physical model surface in a 0.5 m × 0.5 m grid for a 5 min with mean raindrop diameters from 0.63 to 2.49 mm, raindrop size and velocity distributions of local period of rain (Figure 3). Finally, disdrometer measurements were used to register 10 s measurements natural rain were also measured as a means of establishing reference values for the comparison of the of raindrop size and velocity distributions over 2 min. different configurations tested during calibration. For this, the disdrometer was installed in February 2017 on the roof of the laboratory of CITEEC (A Coruña, Spain) with a sample frequency of 10 s. 2.3. Rain Properties of Calibrated Rainfall Simulator Once the simulator had been calibrated, rain intensity, spatial uniformity, and raindrop size and velocity distribution were measured for the three rain intensities that it is able to generate. In a way similar to the calibration methodology, rain intensity and uniformity were obtained from the water collected in 144 vessels placed over the full physical model surface in a 0.5 m × 0.5 m grid for a 5 min period of rain (Figure 3). Finally, disdrometer measurements were used to register 10 s measurements of raindrop size and velocity distributions over 2 min..
(5) Water 2020, 12, 152 Water 2020, 12, x FOR PEER REVIEW Water 2020, 12, x FOR PEER REVIEW. 5 of 15 5 of 15 5 of 15. Figure 3. Vessels disposed disposed over over the the entire entire model model surface surface in in aa 0.5 0.5 m 0.5 m m grid grid to to measure Figure 3. Vessels m× × 0.5 measure rain rain Figure 3. Vessels disposed over the entire model surface in a 0.5 m × 0.5 m grid to measure rain intensity and uniformity. intensity and uniformity. intensity and uniformity.. 3. Results 3. 3. Results Results 3.1. Local Natural Rain Properties Recorded 3.1. Local 3.1. LocalNatural NaturalRain RainProperties Properties Recorded Recorded Firstly, local rain properties registered by the disdrometer are presented here to be used as reference Firstly, local properties registered bytested the disdrometer disdrometer arepresented presented used as Firstly, localrain raindifferent properties registered by the are to to be be asthe values to compare the configurations during calibration. Plotshere inhere Figure 4used show reference values to compare the different configurations tested during calibration. Plots in Figure 4 reference values to compare the different configurations tested during calibration. Plots in Figure 4 mean raindrop diameters and velocities measured according to their rain intensities. The results show show the mean raindrop diameters and velocities measured according to their rain intensities. The show theraindrop mean raindrop diameters velocities measured according The that mean diameters registered were between 0.75 and 1.3 mmtointheir the rain case intensities. of rain intensities results show that mean raindrop diameters registered were between 0.75 and 1.3 mm in the case results show that mean raindrop diameters registered were between 0.75 and 1.3 mm in the case of of over 20 mm/h, which are within the ranges found in the literature [32–36]. In addition, mean raindrop rain intensities over 20 mm/h, which within the ranges found in the literature [32–36]. In addition, rain intensities over 20 mm/h, which are within the ranges found in the literature [32–36]. In addition, velocities match the corresponding terminal velocities of the measured raindrop diameters. This can mean raindropvelocities velocities match match the the corresponding corresponding terminal of the raindrop mean terminalvelocities velocities themeasured measured raindrop also beraindrop observed in the raindrop size and velocity distributions shown inof Figure 5, which shows the diameters. This can also be observed in the raindrop size and velocity distributions shown in Figure diameters. This can also be observed in the raindrop size and velocity distributions shown in mean of 33 disdrometer measurements of natural rainfall with intensities ranging from 25 to 35 Figure mm/h, 5, which showsthe themean meanof of 33disdrometer disdrometer measurements ofofnatural rainfall with intensities ranging 5, which shows measurements natural with intensities ranging 8 measurements between 45 33 and 55 mm/h, and one measurement of 77rainfall mm/h, respectively. These plots from 25 to 35 mm/h, 8 measurements between 45 and 55 mm/h, and one measurement of 77 mm/h, from 25 to 35 mm/h, 8 measurements between 45 and 55 mm/h, and one measurement of 77 mm/h, represent the mean number of raindrops registered in 10 s, classified into sizes and velocities and respectively.These Theseplots plotsrepresent represent the the mean mean number of registered inin 1010 s, classified into respectively. number ofraindrops raindrops registered s, classified compared with the experimental relation between diameter and terminal velocity [37]. It can alsointo be sizes and velocities and compared with the experimental relation between diameter and terminal sizes and velocities and compared with the experimental relation between diameter 4and terminal noted that, as reported in Tokay et al. [38], the maximum drop diameter rarely exceeded mm, even velocity [37]. It can also be noted that, as reported in Tokay et al. [38], the maximum drop diameter in velocity [37]. Itwith can an also be notedpresence that, as reported in Tokay et al. [38],very the few maximum drop diameter heavy of large In addition, raindrops larger than rarelyrainfall exceeded 4 mm,increased even in heavy rainfall with drops. an increased presence of large drops. In addition, rarely exceeded 4 mm, even in heavy rainfall with an increased presence of large drops. In addition, 3 mm were measured in the three cases presented. These characteristics, considering a mean raindrop very few raindrops larger than 3 mm were measured in the three cases presented. These very fewofraindrops than 3 mm were in the three cases presented. These diameter 1 mm andlarger a mean velocity of 3.4 m/s, measured are established values characteristics, considering a mean raindrop diameter of 1 mm andasaobjective mean velocity of for 3.4 the m/s,rainfall are characteristics, considering a mean raindrop diameter of 1 mm and a mean velocity of 3.4 m/s, are simulator under study here. established as objective values for the rainfall simulator under study here. established as objective values for the rainfall simulator under study here.. Figure 4.4.Relation diameter and andvelocity velocitywith withrespect respect the rain intensity measured Figure Relationof ofraindrop raindrop mean diameter toto the rain intensity measured byby the disdrometer. the disdrometer. Figure 4. Relation of raindrop mean diameter and velocity with respect to the rain intensity measured by the disdrometer..
(6) Water2020, 2020,12, 12,152 x FOR PEER REVIEW Water. 6 6ofof15 15. Figure5.5. Raindrop Raindrop size and rainfalls with intensities ranging from 25 Figure and velocity velocitydistribution distributionofofnatural natural rainfalls with intensities ranging from toto3535mm/h 25 mm/h(33 (33measurements), measurements),4545toto5555mm/h mm/h(8(8measurements) measurements)and anda ameasurement measurementofof7777mm/h, mm/h, respectively.The Themean meanofofthe theraindrops raindropsregistered registeredby bythe thedisdrometer disdrometerclassified classifiedininsizes sizesand andvelocities velocitiesis respectively. is compared experimental relation between diameter and terminal velocity which is compared withwith experimental relation between diameter and terminal velocity [37], which[37], is represented represented by theand solid its 25%by of the variation the dotted curves. by the solid curve its curve 25% ofand variation dottedby curves.. 3.2. 3.2.Calibration CalibrationResults Results InInthis configurations tested tested during duringthe the thissection, section,the the rain rain properties properties obtained obtained for for the the different different configurations calibration process are shown. Table 2 includes mean rain intensities, uniformity coefficients, mean calibration process are shown. Table 2 includes mean rain intensities, uniformity coefficients, mean raindrop different configurations configurations tested. tested. In Inthe thefirst first raindropdiameters, diameters,and andmean meanvelocities velocities measured measured for for the the different set of configurations using plastic mesh, it can be seen that larger mesh sizes of 4.5 mm (tests #1 and #2) set of configurations using plastic mesh, it can be seen that larger mesh sizes of 4.5 mm (tests #1 and produced uniformity coefficients of around 65% and raindrop sizes of around 0.85 mm, #2) produced uniformity coefficients of around 65%mean and mean raindrop sizes of around 0.85which mm, iswhich slightly lower than that observed in natural rain, forrain, mesh-drippers distances of 0.45of and 0.70 m. is slightly lower than that observed in natural for mesh-drippers distances 0.45 and In0.70 thism. case, the mesh size is similar to the diameter of the raindrops and a small distribution area In this case, the mesh size is similar to the diameter of the raindrops and a small distributionis observed when raindrops pass through the mesh break, uniformity. area is observed when raindrops pass through theand mesh anddecreasing break, decreasing uniformity. Table simulator calibration. calibration. Table2.2.Configurations Configurationsand andresults results of of the the tests tests performed performed during the rainfall simulator. DripperRain Mean DripperRain MeanRain Rain Mesh Uniformity Mean Mean Uniformity Mean Mean Mesh Mesh Mesh Intensity Intensity Mesh Intensity Intensity Mesh #Test Size Coefficient Diameter Diameter Velocity Velocity Coefficient #Test Size Material Distance Tested Measured Tested Measured Material (mm) Distance (%) (mm) (m/s) (%) (mm) (m/s) (mm) (m) (mm/h) (mm/h) (m) (mm/h) (mm/h) Plastic 4.5 0.45 30 29.9 62.9 0.89 2.71 11 Plastic 4.5 0.45 30 29.9 62.9 0.89 2.71 2 Plastic 4.5 0.70 30 28.6 67.3 0.79 2.5 2 Plastic 4.5 0.70 30 28.6 67.3 0.79 2.5 3 Plastic 2 0.70 30 23 83.4 0.83 2.77 34 Plastic 2 0.70 30 23 83.4 0.83 2.77 Plastic 1 0.45 30 24 83.4 0.83 2.77 45 Plastic 11 0.45 30 24 83.4 0.83 2.77 Plastic 0.70 30 22.9 89.7 0.73 2.58 Metallic 0.45 30 32 71.8 0.95 2.77 56 Plastic 12 0.70 30 22.9 89.7 0.73 2.58 7 Metallic 2 0.60 30 31 92.8 0.9 2.88 6 Metallic 2 0.45 30 32 71.8 0.95 2.77 8 Metallic 2 0.70 30 29.5 85.3 0.92 2.81 7 Metallic 2 0.60 30 31 92.8 0.9 2.88 9 Metallic 3 0.70 30 31.4 87.3 0.94 2.77 8 Metallic 2 0.70 30 29.5 85.3 0.92 2.81 10 Metallic 2 0.70 50 50.2 90.1 0.91 2.85 9 Metallic 33 0.70 30 31.4 87.3 0.94 2.77 11 Metallic 0.70 50 53.4 94 0.95 2.77 10 Metallic 22 0.70 50 50.2 90.1 0.91 2.85 12 Metallic 0.70 80 71.8 94.6 0.9 2.88 13 Metallic 0.70 80 79.1 97.4 0.95 2.77 11 Metallic 33 0.70 50 53.4 94 0.95 2.77 12 Metallic 2 0.70 80 71.8 94.6 0.9 2.88 13If theMetallic 3 0.70 80 79.1 97.4 0.95 2.77 mesh size is reduced (tests #3–#5 with 2 and 1 mm mesh sizes), mean raindrop sizes. decrease but raindrops are distributed in a larger area by the mesh and the uniformity coefficient is If the mesh size to is over reduced #3–#5 with 2 and mesh that sizes), mean raindrop sizes significantly increased 83%.(tests In these tests, it can also1bemm observed increasing dripper-mesh decrease but raindrops are distributed in a larger area by the mesh and the uniformity coefficient is distance improves rain uniformity, but also leads to smaller diameters and lower velocities of raindrops. significantly increased to over 83%. In these tests, it can also be observed that increasing dripperSummarizing, the results obtained from tests with plastic meshes (tests #1–#5) showed that it is.
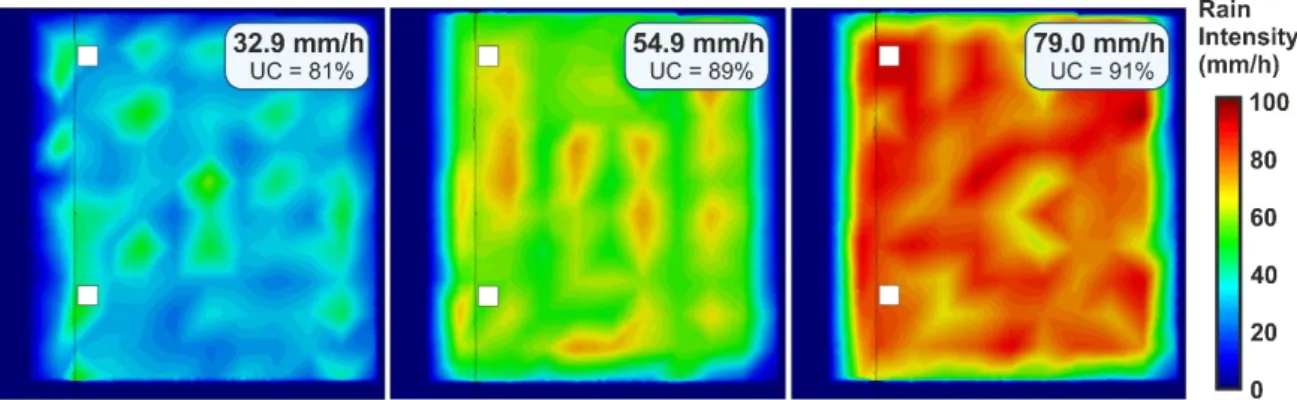
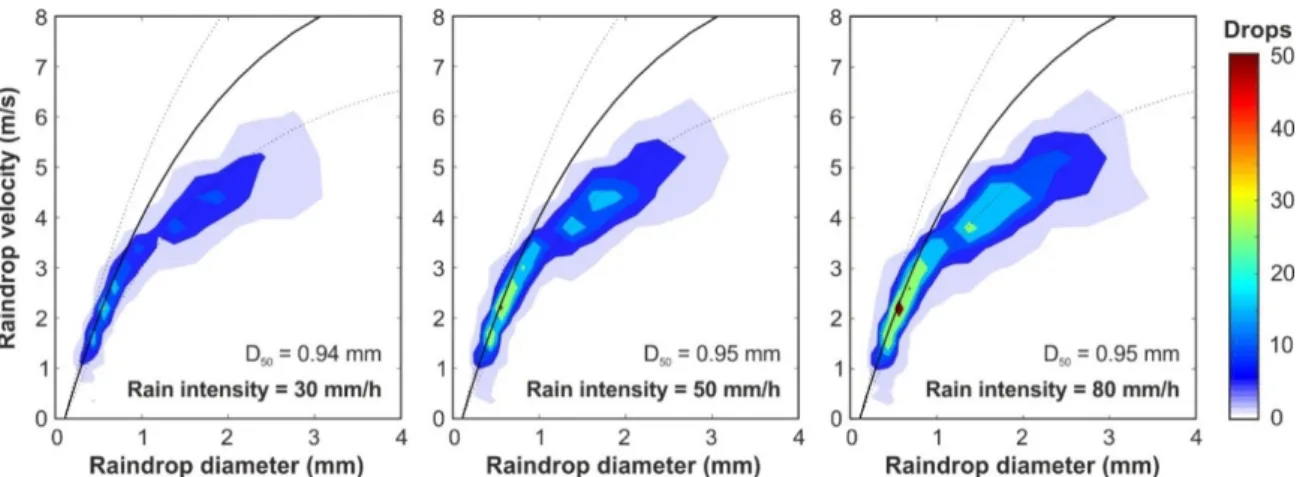
(7) Water 2020, 12, x FOR PEER REVIEW. Water 2020, 12, 152. 7 of 15. 7 of 15. mesh distance improves rain uniformity, but also leads to smaller diameters and lower velocities of raindrops. Summarizing, the results obtained from tests with plastic meshes (tests #1–#5) showed that it is necessary to decrease and increase dripper-mesh to improve necessary to decrease mesh-sizemesh-size and increase dripper-mesh distancedistance in orderintoorder improve rainfall rainfall uniformity, but maintaining an equilibrium without reducing mean raindrop and uniformity, but maintaining an equilibrium without reducing mean raindrop sizes and sizes velocities. velocities. Since it was that observed that measured rain intensities in the case of more Since it was observed measured mean rainmean intensities decreasesdecreases in the case of more suitable suitable solutions formeshes plastic meshes (tests #3–#5), to the fact that the coarse solutions for plastic (tests #3–#5), perhapsperhaps due to due the fact that the coarse mesh mesh plasticplastic wires wires water retain easily, water easily, metallic wereinused in the following to this avoid this issue. retain metallic meshesmeshes were used the following tests totests avoid issue. In tests tests #6–#8, #6–#8, aa22mm mmmetallic metallicmesh meshwas wasused usedtotoassess assessthe theinfluence influenceofofdripper–mesh dripper–mesh distance In distance in in the results with values of 0.45, 0.60 and 0.70 respectively. These tests illustrated importance the results with values of 0.45, 0.60 and 0.70 m,m, respectively. These tests illustrated thethe importance of of ensuring that there enough distancebetween betweenthe themesh meshand andthe thedripper dripper grids to allow ensuring that there is is enough distance allow raindrops raindrops to reach reach aa higher higher velocity velocity before the impact against the mesh, achieving to achieving aa larger larger distribution distributionarea areaof of raindrops and and improving improving rain uniformity above 85%. In raindrops In view view of of the the solid solid performance performance of of tests tests in in whichthe the mesh mesh was was placed placed 0.60 and 0.70 m from the drippers, and also which also the the simpler simpler installation installationof ofthe the second option, option, the distance of 0.70 m was selected to compare second compare the the 22 mm mm metallic metallic mesh meshwith withaa33mm mm mesh for for the the three three intensities intensities that that the the simulator simulator is is able able to to generate generate (tests (tests #9–#13). #9–#13). The mesh The possibility possibilityof of increasing mean raindrop size to the reference value was thus assessed, achieving a slightly better increasing mean raindrop size to the reference value was thus assessed, achieving a slightly better behavior for for the the 33 mm mm mesh mesh in in terms terms of behavior of rain rain uniformity uniformity and and mean mean drop drop size. size. Greater Greatermesh meshsizes sizeswere were not considered because, as seen in tests #1 and #2, uniformity is significantly reduced for mesh sizes not considered because, as seen in tests #1 and #2, uniformity is significantly reduced for mesh sizes over 44mm. mm.Therefore, Therefore,the the33mm mmmetallic metallicmesh meshinstalled installed 0.70 below drippers was selected as over 0.70 mm below thethe drippers was selected as the the optimal solution. optimal solution. 3.3. Measured Rain Properties of the Developed Rainfall Simulator 3.3. Rain intensity, intensity, uniformity, uniformity, and and raindrop raindrop size size and velocity distributions Rain distributions were were measured measured with withthe the configuration resulting from the calibration, and configuration and for for the the three three rain rain intensities intensities that that itit was was possible possibleto to generate. Figure 6 shows rain intensity generate. intensity maps maps and and the the uniformity uniformity coefficients, coefficients,with withvalues valuesover over81%, 81%, whichmeans meansalmost almostuniform uniformrain rain and a very significant improvement in uniformity compared to which and a very significant improvement in uniformity compared to most most mediumand large-scale rainfall simulators in the literature. medium- and large-scale rainfall simulators in the literature.. Figure 6. Rain intensity map of the physical model surface, which has an approximate area of 36 m22 , Figure 6. Rain intensity map of the physical model surface, which has an approximate area of 36 m , for the three intensities that the rainfall simulator is able to generate. Plots include the mean rainfall for the three intensities that the rainfall simulator is able to generate. Plots include the mean rainfall intensity measured and the Christiansen’s uniformity coefficient (UC) resulted. intensity measured and the Christiansen’s uniformity coefficient (UC) resulted.. The mean number of raindrops detected by the disdrometer in 10 s measurements over 2 min, The mean number of raindrops detected by the disdrometer in 10 s measurements over 2 min, classified in sizes and velocities for the three rain intensities, are presented in Figure 7. The mean classified in sizes and velocities for the three rain intensities, are presented in Figure 7. The mean raindrop sizes obtained over 0.94 mm and the heterogeneous distributions of sizes up to 3 mm are raindrop sizes obtained over 0.94 mm and the heterogeneous distributions of sizes up to 3 mm are very close to those established as the objective from natural rain measurements with a mean raindrop very close to those established as the objective from natural rain measurements with a mean raindrop size of 1 mm (Figure 5). Regarding velocity distributions, larger raindrops (around 2 mm) develop size of 1 mm (Figure 5). Regarding velocity distributions, larger raindrops (around 2 mm) develop slightly lower velocities than the corresponding terminal velocity, which are represented by the solid slightly lower velocities than the corresponding terminal velocity, which are represented by the solid curve in Figure 7, which is in accordance with Gunn and Kinzer [37]. In the following section, a more curve in Figure 7, which is in accordance with Gunn and Kinzer [37]. In the following section, a more detailed comparison between simulated and natural rain is made. detailed comparison between simulated and natural rain is made..
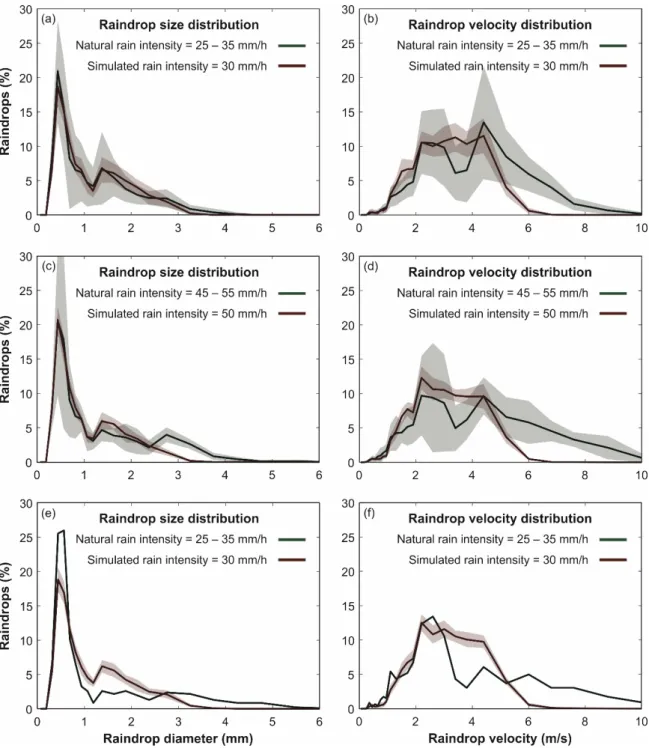
(8) Water 2020, 12, 152 Water 2020, 12, x FOR PEER REVIEW. 8 of 15 8 of 15. Figure 7. Number of of raindrops, raindrops, classified classified according according their their diameter diameter and and velocity, obtained by the 7. Number disdrometer intensities that it is to generate (30,(30, 50 disdrometer in in an an interval intervalof of10 10ssand andfor forthe thethree threerain rain intensities that it possible is possible to generate and 80 mm/h respectively). The experimental relation between diameter and terminal velocity [37] was 50 and 80 mm/h respectively). The experimental relation between diameter and terminal velocity [37] represented by the and dots (±25%) curves. was represented bysolid the solid and dots (±25%) curves.. 3.4. Simulated and Natural Rain Comparison 3.4. Simulated and Natural Rain Comparison The main objective in the development of this simulator was to achieve rain properties as close The main objective in the development of this simulator was to achieve rain properties as close as possible to local natural rain. In this section, a comparison of rain uniformity and raindrop size as possible to local natural rain. In this section, a comparison of rain uniformity and raindrop size and velocity distribution is made between simulated and natural rain measurements. Regarding rain and velocity distribution is made between simulated and natural rain measurements. Regarding rain uniformity, the measured intensity maps showed almost uniform simulated rainfalls with UC of 81%, uniformity, the measured intensity maps showed almost uniform simulated rainfalls with UC of 81%, 89% and 91% for rain intensities of 30, 50 and 80 mm/h, respectively, which are very close to the mean 89% and 91% for rain intensities of 30, 50 and 80 mm/h, respectively, which are very close to the mean value of 96% measured by Kathiravelu et al. [15] for natural rain. This is a notable achievement here, value of 96% measured by Kathiravelu et al. [15] for natural rain. This is a notable achievement here, considering the large area covered by the simulator. considering the large area covered by the simulator. In addition, this uniformity was obtained while maintaining suitable size and velocity distributions In addition, this uniformity was obtained while maintaining suitable size and velocity of raindrops, which ensures similar behavior to natural rain in the detachment of surface particles by distributions of raindrops, which ensures similar behavior to natural rain in the detachment of raindrop impacts in wash-off studies. In Figure 8, the raindrop size and velocity distributions measured surface particles by raindrop impacts in wash-off studies. In Figure 8, the raindrop size and velocity by disdrometer for each rain intensity that the simulator can generate were compared to those obtained distributions measured by disdrometer for each rain intensity that the simulator can generate were from natural rain in Section 3.1. The lowest simulated rain intensity (30 mm/h) was compared with compared to those obtained from natural rain in Section 3.1. The lowest simulated rain intensity (30 the mean of 33 disdrometer measurements of natural rain between 25 and 35 mm/h. In the case of mm/h) was compared with the mean of 33 disdrometer measurements of natural rain between 25 and the intermediate rain, the comparison was performed using 8 measurement between 45 and 55 mm/h. 35 mm/h. In the case of the intermediate rain, the comparison was performed using 8 measurement Finally, the 80 mm/h intensity rain was compared with a unique natural rain measurement of 77 mm/h. between 45 and 55 mm/h. Finally, the 80 mm/h intensity rain was compared with a unique natural Regarding the raindrop size distributions showed in Figure 8, it can be seen that the horizontal rain measurement of 77 mm/h. mesh selected from the calibration generates a very satisfactory raindrop size distribution, which accurately fitted natural rain measurements for all the intensities. In the case of the highest rain intensity, and in view of the high variability shown by natural rain for the rest of the intensities, the availability of only one natural raindrop size distribution produced a slightly worse fit for the peak of the raindrop diameter distribution. It can also be observed that the distributions of raindrop sizes, both natural and simulated, were similar for all the intensities, the rain intensity thus varying according to the total number of drops. The mean difference observed is the presence, in the intermediate and highest natural rainfall, of a few raindrops with diameters above 3 mm. These sizes cannot be generated by the rainfall simulator here because of the chosen mesh size of 3 mm, but this is only a modest disadvantage considering their low percentage with respect to the total amount of raindrops and the satisfactory uniformity and raindrop size distribution achieved by the mesh..
(9) Water 2020, 12, 152 Water 2020, 12, x FOR PEER REVIEW. 9 of 15 9 of 15. Figure8.8. Comparison distributions of raindrop sizessizes (plots a, c and ande) velocities (plots Figure Comparisonofofmean mean distributions of raindrop (plots a, ce)and and velocities b, d and f) between natural (green) and simulated (red) rainfall measurements for the three rain (plots b, d and f) between natural (green) and simulated (red) rainfall measurements for the three intensities that the rainfall simulator can generate. Contours represent standard deviation rain intensities that the rainfall simulator can generate. Contours represent standard deviationof of disdrometermeasurements measurementsboth bothfor fornatural naturaland and simulated simulated rain. rain. disdrometer. raindrop size distributions showed in distributions Figure 8, it can be seena that horizontal InRegarding Figure 8, the natural and simulated raindrop velocity showed verythe good fit up to mesh selected from correspond the calibration a very satisfactory raindrop distribution, which roughly 3 m/s, which withgenerates the terminal velocity of particles up tosize around 1 mm. From this accurately fitted natural rain measurements for all the intensities. In the case of the highest rain value, while the natural raindrops followed the experimental relation between diameter and terminal intensity, and in view of theand highKinzer variability shown by rainraindrops for the restdrifted of the intensities, velocity proposed in Gunn [37] (Figure 5),natural simulated away fromthe the availability of terminal only onevelocity natural as raindrop size distribution slightlythe worse for the peak corresponding their diameter increased produced (Figure 7) abecause dropfitheight was not of the raindrop diameter distribution. can also beThe observed that the distributions of raindrop sizes, enough to develop their terminal fallingItvelocities. percentage of simulated raindrops with higher both natural simulated, were similar between for all the intensities, rain intensity thusvelocities varying velocities than and 3 m/s are thus accumulated roughly 3 and the 6 m/s and the highest according to the total number of drops. The mean difference observed is the presence, in the are not developed in the rainfall simulator. However, due to the geometry involved, disdrometer intermediate and highest natural rainfall, of a few raindrops with diameters above 3 mm. These sizes cannot be generated by the rainfall simulator here because of the chosen mesh size of 3 mm, but this.
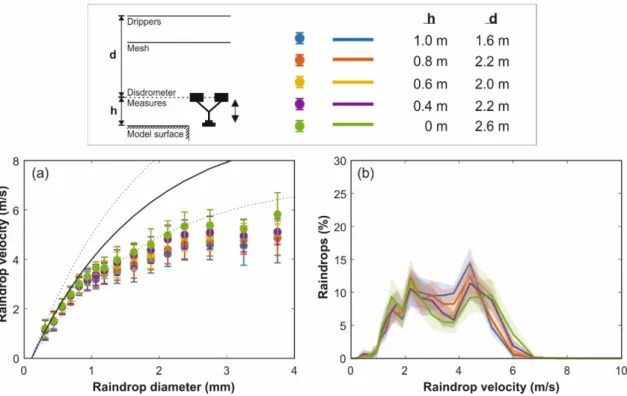
(10) roughly 3 m/s, which correspond with the terminal velocity of particles up to around 1 mm. From this value, while the natural raindrops followed the experimental relation between diameter and terminal velocity proposed in Gunn and Kinzer [37] (Figure 5), simulated raindrops drifted away from the corresponding terminal velocity as their diameter increased (Figure 7) because the drop height was not enough to develop their terminal falling velocities. The percentage of simulated Water 2020, 12, 152 10 of 15 raindrops with higher velocities than 3 m/s are thus accumulated between roughly 3 and 6 m/s and the highest velocities are not developed in the rainfall simulator. However, due to the geometry measurements of raindrop size and velocity distributions registered at 0.6 m from the model involved, disdrometer measurements of raindrop size andwere velocity distributions were registered at surface, and raindrop velocities could still increase before impacting the model surface for sizes that 0.6 m from the model surface, and raindrop velocities could still increase before impacting the model have notfor yetsizes reached surface that terminal have not velocity. yet reached terminal velocity. New raindrop size and velocity distributions were were thus measured by a disdrometer in an extension New raindrop size and velocity distributions thus measured by a disdrometer in an of the rainfall simulator outside the physical model surface to estimate the impact velocity at thevelocity model extension of the rainfall simulator outside the physical model surface to estimate the impact surface and tosurface assess the velocities to drop heightstoand raindrop In these at the model andvariation to assessof the variationaccording of velocities according drop heightssizes. and raindrop tests, the disdrometer measuring point was placed at different heights between 0 and 1 m from the sizes. In these tests, the disdrometer measuring point was placed at different heights between 0 and model surface and the size and by one dripperby were for 1 m from the model surface andvelocity the sizedistributions and velocityproduced distributions produced one registered dripper were 2registered min at 0.1for Hz. The relation between raindrop sizes and velocities, and the velocity distribution 2 min at 0.1 Hz. The relation between raindrop sizes and velocities, and the velocity of raindrops of forraindrops each dropfor height, are included in Figure 9. in In Figure these results, the impact of distribution each drop height, are included 9. In these results, velocity the impact raindrops the modelat surface corresponds the measurements obtained at h =obtained 0 m, withathh==0.6 m velocity ofatraindrops the model surface with corresponds with the measurements 0 m, being the measurement height of the disdrometer when it was placed on the physical model to register with h = 0.6 m being the measurement height of the disdrometer when it was placed on the physical simulated rain properties in Section 3.3. model to register simulated rain properties in Section 3.3.. Figure 9. 9. (a) (a) Mean Mean velocity velocity of of simulated simulated raindrops raindrops for for each each diameter diameter class class and and considering considering different different Figure measuring heights. heights. Velocity Velocity errors errors represent representstandard standarddeviation. deviation. The The experimental experimental relation relation between between measuring diameterand andterminal terminalvelocity velocity[37] [37]was wasrepresented representedby bythe thesolid solidand anddots dots(±25%) (±25%) curves. curves. (b) (b) Raindrop Raindrop diameter velocity distributions distributions for for different different measuring measuring heights. heights. Contours Contours represents represents standard standard deviation deviation of of velocity disdrometer measurements. disdrometer measurements.. Figure Figure 9a 9a shows shows the the increase increase of of raindrop raindrop velocities velocities for for greater greater drop drop heights heights depending depending on on the the raindrop Duetotothe theasymptotic asymptotic behavior phenomenon the velocity of raindrops raindrop size. Due behavior of of thethe phenomenon [39],[39], the velocity of raindrops with with diameters smaller 1.5 did mmnot didvary not vary the drop distance increased diameters smaller than than 1.5 mm whenwhen the drop distance was was increased sincesince theythey had had almost reached the terminal velocity. In fact, the mean velocity value for the mean raindrop size obtained in Section 3.3 is around the 87.5% of terminal velocity for the measuring heights considered. In the case of larger raindrops, their mean velocity was significantly increased for measurement points closer to the model surface, where velocities of approximately 75% of terminal velocities were achieved for raindrops with diameters up to 3 mm. This effect was also observed in the raindrop velocity distributions included in Figure 9b, where larger percentages of raindrops with high velocities were registered as the measuring point was displaced towards the model surface. The few raindrops with diameters above 3 mm make their mean velocity values negligible in terms of obtaining the potential.
(11) Water 2020, 12, 152. 11 of 15. detachability of particles by rain in wash-off studies. In sum, then, the new rainfall simulator developed in this study is able to generate an almost uniform rain covering a surface of 36 m2 , with a raindrop size distribution very similar to local natural rain, and presenting suitable raindrops velocities above 75% of terminal velocities and up to 87.5% in the case of the mean raindrop diameter. 4. Discussion Rain uniformity and raindrop size and velocity distributions are key in the detachment and transport of surface particles during wash-off processes, so the suitable rain properties obtained here make the presented rainfall simulator a very suitable tool for urban wash-off studies. First, the simulator achieved an impressive uniformity for three different rain intensities, 30, 50 and 80 mm/h, covering a large area of around 36 m2 . The use of drippers is simpler than existing drop-forming rainfall simulators [26–29] and allows the use of this typology in large-scale studies, being characterized by a better control of rain properties. In addition, the studied area can easily be extended while maintaining uniformity if the water supply pressure is inside the operating range of pressure-compensating drippers. This addresses the issue raised in the Introduction relating to the importance of spatial uniformity in the reliability of wash-off results and the difficulties of simulating uniform rain in large areas using several nozzles [24]. In addition, although the simulator does not allow us to generate complex synthetic rainfall events as in a recent study by Nielsen et al. [40], it is feasible to simulate a wide range of constant intensities and keeping suitable uniformities by changing the spatial density of drippers and their flow discharges. This design is thus a suitable alternative for the simulation of lower rain intensities with appropriate raindrop size distributions, which is a clear improvement over nozzle-based simulators that have to resort to intermittent rain [19]. It was also demonstrated that it is possible to generate different raindrop size distributions by changing the mesh size and its distance from drippers in order to adapt simulated rain to the required rain properties. Finally, the weak point of drop-forming rainfall simulators is that they generate drops with a null initial velocity, and that raindrops need to fall a considerable distance to reach their terminal velocity. As reported in Laws [39], 1.17-mm-size raindrops (slightly larger than our mean raindrop diameters) and 2.3-mm-size raindrops (the order of magnitude of our largest ones) require up to 5 and 13 m of fall, respectively, before attaining their terminal velocity completely, heights which are not practicable in a laboratory facility. However, due to the asymptotic behavior of the phenomenon, 90% of terminal velocity can be achieved with considerably less fall heights, of 2 and 4 m, respectively. In the present study, the simulator was installed as high as possible, at 2.6 m from the model surface, obtaining raindrop impact velocities of around 87.5% of their terminal velocities for the mean raindrop diameter, and 75% for raindrops with larger diameters, up to 3 mm. These results are already very satisfactory considering the almost uniform rain and the very suitable raindrop size distributions obtained, but a significant improvement in the velocity of larger raindrops could be achieved through increasing the simulator’s total height. Following the results reported in Laws [39], and considering that the horizontal mesh slightly reduces raindrop velocities, an optimal installation height of roughly 4.5 m can be estimated. From this point, a large increase in height would be required to achieve only a slight increase in raindrop velocity. Due to the high variability of natural rain properties and the different typologies of rainfall simulators in use, the measurement of raindrop size and velocity distributions by disdrometers in field and laboratory studies [41] should become a standard procedure to ensure the comparability and transferability of wash-off and sediment transport results. Therefore, the accurate characterization of rain properties carried out in this study is a significant contribution, enhancing derived results and showing the performance of the rainfall simulator when it is calibrated using natural rain measurements. The initial results obtained using this simulator involved an accurate definition of the runoff flow generated, plus a series of wash-off and sediment transport experiments using the three rain intensities analyzed in this article and five different sediment granulometries, which were initially distributed over the model surface [42]. The experimental dataset obtained is described and openly available at.
(12) Water 2020, 12, 152. 12 of 15. the Zenodo [43] repository, where the quality of the experimental results obtained using this rainfall simulator can be confirmed. In addition, these experimental results were used to obtain a detailed representation of the overland runoff though a 2D shallow water model [44] and to analyze the performance of a novel physically-based urban wash-off model [45]. The work carried out to date has focused on analyzing total suspended solids mobilization through the different parts of an urban drainage physical model, so tap water was used directly from the laboratory water supply. This prevents blockages and provides suitable pressure within the operating range of the pressure-compensating drippers. However, the rainfall simulator might be adapted for the use of distilled water through a tank and a pumping system to analyze, for example, dissolved solids or heavy metals wash-off. For this, with 5-min-long experiments, as in the case of the wash-off experiments already performed, a volume of around 90, 150 and 240 L would be necessary for each rain intensity that the simulator can generate (30, 50 and 80 mm/h). This solution, using a pumping system, would be also suitable as a means of adapting the simulator design for field applications. Whereas it is true that a large infrastructure is required in the case of large areas, as indeed has been shown in the application of the simulator in the present study, areas of a few square meters, common in applications of this kind [5,11,13], can be covered with a far more affordable and simpler structure, similar to that presented in Clarke and Walsh [28]. The main benefit of the present simulator would be reduced in such cases, since nozzles can also achieve very suitable spatial uniformities in reduced areas. However, the non-intermittent rain produced, the suitable raindrop size distribution obtained, and the greater height available in field applications, all mean that this new alternative is also of great potential use in such studies. Finally, due to the similarities between urban wash-off and soil erosion processes, in which rain properties are key in the detachment of surface particles and their subsequent transport by the generated runoff, the rainfall simulator developed here can also be useful for analyzing rain-driven soil erosion in rural catchments. So, the rainfall simulator design presented and calibrated in this study is a new alternative for the simulation of rainfall for a wide range of studies, offering very good spatial uniformity and raindrop size distribution. The total cost of the simulator was around 3500 € (97 €/m2 ), which includes the construction of 7 metallic porticoes (2500 €) to sustain hose circuits. In addition, no maintenance costs were incurred over almost three years of intensive use. 5. Conclusions In this study, a new drop-forming rainfall simulator was developed to be applied in wash-off and sediment transport studies in a street-scale laboratory physical model. To this end, the proposed simulator design, which consists of pressure-compensating dripper grids above a horizontal mesh that breaks and distributes raindrops, was calibrated using natural rain as a reference. The mesh typology, mesh size and mesh-drippers distance that best fitted natural rain measurements, were established in consideration of rain intensity, rain uniformity, and raindrop size and velocity distributions. Finally, the rain properties of the selected solution were measured for the three rain intensities that the rainfall simulator is able to generate. In light of the results obtained, the following three main conclusions were drawn: •. •. Modifying the density of drippers and their flow rate makes possible the precise generation of a wide range of rainfalls with different intensities, maintaining suitable uniformities and raindrop diameter distributions. This design has been presented as a suitable solution for simulating low rain intensities, which is a clear improvement on nozzles-based simulators that have to resort to intermittent rains. Very good spatial uniformity of rain intensities was obtained covering an area of 36 m2 , both for high-resolution measurements during calibration (10 cm resolution) and for large-scale measurements during rain characterization of the final solution (resolution of 50 cm). The Christiansen’s UC obtained of 81%, 89% and 91% for the rain intensities of 30, 50 and.
(13) Water 2020, 12, 152. •. 13 of 15. 80 mm/h, respectively, showed almost uniform rainfalls, which confirms a good transferability of the experimental results that will be obtained when using the simulator. This rainfall simulator design allowed for controlling rain properties from the calibration of the mesh typology, mesh size, and mesh-drippers distance. The calibration performed in this study has achieve a very accurate representation of raindrop size distribution using local natural rain measurements as a reference, and maintaining good rain uniformity. In this study, the simulator was installed as high as possible, at 2.6 m, achieving suitable raindrop impact velocities of around 87.5% of their terminal velocities for the mean raindrop diameter and 75% for larger raindrops of up to 3 mm. This impact velocity of large raindrops could be further improved by increasing the simulator height to roughly 4.5 m.. Considering the difficult challenge of simulating rain that is as real as possible, the results achieved here have been very satisfactory. The almost uniform rain uniformity and the suitable drop size and velocity distributions indicate that the rainfall simulator developed is optimal for wash-off experiments. In addition, the flexibility seen in controlling rain characteristics increases the value of the proposed design, in that it is adaptable to a wide range of studies. Author Contributions: Conceptualization, J.P., J.A., J.S. and J.N.; methodology, J.N. and J.A.; investigation, J.N.; resources, J.A., J.P. and J.S.; writing—original draft preparation, J.N.; writing—review and editing, J.A.; supervision, J.A., J.P. and J.S. All authors have read and agreed to the published version of the manuscript. Funding: The first author was in receipt of a Spanish Ministry of Science, Innovation and Universities predoctoral grant FPU14/01778. The project was partially funded by the Spanish Ministry of Science, Innovation and Universities under POREDRAIN project RTI2018-094217-B-C33 (MINECO/FEDER-EU). Conflicts of Interest: The authors declare no conflict of interest.. References 1. 2. 3. 4.. 5. 6. 7. 8. 9.. 10.. 11.. United Nations, Department of Economic and Social Affairs. Population Division the World’s Cities in 2018—Data Booklet (ST/ESA/SER.A/417); United Nations: New York, NY, USA, 2018. Akan, A.O.; Houghtalen, R.J. Urban Hydrology, Hydraulics, and Stormwater Quality: Engineering Applications and Computer Modelling; John Wiley & Sons: Hoboken, NJ, USA, 2003. Anta, J.; Peña, E.; Suárez, J.; Cagiao, J. A BMP selection process based on the granulometry of runoff solids in a separate urban catchment. Water SA 2006, 32, 419–428. [CrossRef] Zafra, C.; Temprano, J.; Suárez, J. A simplified method for determining potential heavy metal loads washed off by stormwater runoff from road-deposited sediments. Sci. Total Environ. 2017, 601, 260–270. [CrossRef] [PubMed] Egodawatta, P.; Thomas, E.; Goonetilleke, A. Mathematical interpretation of pollutant wash-off from urban road surfaces using simulated rainfall. Water Res. 2007, 41, 3025–3031. [CrossRef] [PubMed] Butler, D.; Digman, C.J.; Makropoulos, C.; Davies, J.W. Urban Drainage, 4th ed.; CRC Press: Boca Raton, FL, USA, 2018. Wijesiri, B.; Egodawatta, P.; McGee, J.; Goonetilleke, A. Incorporating process variability into stormwater quality modelling. Sci. Total Environ. 2015, 533, 454–461. [CrossRef] Schellart, A.N.A.; Tait, S.J.; Ashley, R.M. Towards quantification of uncertainty in predicting water quality failures in integrated catchment model studies. Water Res. 2010, 44, 3893–3904. [CrossRef] Gorgoglione, A.; Bombardelli, F.A.; Pitton, B.J.; Oki, L.R.; Haver, D.L.; Young, T.M. Uncertainty in the parameterization of sediment build-up and wash-off processes in the simulation of sediment transport in urban areas. Environ. Model. Softw. 2019, 111, 170–181. [CrossRef] Sartor, J.D.; Boyd, G.B. Water Pollution Aspects of Street Surface Contaminants. United States Environmental Protection Agency, Washington, DC, EPA-R2-72-081; Environmental Protection Agency: Washington, DC, USA, 1972. Al Ali, S.; Bonhomme, C.; Dubois, P.; Chebbo, G. Investigation of the wash-off process using an innovative portable rainfall simulator allowing continuous monitoring of flow and turbidity at the urban surface outlet. Sci. Total Environ. 2017, 609, 17–26. [CrossRef].
(14) Water 2020, 12, 152. 12.. 13. 14.. 15.. 16. 17.. 18. 19. 20.. 21.. 22. 23. 24.. 25. 26. 27. 28. 29.. 30. 31. 32. 33.. 14 of 15. Muthusamy, M.; Tait, S.J.; Schellart, A.N.A.; Beg, M.N.A.; Carvalho, F.R.; de Lima, J.L.M.P. Improving understanding of the underlying physical process of sediment wash-off from urban road surfaces. J. Hydrol. 2018, 557, 426–433. [CrossRef] Mamoon, A.A.; Jahan, S.; He, X.; Joergensen, N.E.; Rahman, A. First flush analysis using a rainfall simulator on a micro catchment in an arid climate. Sci. Total Environ. 2019, 693, 133552. [CrossRef] Grismer, M.E. Rainfall Simulation Studies—A Review of Designs, Performance and Erosion Measurement Variability. 2011. Available online: http://ucanr.org/sites/californiaagriculture/files/145682.pdf (accessed on 3 January 2020). Kathiravelu, G.; Lucke, T.; Nichols, P. Designing the Perfect Rainfall Simulator for Urban Stormwater Studies: An Impossible Dream? In Proceedings of the 13th International Conference on Urban Drainage, Sarawak, Malaysia, 7–12 September 2014; pp. 1–9. Isidoro, J.M.G.P.; de Lima, J.L.M.P.; Leandro, J. Influence of wind-driven rain on the rainfall-runoff process for urban areas: Scale model of high-rise buildings. Urban Water J. 2012, 9, 199–210. [CrossRef] Loch, R.J.; Robotham, B.G.; Zeller, L.; Masterman, N.; Orange, D.N.; Bridge, B.J.; Sheridan, G.; Bourke, J.J. A multi-purpose rainfall simulator for field infiltration and erosion studies. Soil Res. 2001, 39, 599–610. [CrossRef] Paige, G.B.; Stone, J.J.; Smith, J.R.; Kennedy, J.R. The Walnut Gulch rainfall simulator: A computer-controlled variable intensity rainfall simulator. Appl. Eng. Agric. 2004, 20, 25–31. [CrossRef] Herngren, L.; Goonetilleke, A.; Sukpum, R.; Silva, D.Y. de Rainfall Simulation as a Tool for Urban Water Quality Research. Environ. Eng. Sci. 2005, 22, 378–383. [CrossRef] Aksoy, H.; Unal, N.E.; Cokgor, S.; Gedikli, A.; Yoon, J.; Koca, K.; Inci, S.B.; Eris, E. A rainfall simulator for laboratory-scale assessment of rainfall-runoff-sediment transport processes over a two-dimensional flume. CATENA 2012, 98, 63–72. [CrossRef] Júnior, S.S.; Siqueira, E.Q. Development and calibration of a rainfall simulator for urban hydrology research. In Proceedings of the 12th International Conference on Urban Drainage, Porto Alegre, Brazil, 11–16 September 2011; pp. 11–16. Armstrong, A.; Quinton, J.N. Pumped rainfall simulators: The impact of rain pulses on sediment concentration and size. Earth Surf. Process. Landf. 2009, 34, 1310–1314. [CrossRef] Vaze, J.; Chiew, F.H. Study of pollutant washoff from small impervious experimental plots. Water Resour. Res. 2003, 39, 6. [CrossRef] Lassu, T.; Seeger, M.; Peters, P.; Keesstra, S.D. The Wageningen rainfall simulator: Set-up and calibration of an indoor nozzle-type rainfall simulator for soil erosion studies. Land Degrad. Dev. 2015, 26, 604–612. [CrossRef] Naves, J.; Jikia, Z.; Anta, J.; Puertas, J.; Suárez, J.; Regueiro-Picallo, M. Experimental study of pollutant washoff on a full-scale street section physical model. Water Sci. Technol. 2017, 76, 2821–2829. [CrossRef] Roth, C.H.; Meyer, B.; Frede, H.G. A portable rainfall simulator for studying factors affecting runoff, infiltration and soil loss. CATENA 1985, 12, 79–85. [CrossRef] Battany, M.C.; Grismer, M.E. Development of a portable field rainfall simulator foruse in hillside vineyard runoff and erosion studies. Hydrol. Process. 2000, 14, 1119–1129. [CrossRef] Clarke, M.A.; Walsh, R.P.D. A portable rainfall simulator for field assessment of splash and slopewash in remote locations. Earth Surf. Process. Landf. 2007, 32, 2052–2069. [CrossRef] Abd Elbasit, M.A.; Yasuda, H.; Salmi, A.; Anyoji, H. Characterization of rainfall generated by dripper-type rainfall simulator using piezoelectric transducers and its impact on splash soil erosion. Earth Surf. Process. Landf. 2010, 35, 466–475. [CrossRef] Christiansen, J.E. Irrigation by Sprinkling, No. 04; USDA, REPORT 1532; Agricultural Experiment Station, University of California: Berkeley, CA, USA, 1942. Tokay, A.; Wolff, D.B.; Petersen, W.A. Evaluation of the New Version of the Laser-Optical Disdrometer, OTT Parsivel2 . J. Atmos. Ocean Technol. 2014, 31, 1276–1288. [CrossRef] Coutinho, M.A.; Tomás, P.P. Characterization of raindrop size distributions at the Vale Formoso Experimental Erosion Center. CATENA 1995, 25, 187–197. [CrossRef] Friedich, K.; Gochis, D.; Kucera, P.A.; Ikeda, K.; Sun, J. Raindrop Size Distribution and Rain Characteristics during the 2013 Great Colorado Flood. J. Hydrometeorol. 2016, 17, 53–72. [CrossRef].
(15) Water 2020, 12, 152. 34. 35. 36.. 37. 38. 39. 40.. 41. 42. 43. 44.. 45.. 15 of 15. Tokay, A.; D’Adderio, L.P.; Porcù, F.; Wolff, D.B.; Petersen, W.A. A Field Study of Footprint-Scale Variability of Raindrop Size Distribution. J. Hydrometeorol. 2017, 18, 3165–3179. [CrossRef] Chen, B.; Hu, Z.; Liu, L.; Zhang, G. Raindrop Size Distribution Measurements at 4,500 m on the Tibetan Plateau During TIPEX-III. J. Geophys. Res. Atmos. 2017, 122, 11,092–11,106. [CrossRef] Tokay, A.; D’Adderio, L.P.; Wolff, D.B.; Petersen, W.A. Development and Evaluation of the Raindrop Size Distribution Parameters for the NASA Global Precipitation Measurement Mission Ground Validation Program. J. Atmos. Ocean. Technol. 2019. [CrossRef] Gunn, R.; Kinzer, G.D. The terminal velocity of fall for water droplets in stagmant air. J. Meteorol. 1949, 6, 243–248. [CrossRef] Tokay, A.; Bashor, P.G.; Habib, E.; Kasparis, T. Raindrop size distribution measurements in tropical cyclones. Mon. Weather Rev. 2008, 136, 1669–1685. [CrossRef] Laws, J.O. Measurements of the fall-velocity of water -drops and raindrops. Trans. Am. Geophys. Union 1941, 22, 709–721. [CrossRef] Nielsen, K.T.; Moldrup, P.; Thorndahl, S.; Nielsen, J.E.; Duus, L.B.; Rasmussen, S.H.; Uggerby, M.; Rasmussen, M.R. Automated rainfall simulator for variable rainfall on urban green areas. Hydrol. Process. 2019, 33, 3364–3377. [CrossRef] Iserloh, T.; Fister, W.; Seeger, M.; Willger, H.; Ries, J.B. A small portable rainfall simulator for reproducible experiments on soil erosion. Soil Tillage Res. 2012, 124, 131–137. [CrossRef] Naves, J.; Anta, J.; Suárez, J.; Puertas, J. Hydraulic, wash-off and sediment transport experiments in a full-scale urban drainage physical model. Sci. Data 2020, in press. Naves, J.; Anta, J.; Suárez, J.; Puertas, J. [Dataset] WASHTREET Hydraulic, wash-off and sediment transport experimental data in an urban drainage physical model. Zenodo 2019. [CrossRef] Naves, J.; Anta, J.; Puertas, J.; Regueiro-Picallo, M.; Suárez, J. Using a 2D shallow water model to assess Large-Scale Particle Image Velocimetry (LSPIV) and Structure from Motion (SfM) techniques in a street-scale urban drainage physical model. J. Hydrol. 2019, 575, 54–65. [CrossRef] Naves, J.; Rieckermann, J.; Cea, L.; Puertas, J.; Anta, J. Global and local sensitivity analysis to improve the understanding of physically-based urban wash-off models from high-resolution laboratory experiments. Sci. Total Environ. 2020, 709, 136152. [CrossRef] © 2020 by the authors. Licensee MDPI, Basel, Switzerland. This article is an open access article distributed under the terms and conditions of the Creative Commons Attribution (CC BY) license (http://creativecommons.org/licenses/by/4.0/)..
(16)
Figure
+5
Documento similar