Is It Possible to Predict the Manual Web Accessibility Result Using the Automatic Result?
9
0
0
Texto completo
(2) repeatable. Furthermore, some contexts of use are difficult to simúlate and some accessibility issues may not be detected. One of the main challenges with manual evaluation is cost: Many web sites contain quite a lot of web pages, making it impossible for a detailed manual assessment of a statistically sound selection of pages. Moreover, even though many web sites are based on a limited number of templates, the different content within each web site makes a manual evaluation a tedious process. In reality, there is no choice but to rely on automated tools when reviewing large web sites for accessibility. A question which naturally arises is to what extent the results from automatic evaluation of a web site and individual web pages can be used as an approximation for manual results. This paper presents the initial results of an investigation aimed at answering this question. To provide comparable results between the automatic and manual evaluations, it was natural to choose a methodology which supports both evaluation types and which produces quantitative results [2] [3]1. In this paper we have used the Unified Web Evaluation Methodology (UWEM) [4], which matches both above criteria. Additionally, there exist tools supporting automatic evaluation according to UWEM both on web site and web page level. The automatic test results in this paper has been gathered using the European Internet Accessibility Observatory (EIAO) [5]. The remainder of the paper is organized as follows. Section 2 gives a brief overview of UWEM and Section 3 describes EIAO and its evaluation engine. Then, Section 4 discusses manual evaluation inside UWEM. After this introductory content, Section 5 presents our hypothesis, Section 6 the results and Section 7 presents some concluding remarks and future work.. 2 Unified Web Evaluation Methodology There exist several evaluation methodologies which differ in subtle yet meaningful ways, even though most are based on the Web Content Accessibility Guidelines 1.0 (WCAG 1.0) [6]. The methodologies have different approaches for how tests are applied, which pages from each site are evaluated and how results are presented. This means that it is challenging to compare results between European member states as the methodology used of evaluation is completely different. To deal with this, the European Commission requested a harmonised methodology for web accessibility evaluation in Europe. From this request, the Web Accessibility Cluster (WAB) developed the Unified Web Evaluation Methodology (UWEM) [4]. The methodology is based on WCAG 1.0 levéis A and AA, and is designed as a joint, repeatable and comparable method for testing web accessibility in Europe [7]. Note that UWEM has not yet merged to the newly released Web Content Accessibility Guidelines 2.0 [8], but a WCAG2.0 migration document for UWEM exists [4].. Note that the references to the score functions in UWEM and EIAO in these papers are outdated. Previous versions of UWEM grouped accessibility in several disability groups which was abandoned in the most recent versions of UWEM and the metrics updated accordingly. Both [2] and [3] still address the outdated versión of the metric. In our paper we use the most recent UWEM metric..
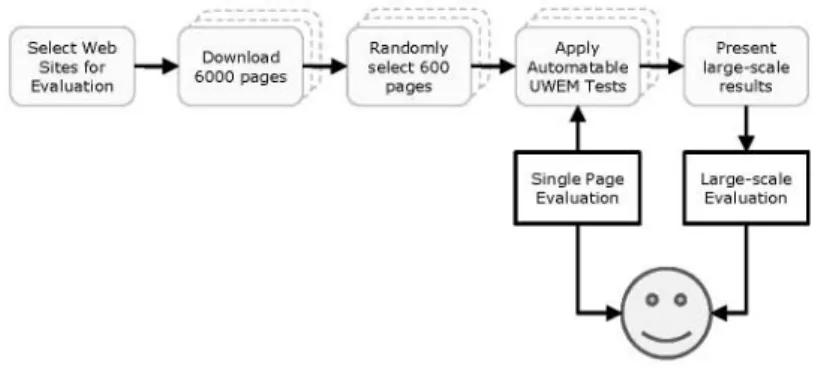
(3) 3 European Internet Accessibility Observatory The European Internet Accessibility Observatory (EIAO) is a fully automatic implementation of UWEM. In total 23 of the tests marked as automatable in UWEM are also part of EIAO. Of these 21 address (X)HTML while 2 address CSS. UWEM includes three additional automatable tests which are not part of EIAO, these address sufficient colour contrast in (X)HTML and CSS and use of animated GIFs. The observatory has two ways of presenting accessibility results, as shown in Figure 1, results from large scale evaluations and results from single web pages.. Select Web Sites for Evaluation. Download 6000 pages. Randomly select 600 pages. Apply Automatable UWEM Tests. Present large-scale results. Single Page Evaluation. Large-scale Evaluation. kSH Fig. 1. EIAO Workflow. • Large-scale evaluation. For large scale assessments, results are presented on web site, región and country level. As shown in Figure 1 for each selected web site, 6,000 pages are downloaded. If the web site is smaller than 6,000 pages, the complete site is downloaded. Following, 600 pages are randomly selected - a statistically sound representative sample of the web site. For each page every automatable test is applied and the results from pages and sites are calculated and presented to the user. • Single page evaluation. Additionally, the users of EIAO can evalúate single web pages3 with the same implementation. Users provide a URL and the corresponding (X)HTML and CSS is evaluated according to the UWEM methodology and automatable tests.. 4 Manual Evaluation of Web Accessibility In addition to automatic evaluation, UWEM addresses the possibility to perform manual evaluations. From a web site a core resource set is selected for evaluation. This resource set is intended to be representative of the web site and includes pages. The work from the European Internet Accessibility Observatory concluded. However, the Observatory and implementation is continued in the project named eGovernment Monitoring. Evaluation of single pages according to 21 of the automatable UWEM tests can be done with the eAccessibility Checker http://accessibility.egovmon.no..
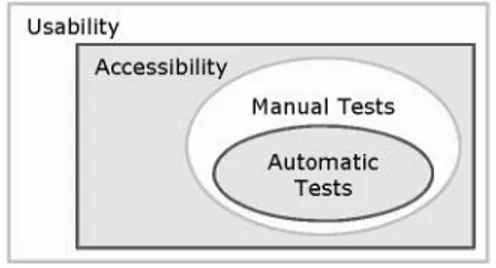
(4) such as main home page, help page, search results etc. For each selected web page 141 tests are applied. As outlined in Figure 2, accessibility is often seen as a part of usability and an improvement in accessibility would benefit both people with and without special needs [9] [10]. Furthermore, not all accessibility issues can be detected by testing alone. This is especially true for issues located in the grey área between accessibility and usability. Usability Accessibility^. Manual Tests V f \ V. Automatic Tests. Fig. 2. Relationship between Usability, Accessibility, Manual and Automatic testing. Existing accessibility assessment methodologies, including UWEM, rely upon manual evaluation supplemented with automatic testing. As an example, testing for valid (X)HTML and CSS, which is a requirement in WCAG 1.0, is more reliable when performed automatically by tools compared to a human evaluator. Similarly, UWEM includes in total 23 tests which can be performed equally good or better by automatic tools than human evaluators. It should be noted that 118 of the 141 (84%) of the defined UWEM tests relies on human judgement.. 5 Assessing the Accessibility of Web Sites. Hypothesis The aim of our research is to assert to what extent accessibility results retrieved by automatic testing alone can be used as an estimation or prediction of manual assessments results. As manual evaluation is bofh more costly and has the potential bias from human judgment, it is clear that a prediction of manual results using automated testing is highly beneficial. However, there has to the best of our knowledge not been any such comparison carried out. Our goal was initially to perform comparison of accessibility results on web site level. However, we discovered that manual evaluation of web sites where highly time consuming, and such a comparison was unrealistic within our time frame. Because of this we selected two web sites, corresponding to two Spanish public Universities, which should provide accessible web sites according to the Spanish legislation. From fhese two sites we selected 15 pages based on the core resource set as it is defined in UWEM methodology. We evaluated the accessibility of these pages according to UWEM both completely automatically using the EIAO framework and manually. Based on these results we investigated to what extend the results retrieved automatically could be used to predict the manual results..
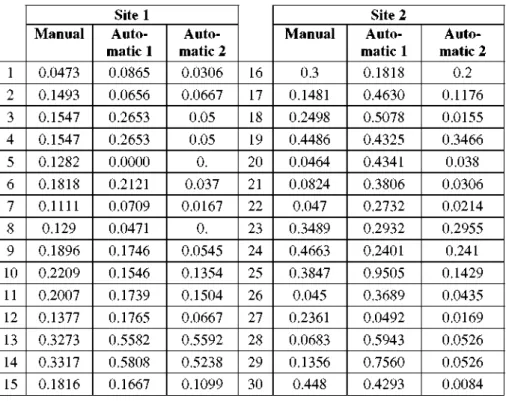
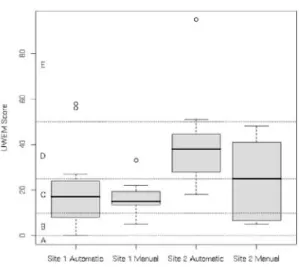
(5) 6 Results Table 1 shows manual and automatic results as UWEM score from 30 evaluated web pages of two distinct web sites. Initially, we started with Manual results and automatic results as UWEM implemented by EIAO (Automatic 1).. The difference between Automatic 1 and Automatic 2 is that (X)HTML validation results are deliberately left out in Automatic 2. The reasoning behind this is explained in detail below. Figure 3 shows the comparison of manual and automatic accessibility evaluation results on site level as a box plot for each site. It should be noted that the UWEM score on site is not equal as the average page score presented in Figure 3 and that the results on page level are not directly applicable on site level. Nevertheless, the figure shows that there is a clear difference between the sites and the individual page results appear to be similar for automatic and manual evaluation. Furthermore, in Figure 4 we present a scatter plot of the manual versus automatic test results. From this figure, it is not possible to see any correlation between the two evaluation methods. Additionally, a linear regression analysis gives a high p-value ofO.1343 and a very low Pearson correlation of 0.27984. Bofh of these calculations indicate that there is not significant correlation between these two results. Table 1. Manual and Automatic Evaluation Results. Manual 1 2 3 4 5 6 7 8 9 10 11 12 13 14 15 4. 0.0473 0.1493 0.1547 0.1547 0.1282 0.1818 0.1111 0.129 0.1896 0.2209 0.2007 0.1377 0.3273 0.3317 0.1816. Sitel Automatic 1 0.0865 0.0656 0.2653 0.2653 0.0000 0.2121 0.0709 0.0471 0.1746 0.1546 0.1739 0.1765 0.5582 0.5808 0.1667. Automatic 2 0.0306 0.0667 0.05 0.05 0. 0.037 0.0167 0. 0.0545 0.1354 0.1504 0.0667 0.5592 0.5238 0.1099. Manual 16 17 18 19 20 21 22 23 24 25 26 27 28 29 30. 0.3 0.1481 0.2498 0.4486 0.0464 0.0824 0.047 0.3489 0.4663 0.3847 0.045 0.2361 0.0683 0.1356 0.448. Site 2 Automatic 1 0.1818 0.4630 0.5078 0.4325 0.4341 0.3806 0.2732 0.2932 0.2401 0.9505 0.3689 0.0492 0.5943 0.7560 0.4293. Automatic 2 0.2 0.1176 0.0155 0.3466 0.038 0.0306 0.0214 0.2955 0.241 0.1429 0.0435 0.0169 0.0526 0.0526 0.0084. Our initial idea was to apply a paired t-test on the result. For a paired t-test to be applicable, the results have to be in a gaussian distribution. The results obtained where not within this distribution and a paired t-test could not reliably be applied..
(6) Cornpartson of site results from manual and automatic evaluation. Site " Automatic. Site 1 Manual. Site 2 Automatic. Site £ Manual. Fig. 3. Correlation between web site 1 and web site 2 on site level. -. 0.1. 0.2. 13. OH. Fig. 4. Comparison of Manual and Automatic Evaluation. By going into further details of the results, we discovered that (X)HTML validation results had been interpreted differently between the experts performing the manual evaluation and in the EIAO implementation. The expert evaluators counted a page with invalid (X)HTML as one potential barrier. In contrast, EIAO counts every validation error as potential barrier. Since validation error is the most common web barrier [11] this mismatch in the interpretation clearly had an impact on the overall results..
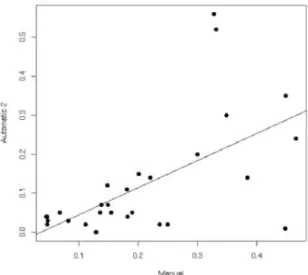
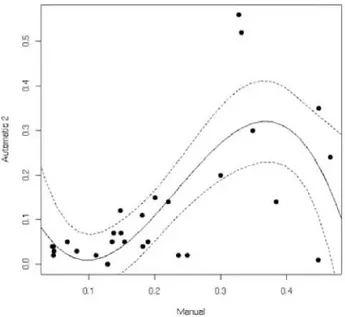
(7) Because of this, we decided to do a comparison between the of automatic evaluation wifhout (X)HTML validation. This is presented as Automatic 2 in Table 1 where results from (X)HTML validations are deliberately removed. Figure 5 shows a scatter plot of manual versus automatic evaluation when (X)HTML validation results have deliberately been removed. This graph shows a much more visible correlation compared to Figure 4. Furthermore, a linear regression analysis gives a low p-value of 0.0004 and a relatively high Pearson correlation of 0.6052.. !. 0.1. Ü.Z. 013. <M. Fig. 5. Comparison of Manual and Automatic Evaluation without (X)HTML validation results. These calculations clearly show that there is a very significant correlation between the manual and automatic evaluations on page level using the Unified Web Evaluation Methodology. Additionally, in Figure 6 we present a cubic regression of the comparison as well as a 95% confidence interval of this regression (dotted line). This figures shows all but eight valúes would be within this confidence interval. In other words, a prediction of manual accessibility results based only on automatic results would be correct within 95% confidence interval for 73.3% of the results. The remaining 26.7% cannot be predicted within this confidence interval. 6.1 Limitations of the Results We have evaluated accessibility only on web page level using the implemented automatable tests using with the EIAO and all 141 tests manually. However, UWEM address accessibility on site level and conclusión based on page level results may not be applicable on site level. Results from the two web sites we have available is simply not enough to do any comparison on site level and manual evaluation according to UWEM is very time consuming..
(8) 0,1. OS. 13. (M. Menuál. Fig. 6. Comparison of Manual and Automatic Evaluation Results with confidence level. Furthermore, the 30 pages evaluated where based on five different templates. Since this is a low number of templates it influences the comparison results. Clearly, the conclusión based on our data may not be applicable for all web pages. Three automatable tests from UWEM are not part of the EIAO implementation dealing with colour contrasts and animated GIFs. If these tests where part of the evaluation, the results would also have been different.. 7 Conclusions In this paper we have presented results from automatic and manual evaluation of web accessibility using the unified web evaluation methodology (UWEM). We have further compared these results to investígate if automatic evaluation results can be used as an estimation of manual evaluation results. We applied all 141 of the UWEM tests manually and 23 of the tests automatically on 30 web pages from two web sites. In our research we found that test descriptions in UWEM where unclear. In fact, how (X)HTML validation errors should be counted was interpreted differently by the expert evaluators and the software developers. The expert evaluators counted a page with invalid (X)HTML as one barrier, while the implementation counted every validation error as a potential barrier. This had a significant impact on the results which gave the impression that there was not any correlation between manual and expert evaluation results. However, by removing results of the discordant test, the comparison shows completely different characteristics. There was a strong correlation between the automatically and manually retrieved results on web page level. In our data set automatically retrieved results could most definitely be used as an approximation manual evaluation.
(9) results. In fact, in our data, 73% of the manual results can correctly be predicted with automatic evaluation results alone. As further works, we plan to do a more detailed analysis. The analyzed web sites in this paper are created from a small number of templates. Of the evaluated pages in total five different templates have been used in addition to some pages without templates. Clearly, these few sets of templates may have influenced the results. We plan to do an analysis of pages created from a larger set of templates in addition to investí gating if correlation exists on web site level. Acknowledgements. This work is part of the eGovMon http://www.egovmon.no/ project, co-funded by the Research Council of Norway under the VERDIKT program. Project no.: Verdikt 183392/S10.. References 1. World Wide Web Consortium: Evaluating Web Sites for Accessibility: Overview, http://www.w3.org/WAI/eval/Overview.html 2. Vigo, M., Arme, M., Brajnik, G., Lomuscio, R., Abascal, J.: Quantitative metrics for measuring web accessibility. In: 2007 International Cross-Disciplinary Conference on Web accessibility (W4A), pp. 99-107. ACM, New York (2007) 3. Arrue, M., Vigo, M.: Considering Web Accessibility in Information Retrieval Systems. In: Baresi, L., Fraternali, P., Houben, G. (eds.) ICWE 2007. LNCS, vol. 4607, pp. 370-384. Springer, Heidelberg (2007) 4. Web Accessibility Benchmarking Cluster: Unified Web Evaluation Methodology 1.2, http://www.wabcluster.org/uweml_2/ 5. Snaprud, M.: European Internet Accessibility Observatory, h t t p : / /www. e i a o . n e t 6. World Wide Web Concortium: Web Content Accessibility Guidelines 1.0., http://www.w3.org/TR/WCAG10/ 7. Nietzio, A., Strobbe, C , Velleman, E.: The Unified Web Evaluation Methodology (UWEM) 1.2 for WCAG. In: Miesenberger, K., Klaus, I , Zagler, W., Karshmer, A. (eds.) ICCHP 2008. LNCS, vol. 5105, pp. 394^101. Springer, Heidelberg (2008) 8. World Wide Web Concortium: Web Content Accessibility Guidelines 2.0., http://www.w3.org/TR/WCAG20/ 9. Petrie, H., Kheir, O.: The relationship between accessibility and usability of websites. In: 2007 SIGCHI conference on Human factors in computing systems, pp. 397^-06. ACM, New York (2007) 10. Beirekdar, A., Keita, M., Noirhomme, M., Randolet, F., Vanderdonckt, J., Mariage, C : Flexible Reporting for Automated Usability and Accessibility Evaluation of Web Sites. In: Costabile, M.F., Paterno, F. (eds.) INTERACT 2005. LNCS, vol. 3585, pp. 281-294. Springer, Heidelberg (2005) 11. Olsen, M.G.: How Accessible is the Public European Web, http://mortengoodwin.net/publicationfiles/ how_accessible_is_the_european_web.pdf.
(10)
Figure
+3
Documento similar