Are the determinants of CO2 emissions converging among OECD countries?
7
0
0
Texto completo
(2) Are the determinants of CO2 emissions converging among OECD countries? Mariam Camarero * Andrés J Picazo-Tadeo **,# Cecilio Tamarit ** * Departamento. de Economía. Universidad Jaume I, Spain de Economía Aplicada II. Universidad de Valencia, Spain # Corresponding author. Phone ++34 96 3828349/62 Fax ++34 96 3828354 Email: [email protected]. ** Departamento. Abstract. This paper studies convergence in CO2 emission intensity (CO2 over GDP) among OECD countries over the period 1960-2008 based on its determinants, namely, energy intensity (energy consumption over GDP) and the so-called carbonisation index (CO2 emissions over energy consumption). We apply the Phillips and Sul (2007) methodology, which tests for the existence of convergence clubs. Our results highlight that differences in emission intensity convergence are more determined by differences in convergence of the carbonisation index rather than by differences in the dynamic convergence of energy intensity. Keywords: convergence; OECD; CO2 emission intensity; energy intensity; carbonisation index JEL classification: C15, C22, Q53, Q54 1. Introduction The impact of economic activity on the environment has received increasing attention from researchers, politicians and society as a whole in recent decades. In addition, growing concern over climate change has fuelled a burgeoning literature devoted to studying the relationship between production processes and air emissions. In this line, various researchers have analysed convergence at region or country level using indicators such as per capita CO2 emissions; representative papers include Westerlund and Basher (2008), Romero-Ávila (2008), Jobert et al. (2010) and Barassi et al. (2011). Parallel to this, another line of research has focused on identifying and quantifying the factors behind changes in CO2 emissions using different methodologies. These include the structural decomposition approach (Rose and Casler, 1996), as well as analyses based on the index numbers theory (Ang and Zhang, 2000). Recently, some papers have proposed decompositions performed in the production theory framework (Zhou and Ang, 2008). In this paper, we use the simplest decomposition of the ratio of CO2 over GDP, or CO2 emission intensity, as a result of two mutually exclusive elements, namely energy intensity, defined as the ratio between energy consumption and GDP, and the so-called carbonisation index, defined as the ratio of CO2 over energy consumption. Then, we use the recent approach by Phillips and Sul (2007) to test for convergence clubs among OECD countries in CO2 emission intensity and its determinants. This approach tests for the existence of groups of countries sharing common traits regarding their convergence paths and has been previously used by Panopoulou and Pantelidis (2009) to explain club convergence in per capita CO2 emissions. Convergence in air emissions is at present a core concern for policymakers in developed economies that are currently working towards the long-run objective of achieving a fair distribution of emissions among countries. The results of this research aim to provide some insight into relevant issues such as whether some countries share common conver1.
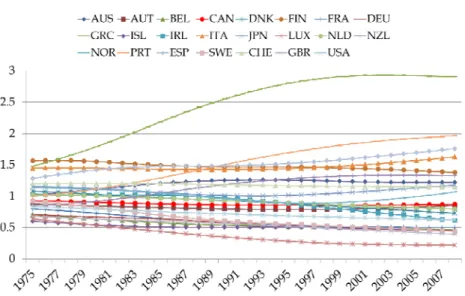
(3) gence patterns in CO2 emission intensity and its determinants. Furthermore, the fact that forecasts on air emissions made by several international organisations are based on the assumption of convergence (IPCC, 2007) adds interest to the results of this research. 2. Data and empirical results The data on CO2 emissions (kt), energy consumption (kt of oil equivalent) and GDP (millions of US$, base year 2000) have been obtained from the World Bank;1 the sample includes 23 OECD countries and covers the period 1960-2008. Furthermore, in order to avoid biases in favour of convergence around the GDP base year, we moved the base year to the beginning of the period; in addition, to minimise the distortions caused by this change, we have discarded the first 20 observations, as suggested by Phillips and Sul (2009). Using this dataset, we have separately applied the Phillips and Sul (2007) procedure to the ratio of CO2 over GDP and its two determinants. The results are in Table 1, while Figure 1 portrays the transition paths. Before commenting on these results, let us note that the best performing countries are those which attain lower ratios and, therefore, their transition paths also tend to converge to lower levels. Concerning the ratio of CO2 over GDP, four convergence clubs are found. The first one includes Greece (GRC) and Portugal (PRT), while the second one consists of Australia (AUS), Finland (FIN), Japan (JPN), New Zealand (NZL), Norway (NOR) and Switzerland (CHE), for which the transition path stands between 1.5 and 1 (Figure 1a).2 These two clubs record values greater than one and display a positive slope. The next group consists of Austria (AUT), Canada (CAN), Denmark (DNK) and the Netherlands (NLD), all of which converge below the average (between 0.85 and 0.7) and share a negative slope. The last club includes the majority of countries whose transition path is clearly below the average (around 0.5) and therefore have a lower level of CO2 emissions as a percentage of GDP; these countries are Belgium (BEL), France (FRA), Germany (DEU), Iceland (ISL), Ireland (IRL), Sweden (SWE) and the United Kingdom (GBR). In addition, all these countries display a trend toward further reductions. In contrast to this behaviour, there are four countries that do not converge to any club. However, not all of them are diverging for the same reasons: while Italy (ITA) and Spain (ESP) show an upward trend and their transitions are placed at the end of the sample between 2 and 1.5, Luxembourg (LUX) and the United States (USA) are well below 0.5 (especially Luxembourg) and maintain a trend toward additional reductions. The convergence-club results for the CO2 over energy consumption ratio, or carbonisation index, also point to the existence of four clubs. The first one includes Australia, Canada, Finland, Ireland, New Zealand and Norway. The transition paths of all the countries included in this club are above 1.2 and have an upward trend (Figure 1b). The countries in the second club are Greece, Italy, Japan, Portugal, Spain and the United States and their transition paths finish around 1.2. The third club consists of Austria, Denmark, Luxemburg and the United Kingdom, whose transition paths are close to the average. The countries in club 4 are Belgium, Germany and Sweden and are clearly performing much better than the average; their transitions are around 0.6 and display a downward trend. Finally, four countries are not included in any club: Switzerland, France, Iceland and the Nether1. Accessed on 23th March 2012 through http://databank.worldbank.org. Note that not all the countries that end their transition paths around 1.5 are included in the club. In fact, Italy (ITA) and Spain (ESP) are close to the transition path of Finland, but their trend is divergent in shape. 2. 2.
(4) lands. All of them share a clearly downward trend, although their transition levels are different, the lowest corresponding to Iceland and the highest to the Netherlands. Assuming that the probable drivers in the dynamics of this indicator are mainly the difference in energy sources (fossil versus renewables) among countries, together with distinct environmental legislation, the results obtained seem sensible. Concerning the results for convergence in the energy intensity ratio, we find less diversion in the dynamics of the convergence process (Figure 1c). The transition paths are closer together and, with a few exceptions, are concentrated between 1.5 and 0.5. The first club consists of the four relatively more energy-intensive countries (Greece, Iceland, Portugal and Spain) and their transition tends to divert from the average, signalling a worsening relative to other countries. The countries in the second convergence club are Italy, Japan, New Zealand and Switzerland and their transition, also with a positive slope, ranges narrowly from between 1.1 to 1.3. Clubs 3, 4 and 5 display negative slopes, so these countries tend to reduce energy intensity. Club 3 is very large and consists of Australia, Austria, Belgium, Finland, France, the Netherlands and Norway. Finally, club 4 includes Canada, Denmark, Germany and Sweden, whereas Ireland and the United States form a fifth club. The non-converging countries are Luxemburg and the United Kingdom. Finally, as proposed by Phillips and Sul (2009), we have tested whether some of the clubs identified can be merged into larger groups. While no mergers are found in emission intensity and energy intensity, clubs 2 and 3 can be merged into a larger club of ten countries for the carbonisation index. 3. Discussion and conclusions We are able to identify groups of countries that converge to different equilibria in the CO2 over GDP relationship for the majority of OECD countries, which confirms most of the previous results obtained in this literature. Concerning the members of the convergence groups, some countries from Central and Northern Europe can be included in a club consisting of the best performers. In contrast, the club of worst performers includes two countries from Southern Europe, Greece and Portugal; in addition other Mediterranean European countries, such as Italy and Spain, are not converging. This paper analyses convergence in emissions intensity and its components, energy intensity and the carbonisation index. Although inter-groups convergence seems to be higher in the carbonisation index, the dynamics of individual countries within groups indicates greater convergence in the energy intensity ratio. This evidence is in line with the findings of Padilla and Duro (2001), who use a methodology based on the Theil index and the Kaya decomposition to analyse inequalities in CO2 per capita emissions in the European Union. According to our results, a sensible interpretation would be that differences in the convergence of the CO2 over GDP ratio are mostly driven by differences in the carbonisation index, that is, in the energy mix, rather than by differences in energy intensity. Differences in energy intensities are the outcome of different technical efficiencies in the use of energy, as well as different production structures. These differences are not expected to be very significant in the OECD area. However, differences in the carbonisation index are reflecting the important disparities in energy sources (fossil fuels, like coal, versus renewables and nuclear power) among OECD countries. Therefore, our results indicate that more environmental regulation in OECD countries is probably required to foster the environmentally efficient use of energy, moving, for example, toward cleaner sources of energy.. 3.
(5) Finally, in our opinion, the approach taken in this paper to analyse air emissions convergence adds new insight to the current literature. In particular, our contribution may shed some light on issues that would have remained unaccounted for in more conventional approaches to convergence; for example, Ireland shares a convergence path with some of the best performers in energy intensity, whereas it has common convergence features with the group of worst performers regarding the carbonisation index. Acknowledgements. We are grateful for the financial support from the Spanish Ministry of Economy and Competitiveness (ECO2011-30260-C03-01 and ECO2012-32189) and the Generalitat Valenciana (PROMETEO 2009/098). References Ang, B.W., Zhang, F.Q., 2000. A survey of index decomposition analysis in energy and environmental analysis. Energy 25, 1149–1176. Barassi, M.R., Cole, M.A., Elliott, R.J.R., 2011. The stochastic convergence of CO2 emissions: A long memory approach. Environmental and Resource Economics 49, 367–385. International Panel for Climate Change (IPCC), 2007. Climate change 2007: The physical science basis. In Solomon, S. et al. (Eds.). Cambridge University Press. Cambridge, UK. Jobert, Th., Karanfil, F., Tykhonenko, A., 2010. Convergence of per capita carbon dioxide emissions in the EU: Legend or reality? Energy Economics 32, 1364-1373. Padilla, E., Duro, J.A. , 2011. Explanatory factors of CO2 per capita emission inequality in the European Union. Document de Treball 11.07. Departament d’Economia Aplicada. Universitat Autóma de Barcelona. Panopoulou, E., Pantelidis, T., 2009. Club convergence in carbon dioxide emissions. Environmental and Resource Economics 44, 47–70. Phillips, P.C.B, Sul, D., 2007. Transition modeling and econometric convergence tests. Econometrica 75(6), 1771–1855. Phillips, P.C.B., Sul, D., 2009. Economic transition and growth. Journal of Applied Econometrics 24, 1153–1185. Romero-Ávila D., 2008. Convergence in carbon dioxide emissions among industrialized countries revisited. Energy Economics 30, 2265–2282. Rose, A., Casler, S., 1996. Input–output structural decomposition analysis: a critical appraisal. Economic Systems Research 8, 33–62. Westerlund, J., Basher, S.A., 2007. Testing for convergence in carbon dioxide emissions using a century of panel data. Environmental and Resource Economics 40(1), 109–120. Zhou, P., Ang, B.W., 2008. CO2 emissions: a production-theoretical approach. Energy Economics 30, 1054–1067.. 4.
(6) Table 1: Convergence club classification CO2 over GDP (emission intensity) Club 1 [GRC, PRT] log t 0.205. t-stat 4.488. CO2 over energy consumption (carbonisation index). Energy consumption over GDP (energy intensity). Club 1 [AUS, CAN, FIN, IRL, NZL, NOR] log t t-stat 0.366 3.744. Club 1 [GRC, ISL, PRT, ESP] log t 0.447. t-stat 4.834. Club 2 [AUS, FIN, JPN, NZL, NOR, CHE] log t t-stat 0.761 3.826. Club 2 [GRC, ITA, JPN, PRT, ESP, USA] log t t-stat 0.587 3.987. Club 2 [ITA, JPN, NZL, CHE]. Club 3 [AUT, CAN, DNK, NLD]. Club 3 [AUT, DNK, LUX, GBR]. Club 3 [AUS, AUT, BEL, FIN, FRA, NZL, NOR] log t t-stat 0.622 18.041. log t 0.160. t-stat 0.351. Club 4 [BEL, FRA, DEU, ISL, IRL, SWE, GBR] log t t-stat 0.436 8.158. log t 0.534. t-stat 3.379. log t 0.512. t-stat 4.084. Club 4. Club 4. [BEL, DEU, SWE]. [CAN, DNK, DEU, SWE]. log t 0.652. t-stat 5.034. log t 1.439. t-stat 6.497. Club 5 [IRL, USA] log t t-stat 0.751 0.441 Non-converging [ITA, LUX, USA, ESP]. Non-converging [CHE, FRA, ISL, NLD]. 5. Non-converging [LUX, GBR].
(7) Figure 1: Transition paths Figure 1a: CO2 emissions over GDP (emission intensity). Figure 1b: CO2 emissions over energy consumption (carbonisation index). Figure 1c: Energy consumption over GDP (energy intensity). 6.
(8)
Figure
Documento similar
We analyse the evolution of production by sector in Agriculture, Industry and Services in China and India in comparison with the European Union, United States, Japan and other
Six of these 15 metropolitan areas have the distinction of constituting cross-border territories (Aire métropolitaine de Lille, Région métropolitaine Côte d’Opale-Flandre
Figure 6 demonstrates that the share of intangible capital in the wholesale and retail trade and motor vehicle repair industry was relatively greater in Latvia but that,
Thereby, it is capital to understand the behavior of series of CO2 emissions, energy consumption and eco- nomic growth, as these variables are critical for the effective and
Therefore, the results for club convergence support weak convergence for the whole sample of countries, as the null hypothesis of overall convergence is rejected
This paper estimates the evolution of the total energy use over the period 1995–2015 in four European Union (EU) countries, the Czech Republic, Hungary, Italy, and
In order to analyse the net outward investment position of these OECD countries, we initially estimate country-wise regressions using GDP as the only explanatory
In the best case, these actions only will help prevent further emissions of CO2 into the atmosphere, which are called carbon- neutral strategies (Lehmann, 2007a). Other uses are
