Principal component analysis for automatic tag suggestion / Enrique Estellés Arolas, Fernando González Ladrón de Guevara and Antonio Falcó Montesinos
31
0
0
Texto completo
(2) Cover Letter. Principal Component Analysis for Automatic Tag Suggestion Enrique Estellés Arolasa, Fernando González Ladrón de Guevarab, Antonio Falcó Montesinosc a. CEU-Cardenal Herrera University, Ed. Seminario, 46113, Moncada (Valencia), Spain.. [email protected] b. Technical University of Valencia, Camino de Vera s/n, 46022, Valencia, Spain.. [email protected] c. CEU-Cardenal Herrera University, Ed. Seminario, 46113, Moncada (Valencia), Spain.. [email protected]. Corresponding author: Enrique Estellés Arolas Mail address: [email protected] Postal address: Avenida Alfahuir 39, bloque 2 puerta 4. 46019. Valencia, SPAIN Phone number 1: +0034689435554 Phone Lumber 2: +0034960715496.
(3) *Manuscript Click here to view linked References. Principal Component Analysis for Automatic Tag Suggestion Enrique Estellés Arolas, Fernando González Ladrón de Guevara, Antonio Falcó Montesinos Abstract Nowadays, due to the rapid development of Web 2.0, computer applications with a distinct social nature are being increasingly used. Among these, in research or team work tasks, social bookmarking management systems as Delicious or Diigo must be pointed out. These applications are based on URLs that store (the web resources they mark) and the tags they use to describe them. Regarding the latter, recent studies show that more than 50% of the tags used to mark a URL can be specifically found in the title or text of the page. This paper proposes to use Singular Value Decomposition (SVD) and Principal Component Analysis (PCA) in order to extract all those terms that are more relevant in a web site marked in a social bookmarking application. Thus, the user will only obtain those tags appearing explicitly on the marked site and he will only have to think and introduce those that do not appear on it. Keywords: social bookmarking, singular value decomposition, principal component analysis, tagging, automatic suggestion 1. Introduction The development of Web 2.0 involves a change in the know-how in the internet field, which has become user-centred. In Web 1.0, the main objective was to publish; now the objective (among others) is to participate. The proliferation of Web 2.0 social network applications and tools, which are based on participation, cooperation and sharing resources, proves that change. Regarding the types of tools mainly used in cooperative work in the field of education or research, Social Bookmarking Systems (SBS) must be mentioned. Through these types of tools users can store different web resources by describing them with tags, which are just keywords that help to organize those resources (Olivera et al, 2008). As for the resources, they can be of different types depending on the nature of the SBS. Diigo or delicious deal with web sites, Digg deals with news and others with images (Flickr) or even bibliographic references (CiteULike). Regardless the content these SBS manage, they all have in common a series of characteristics, especially two, namely: they deal with resources that are shared by users and tags are used to describe them. These tags are requested to users, so it still is a manual process. So it occasionally happens that tags are not properly filled, which makes this resource less effective. This is because in the SBS the research and browsing process is possible through tags, through a technique known as pivot browsing (Millen, Whittaker & Yang, 2007; Bateman et al., 2009). The pivot browsing technique involves the ability to re-direct the browsing sight by clicking on.
(4) specific elements of the user interface: users‘ names -through which all the resources marked by the user will be shown-, and tags –which will show the resources marked with those tags (Millen et al., 2005). In this paper a methodology to extract automatically a series of tags from a given text is proposed, so that the user will not have to bother to add them, he will only have to select them. This methodology has been tested upon a set of marked resources of the SBS Delicious, and positive results have been reached. It shows that tags used by users were obtained, as well as others news, which helps to enrich the various taxonomies. This paper is organized as follows. The second section consists of a brief description of the progress that has been made in the field of automatic suggestion of tags so far. The third section introduces the theory about SBS and the mathematic tools used, in this case, to obtain tags, i.e – the singular value decomposition (SVD) and the principal component analysis (PCA). The fourth section is an explanation of the methodology that has been applied. In the fifth section results will be shown and analyzed. Finally, in the sixth section possible improvements and future directions will be taken into consideration. 2. Related Work Apart from some research analyzing, from a holistic point of view, how social bookmarking systems work (Hammond et al., 2005; Lund et al., 2005), the automatic suggestion of tags has not been fully considered as a topic research so far. The research that has been carried out into this topic up to now shows different ways to obtain tags, highlighted among them the use of collaborative filtering and the content of documents. It is worth mentioning that, even though various studies and methods are going to be classified for the automatic suggestion of tags, these methods are applied by combining different approaches. Regarding collaborative filtering, it must be pointed out that it is a subject that has been studied for a long time (Resnick et al., 1994; Resnick, 1997) and it has also been used in eCommerce systems (Sarwar et al., 2001). Within this approach, in regard to tags suggestion, different studies can be found. Xu et al. (2006) proposes a system of tags suggestion based on the collaborative filtering sustained by the HITS algorithm. They describe a set of general criteria that a tag must meet to be considered as good, causing no noise and no spam. Among these criteria some can be named –high coverage of multiple faces to ensure good recall, least effort to reduce the cost involved in browsing or high popularity to ensure tag quality. Jäsche et al. (2007) suggest two algorithms: a graph-based recommender built on top of FolkRank, which is an adapted version of the PageRank algorithm; and an adapted version of the user-based collaborative filtering. The latter is based on techniques of traditional collaborative filtering, where two matrices are used: one of users per resources and another of users per tags. This way,.
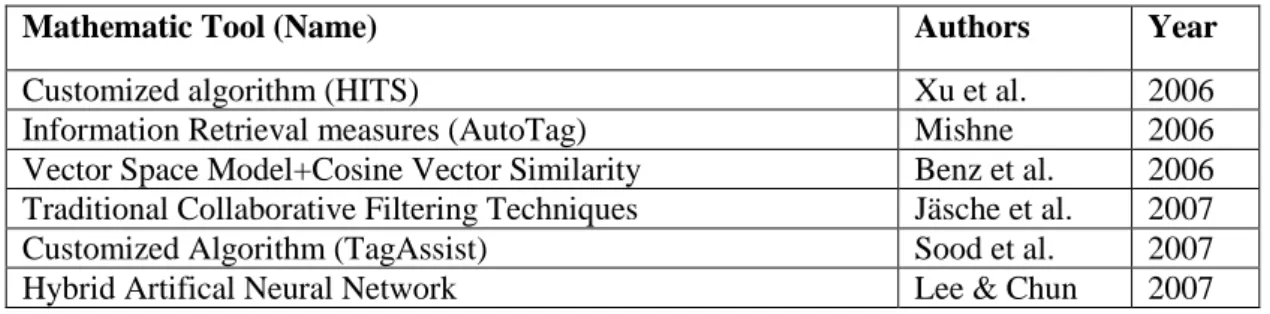
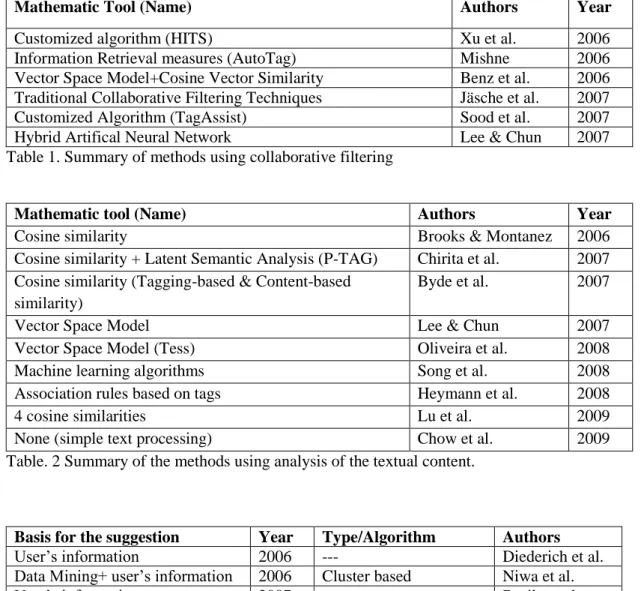
(5) different sets of similar users can be determined (users sharing tags as well as resources) and also different sets of tags shared by those users, thereby maximizing the degree of similarity. When a resource is going to be marked, the tags used by other users are classified according to their relevance and only the most significant ones are suggested. Mishne (2006) develops a system of automatic recommendation of tags for blog posts called AutoTag. In this system, similar tags are assumed to be suitable to similar blog posts, so it suggests tags for a blog entry by examining the tags assigned to similar entries. Firstly, it applies information retrieval measures to estimate the similarity between blog posts and to find similar posts for a determined post. Then, the tag is assessed by using the frequency and, finally, the value of all the tags used by an active user is increased. Sood et al. (2007) develop a system called TagAssist. They apply technology in order to improve the performance of tag suggestion in blogs, by providing 5 assessment parameters to appraise tags: tag frequency in different resources, frequency of occurrence in the text, tag frequency occurrence in the training corpus, the blog rank where the post to be tagged appears and the category of membership of a pre-determined cluster. Lee and Chun‘s (2007) approach to automatic suggestion of tags for blogs uses collective intelligence taken out of Web 2.0, collaborative tagging as well as word semantics to learn how to predict the best set of tags to be used, using a hybrid artificial neural network. Finally, Benz et al. (2006) suggest another solution based on two different strategies. The first one, known as information filtering or content-based filtering, obtains information upon the user‘s past behavior, i.e, upon the markers she previously stored. The second one, called collaborative filtering, takes into account the behavior of other users, especially of those having similar interests to the user‘s. The basic idea involves finding similar users that have classified markers and then obtaining recommendations about where the user can store her marker. Mathematic Tool (Name) Customized algorithm (HITS) Information Retrieval measures (AutoTag) Vector Space Model+Cosine Vector Similarity Traditional Collaborative Filtering Techniques Customized Algorithm (TagAssist) Hybrid Artifical Neural Network Table 1. Summary of methods using collaborative filtering. Authors. Year. Xu et al. Mishne Benz et al. Jäsche et al. Sood et al. Lee & Chun. 2006 2006 2006 2007 2007 2007. The other common way to obtain tags automatically, which will be the one applied in this paper, is through the analysis of the textual content of the documents or resources. Chirita et al. (2007) propose a system to add tags according to the content of the web documents and documents stored in the user‘s computer, which are analyzed through a series of techniques such as the extraction of keywords and phrases from similar documents. The aim, in this case, is.
(6) to tag a resource according to the user‘s preferences. Byde‘s et al. (2007) approach involves suggesting tags taking as a starting point the web content and the tags previously used by the user. Lee and Chun (2007), apart from the method based on the collaborative filtering, suggest another algorithm based on the use of the vector space model, a popular information filtering model for textual material, to find similar documents (posts) and extract possible tags with extra information for the user. Oliveira et al. (2008) have developed a system of tag suggestion called Tess, based on the vector space model to represent and index the resources. This system works examining the documents already present in the system and the new document, for which tags should be suggested (called query document). In order to select the tags, they use two algorithms. The first one processes the query document and modifies it in order to acquire all the words that might be useful to describe it (vector displacement). The words are ranked, according to a given importance measure and the top ranked subset is selected as the tags to be presented (tag extraction). Other researchers who also use vector space model (together with a new Gaussian model) as model are Song et al. (2008). These use machine learning algorithms to predict tags based on content. The results are promising but limited to the use of the two algorithms that have been specified. Heymann et al. (2008), on their part, propose a set of association rules based on tags previously used that allow a very accurate prediction of other possible tags. They take as a starting point the text of the web site, the text of the links and other tags applied to the URL. Lu et al. (2009) suggest a method where each page can share the tags that identify it with similar pages. The spreading of tags depends on their relevance in the original page and on the degree of similarity between the page that spreads it and the page that receives it. In order to calculate the degree of similarity between documents a lineal combination is defined between 4 cosine similarities, without ignoring neither the tag information nor the content of the page. Others who have also worked on this area are Brooks and Montanez (2006), where extracted keywords are used as tags and are considered terms of great value depending on the value TFIDF (term frequency-inverse document frequency) obtained. Also Chow et al. (2009) apply their system to an e-learning 2.0 application by creating an adequate number of tags from the lecture slide contents. Mathematic tool (Name) Cosine similarity Cosine similarity + Latent Semantic Analysis (P-TAG) Cosine similarity (Tagging-based & Content-based similarity) Vector Space Model Vector Space Model (Tess) Machine learning algorithms. Authors Brooks & Montanez Chirita et al. Byde et al.. Year 2006 2007 2007. Lee & Chun Oliveira et al. Song et al.. 2007 2008 2008.
(7) Association rules based on tags Heymann et al. 4 cosine similarities Lu et al. None (simple text processing) Chow et al. Table. 2 Summary of the methods using analysis of the textual content.. 2008 2009 2009. Apart from collaborative filtering methods and the analysis of the textual content of documents, there are many others that allow the development of efficient tag suggestion systems. There are systems that obtain tags through semantic methods. Wu et al. (2009), for instance, propose a multi-modality recommendation based on both tag and visual correlation, and suggest that correlation of tags as a learning question. Each modality is used to generate a ranking feature, and the algorithm RankBoost is applied in order to learn a top-quality combination of these ranking features of different modalities. The algorithm suggested by Zhang et al. (2009) has two different methods, one of which is based on the semantic content of the text. It is a tag recommendation method combined with the so-called Language Model, which is broadly used in natural language processing applications, and with the ACT (author-Conference-Topic) topic model. Also Data Mining (DM) is to be found within this area, where methods as KNN (K-nearest neighbor) (Fujimura et al.,2007) have been used. Another big area of interest is the suggestion of tags by using specific information from the user. For instance, Diedrich et al. (2006) use tags profiles created by users where their preferences and interests are reflected. Their system uses this profile to recommend tags to users. Niwa et al. (2006) propose a cluster-based algorithm that is based on webs the users tag to recommend webs as well as tags. These two algorithms base their recommendation on the similarity of TF-IDF tag profile vector tags. Basile et al. (2007) propose a smart tag recommender able to learn from past user interaction and from the content of the resources that annotated. Based on Item Recommender (a content-based recommender), the aim of the system is to support users in social bookmarking systems by providing a list of new tags. Vatturi et al. (2008) use graph-based ranking algorithm of multiple types of interrelated objects for a personalized recommendation. They use documents for the relevance and tags annotated by users for the personalization. There also exist the so-called real-time suggestion systems. These are systems to be used in the web, so the response time mustn‘t be long. Song et al. (2008b) implement a real-time tag suggestion system in order to solve the problem of the automatic recommendation of tags for documents search engines and digital libraries. It is based on vector space model and a Poisson mixture model and it takes 1 second to tag a document..
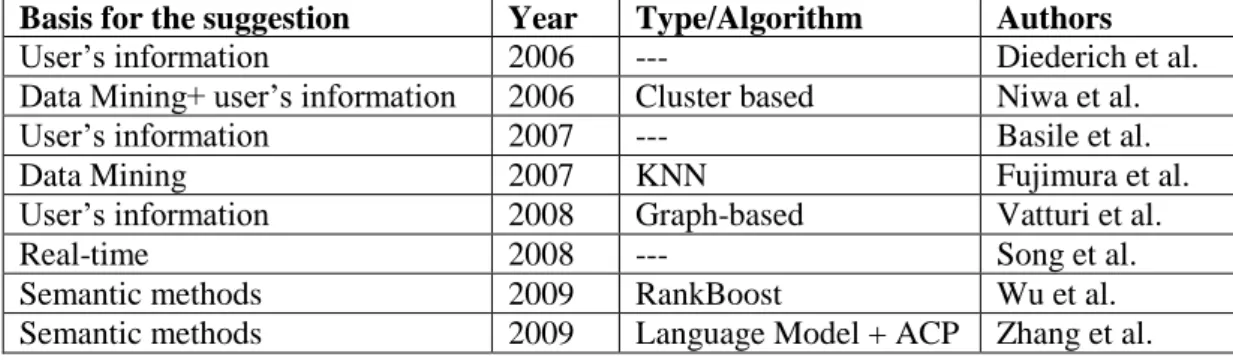
(8) Basis for the suggestion Year Type/Algorithm User‘s information 2006 --Data Mining+ user‘s information 2006 Cluster based User‘s information 2007 --Data Mining 2007 KNN User‘s information 2008 Graph-based Real-time 2008 --Semantic methods 2009 RankBoost Semantic methods 2009 Language Model + ACP Table 3. Summary of methods applying different techniques. Authors Diederich et al. Niwa et al. Basile et al. Fujimura et al. Vatturi et al. Song et al. Wu et al. Zhang et al.. The method proposed in this paper is based on the textual information of the document, in this case of a web site, to be used in a real-time context where the tags are to be used, such as some of the applications developed in web context: social bookmarking systems or blogs, for instance. Our method allows to obtain the most significant terms in a web document through a series of algorithms and tools in an adequate time span for this context. 3. Theoretical background Now there is a brief introduction of the three elements taking part in the method to be presented in this paper: social bookmarking systems (taking into consideration the use of tags in them), singular value decomposition and principal component analysis. The two last algebraic tools have been used previously (Lee et al., 2003) to extract the most significant terms in automatic document summary tasks. 3.1 Social Bookmarking Systems & tagging Social Bookmarking Systems (SBS) are a type of web 2.0 tools that allow to store, share and describe resources of different types found on the internet. This description of the resources is carried out by assigning metadata (data about data), which can be (Zubiaga et al., 2009): . Labels or terms that define and characterize the resource. They can be names, acronyms, numbers or any chain of text with no restrictions on format and meaning.. . Notes or comments. A brief chunk of text that freely describes the content of the resource.. . Highlight. Once authenticated in the SBS, some of them, as Diigo (Estellés et al., 2010), allow to highlight relevant chunks of text.. . Revisions. Texts that assess the content of a resource.. . Assessments. Personal comments or marks that show whether the user liked a specific resource or not, and how much. It can be ranked from 1 to 5, for example..
(9) As it has already been said, there are different SBS specialized on specific resources: Diigo or Delicious on web sites; Flickr on images; CiteUlike on references; Tagzania on places, etc. However, they are all similar from a functional point of view. Once the user has been authenticated in the system, he can add resources and mark them with labels or tags. The collection of all the tags a user assigns is called personomy, and the collection of personomies is a folksonomy. Regarding the use of labels as metadata, it will be this folksonomy which constitutes the central structure of data or fundamental unit of every SBS (Illig et al., 2009). This term was coined by Thomas Vander Wal and it comes from the combination of the words ‗folk‘, which means ‗people‘ and the word ‗taxonomy‘, which means classification (Smith, 2004). It is an organic system of organization, a way of social classification through tags. That is the reason why SBS can be considered a Social Tagging System. Folksonomies can be explored by other users through the well-known pivot browsing in three different ways (Millen et al., 2007; Bateman et al., 2009): firstly, all the resources of a user can be seen; secondly, by clicking on a resource, it can be seen that other users have also added it and the labels they have annotated; and thirdly, by clicking on a tag, it can be seen who have assigned it to what resources. Formally, a folksonomy is defined as the tuple F := (U,T,R,Y), where U is a finite set of users, T is a finite set of tags, R is a finite set of resources and Y is a three-deal relation between users, tags and resources. An element (u,t,r) of Y, called tag assignment represents the fact that a user u has assigned a tag t to a resource r (Hotho et al., 2006, Yang et al., 2009, Si et al., 2009). Unlike taxonomies (or classifications), where there exist multiple types of hierarchical relations, folksonomies do not present these types of relations between the terms included. They are just words that a group of users have used to describe a specific content (Mathes, 2004, Hamond et al., 2005). The use of tags has a series of characteristics that must be pointed out: . Tags can be classified as implicit or explicit. Explicit tags, or obvious, are those tags appearing in the content of the resource, within the title or the text itself. These are useful descriptors and are helpful in the search processes. Implicit tags, or non-obvious, are those tags that do not appear in the text. They provide a greater intellectual value because they relate the content with words that do not appear in it. Although there are authors that consider them the best tags (Farooq et al., 2007), we think that a tag is good as far as it helps to identify or find a resource, regardless whether it appears or not in the text. By ‗identifying a resource‘ we refer to finding a specific resource the user was searching or finding a resource that meets, for its content, specific search parameters..
(10) . The selection of tags by the user is a process characterized by a high degree of subjectivity. Users will select specific tags according to the aspect of the resource they find more relevant, and it doesn‘t need to coincide with the opinion of other user. This enables the identification of particular interests, thereby allowing users to use more familiar vocabulary. This fact can make two users describe with different words the same aspect of a given resource. (Li et al., 2009).. . Users‘ tagging behavior will depend on several factors: personal interests, knowledge domain, and the willingness to organize resources (Farooq et al., 2007).. Apart from these characteristics, using tags also involves a series of limitations that arise because of the lack of homogeneity and agreement on how to define tags (Mathes, 2004): . The use of excessively subjective tags. For example, tags with extremely personal meanings, which do not mean the same for the rest of the users.. . The use of words in singular or plural.. . The inconsistent use of capital letters in different languages.. . The use of simple or complex words to define the same thing.. In an attempt to solve these problems, some SBS have reached an agreement on the use of a limited vocabulary. A way to use this limited vocabulary is applied in the SBS Delicious: when a user starts introducing a tag, the system shows her those tags that start in the same way and that have been introduced previously, thereby allowing a direct selection. However, the use of a limited vocabulary as well as the suggestion of tags previously annotated in order to keep uniformity have also their drawbacks, because it happens that occasionally the same tag is used with different meanings and the use of synonyms and acronyms makes it more unclear. 3.2 Principal Component Analysis (PCA) The Principal Component Analysis (PCA) is an algebraic tool that is useful in many ways: for pattern recognition (Zhaoqu & Xueyong, 2000), for signal processing (Xiangbai et al., 2004, Castells et al., 2007), for picture processing (Mudrová & Procházka, 2005) or the extraction of characteristics (Rosipal et al., 2001). However, its two main aims are the reduction and interpretation of data (understanding ‗reduction of data‘ as compression). What PCA particularly intends to do is to reduce the dimensions of data set with a high degree of dimensions and at the same time it tries to keep, as much as possible, the variation present in that set of data (Johnson, R. & Wichern, D., 1992). The PCA enables to find orthogonal transformations of the variables that constitute the dimensions of the data in order to achieve a new set of uncorrelated variables called principal components. By doing so, it is expected that.
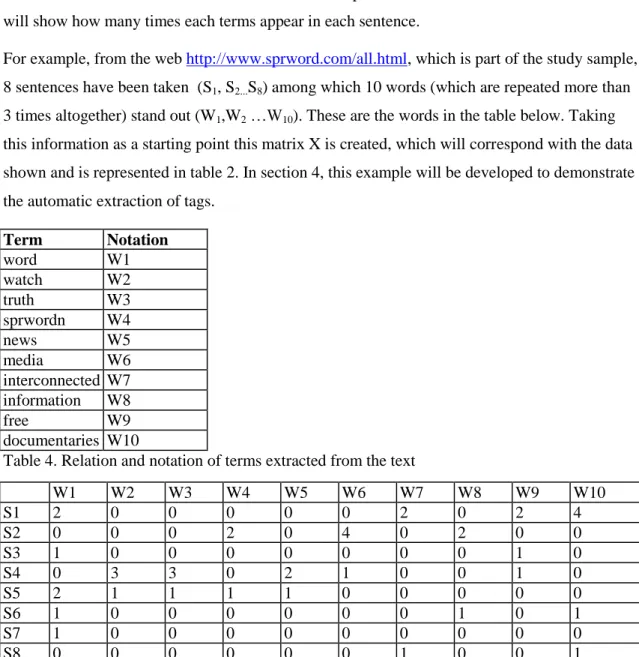
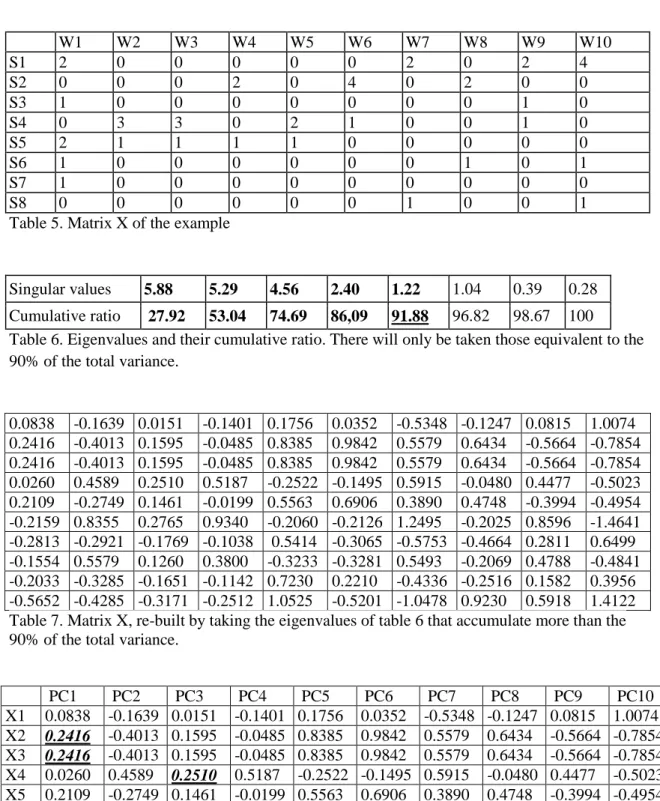
(11) with only few components (because they are lineal combinations of original variables) most of the variability of the data can be taken, which means most of the information available. Although Factorial Analysis is related to it, the PCA is different from it because it explains the variability and not the correlations there can be. Even so, for the PCA to be useful it is necessary to find a high degree of correlation between the variables, which implies redundant information. The PCA can be applied to any set of data consisting of a list of measures, which can be easily represented by a matrix (Gan et al., 2007). In this matrix, that we will call Xnp, each column is associated to a specific variable, representing a specific dimension of the data set. So, p describes the number of dimensions of the data set. On the other hand, each row Xi for i=1,2…n, represents a specific case of the data set. In this problem, as in Lee et al., (2003), Lee at al., (2005a) and Lee at al., (2005b), p will be the set of words that constitute a specific text while n will be the set of sentences that constitute a specific web document. The different values will show how many times each terms appear in each sentence. For example, from the web http://www.sprword.com/all.html, which is part of the study sample, 8 sentences have been taken (S1, S2...S8) among which 10 words (which are repeated more than 3 times altogether) stand out (W1,W2 …W10). These are the words in the table below. Taking this information as a starting point this matrix X is created, which will correspond with the data shown and is represented in table 2. In section 4, this example will be developed to demonstrate the automatic extraction of tags. Term Notation word W1 watch W2 truth W3 sprwordn W4 news W5 media W6 interconnected W7 information W8 free W9 documentaries W10 Table 4. Relation and notation of terms extracted from the text S1 S2 S3 S4 S5 S6 S7 S8. W1 2 0 1 0 2 1 1 0. W2 0 0 0 3 1 0 0 0. W3 0 0 0 3 1 0 0 0. W4 0 2 0 0 1 0 0 0. W5 0 0 0 2 1 0 0 0. W6 0 4 0 1 0 0 0 0. W7 2 0 0 0 0 0 0 1. W8 0 2 0 0 0 1 0 0. W9 2 0 1 1 0 0 0 0. W10 4 0 0 0 0 1 0 1.
(12) Table 5. Matrix X of the example On the other hand, it is necessary to know the covariance matrix of X in order to obtain the PCA, where S=var(X). This matrix S can be decomposed in other three matrices S=TT’ where T=[t1, t2, … , tp] and =diag(1, 2, … p). It is important to mention that this decomposition is the same as the one in SVD (singular value decomposition), which will be described hereafter, because the result of the PCA is the same of that of applying the SVD to the covariance matrix. Coming back to the theoretical explanation, the principal components of X are calculated as follows: Yj=X·tj , where for each j, the new variable Y is built upon the j-tieth eigenvector of S. Due to T’·T = T·T’ = I , we will have that the principal components have a decreasing variance (which means that the first components will have more information than the following ones) and they are uncorrelated. In order to obtain tags, those Yj values of higher value will be taken, as it can be seen in the example in section 4 hereafter. 3.3 Singular Value Decomposition Within linear algebra, matrix decomposition (or the canonical form of a matrix) is a factorization of a matrix into two or more. Within the best known decompositions there can be found, for instance, the QR or the LU. Regarding the Singular Value Decomposition (SVD), it is one of the most useful factorizations in applied linear algebra and it has reached a privileged position for various reasons (Stewart, 1993). Its applications in the real word are diverse: it has numerical applications, as calculating the rank of a matrix or finding the pseudoinverse of a matrix (Lay 1997), it is also useful for some image compression techniques (González et al., 2004); Kropatsch et al., 2001), for the analysis of temporal series (Sánchez & Ortiz, 2002a; Sánchez & Ortiz, 2002b; Seng & Huang, 2005), for noise reduction (De Lathauwer et al., 2000; Poon et al., 1993) or even for gen expression (Wall et al., 2003) or quantum computing (Nielsen and Chuang, 2000), among other fields of applications. Since SVD is a type of matrix decomposition, in this specific case a matrix Amn is factorized into 3 different matrices resulting in Amn U mm · mn ·Vnn (3.1) where . U m m is a matrix which constitutes a unitary or orthonormal basis, and obviously also an orthogonal basis, where its inverse is equivalent to its transpose. Its columns are called ‗left singular vectors of A’ and they are the eigenvectors of the matrix A·AT.. . D 0 mm is an orthogonal diagonal matrix of mxm dimensions of the form 1/ 2 , 0 0 where D, since r is rank of A, is a diagonal matrix r x r for some r which is not higher than.
(13) the lowest value of the dimensions m and n. Its diagonal entries will be the r first singular values of a matrix A, which are defined as the non-negative square roots of the proper values of a symmetric matrix A·AT, also defined as non-negative and identified by 1... n , where i . i for 1 i n. It can be easily inferred that if A is of rank r, will have r non-zero singular values.. singular values of A show the length of vectors A v1... A v n and they follow a These decreasing order, from highest to lowest 1 2 ... r 0 (3.2) so the representation of is. 1 0 0 2 ... ... 0 0 . . ... ... ... .... 0 0 0 r . . . A matrix Vn n which constitutes a unitary and orthonormal basis, and obviously also an orthogonal basis, where its inverse is equivalent to its transpose. Its columns are called ‗singular right vectors of A‘ and they are eigenvectors of the matrix AT·A.. After the description of each matrix, it can be inferred that (3.1) could be expressed as follows. Amn. 1 0 0 {u1,...,ur } 0 ... 0 {v1T ,...,v Tr } (3.3) 0 0 r . So (3.3) could be decomposed in a summation of matrices of unitary rank i ui vit , so. . A i 0 i ui vit y. ,. then the matrix A can be approximated through a truncated summation and taking only into account the k first singular values. Ak U k · k ·VkT (3.4) or. Ak i ui v it k. i 0. This way, the first k singular values would be kept, which is equivalent to keeping the first k. . rows of y VT and the first k columns of U. This is the approximation theorem (or ‗fundamental theorem of SVD‘) developed by E. Schmidt and its result is also known as ‗Reduced SVD‘..
(14) It is obvious that this approximation will lead to an error Ek, which will be minimized only if the singular values have been ordered in , so i 1 i as in (3.2). 4. Methodology The main aim of this paper is to show how the textual content of a web can be analyzed though SVD and PCA in order to extract possible explicit tags that are suggested to the user for him to use them as metadata for a marked link or resource. The procedure involves obtaining from any text (in this case any textual content of any HTML valid label) a matrix sentences-terms A, as the one described in table 5. In these types of matrices, the rows represent the sentences that can be found in a text and the columns represent the individual words which constitute the text. Thus, Aij will show how many times that word j appears in sentence i in the text. Once the matrix sentences-terms A has been obtained, the SVD is firstly applied and then the PCA. The SVD is used to reduce the noise caused by the variability in the use of terms. The PCA allows the extraction of the most significant terms because it can explain the structure variancecovariance of a matrix through some lineal combinations between original variables (Lee et al., 2005). To sum up, in order to carry out this research we have followed these stages: re-collection of webs and their corresponding tags, web processing for the extraction of terms and sentences, creation of matrices terms-sentences, application of SVD and PCA and a final analysis of the results. With this purposes, a series of Java programs have been developed as well as a MatLab script. There follows a detailed explanation of each stage. 4.1 Re-collection of webs To collect webs, one of the most famous social bookmarking systems has been used: Delicious. In particular, we have accessed a list of links and tags available from the section ‗Hotlist‘ (http://delicious.com/?view=hotlist), from where users can access the most popular bookmarks on Delicious at a given moment. Through this section the user can gain access to an undefined number of pages, each of which show 10 marked links on Delicious. For each one of these links it is shown: the title of the web, the tags that have been used, the amount of users that have marked it and a little screenshot of that site. The stored webs have to meet some conditions: they must be active, they must have been marked with one or more tags and they must be written in English. The last demand –it must be written in English- is due to the convenience of using only one language, because most of the stored URLs are written in that language. This has allowed us to achieve a wider sample..
(15) The first 770 pages available from this section have been analyzed in two different days: on the 3/7/2010 and 3/8/2010. Each of these sites has 10 marked web resources, whose corresponding URL and tags have been stored in a database. It has been avoided to store those URLs that were repeated, those that did not meet the previous standards (i.e. they didn‘t have tags, they weren‘t active, and they were not written in English) and those with no textual content. A total amount of 15.400 webs have been analyzed and only 13.746 of them have been stored for the reasons stated above. All this analyzed information is stored in a simple database consisting of two tables: one is for the webs, where it must appear an identifier, its URL, the amount of corresponding tags and how many of them are explicit (appear in the web site text); and another for tags, where it must appear the identifier of the web where it belongs, the tag itself, whether it is an explicit tag (it appears in the web site text) and how many times it appears in that text. It is obvious that only through this first analysis there are fields that cannot be filled: whether it is and explicit tag or not, the amount of explicit tags or how many times a tag appears in the text. This information will be completed in following steps. 4.2 Web processing and creation of matrices terms-sentences Once the URLs and their corresponding tags have been stored in the database, the following step involves creating the matrices terms-sentences that have made it possible to obtain the most significant terms. To scan each web internally and extract the text to be processed, it has been used the library ―HTMLParser‖ (http://jericho.htmlparser.net/docs/index.html). Thus, the program scans and stores the content of determined HTML labels: a, title, p, div, span and h1. The selection of these labels has been applied according to a study that has been carried out and it has not been published yet. According to this research, in a sample of 137,745 webs marked with labels, these html labels contain approximately 70% of the explicit tags. Once the text has been extracted, the application proceeds to a two-step filtering process: 1.. All those terms that are irrelevant are eliminated, such as adverbs, prepositions, etc. These are known as stop-words. With this purpose a widely used English stopword list has been used (http://ir.dcs.gla.ac.uk/resources/linguistic_utils/stop_words) together with our own stopword dictionary.. 2.. Those terms that do not appear n times are eliminated. In the case of Lee et al. (2005), where the most relevant terms are extracted from journalistic articles, those terms that do not appear at least twice are eliminated. Since Lee et al. extract the most relevant terms from a text written in Korean, language which has around 70,000 terms.
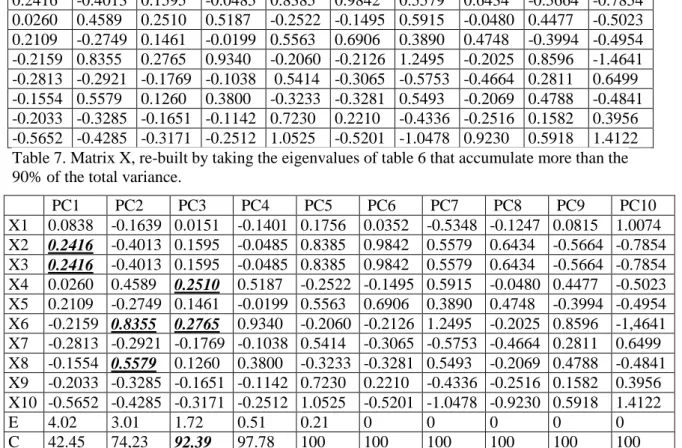
(16) (http://korean.go.kr/09_new/AttachFiles/News/nikl_eng.pdf) and taking into account that we have worked on texts written in English consisting of around 5000,000 words, it must be considered an increase in the word occurrence frequency. On the other hand, in the above mentioned study, carried out by the same authors of the present paper, it is shown that explicit tags appear in the text an average of 4 times. That is the reason why the value of n will be 4. After this double process, the program proceeds to extract sentences and terms and create two files: one containing the matrix terms-sentences (Table 5), called matrix_file.txt, and another containing those terms extracted from the text that constitute each one of the dimensions of the matrix, which will be called terms_file.txt. Regarding the significant text which has been referred to previously, it is understood as all text related to the page that could make the user use some of the terms appearing in it as tags. 4.3 Information processing procedure (SVD&PCA) The next step involves applying these two algebraic methods onto the matrices that have been created. For this purpose a script in MatLab has been generated, which does the following tasks: 1.. It reads each text file containing the matrix sentences-terms and stores it in a variable or matrix A.. 2.. It applies the economized SVD onto the matrix A.. 3.. It re-builds the X matrix (table 7) starting from the truncated matrices U, and Vt by using of those singular values whose cumulative value represents the 90% of the total (table 6).. . 4. It applies the PCA on X to obtain, on the one hand, the matrix of covariance from where the principal components have to be extracted (the eigenvectors) and on the other hand, the eigenvalues (table 5). 5.. It creates a file storing only those principal components that correspond with the cumulative eigenvalue lower than the 90% of the total, which will be called ficheros_componentes.. Singular values. 5.88. 5.29. 4.56. 2.40. 1.22. 1.04. 0.39. 0.28. Cumulative ratio 27.92 53.04 74.69 86,09 91.88 96.82 98.67 100 Table 6. Eigenvalues and their cumulative ratio. There will only be taken those equivalent to the 90% of the total variance..
(17) 0.0838 -0.1639 0.0151 -0.1401 0.1756 0.0352 -0.5348 -0.1247 0.0815 1.0074 0.2416 -0.4013 0.1595 -0.0485 0.8385 0.9842 0.5579 0.6434 -0.5664 -0.7854 0.2416 -0.4013 0.1595 -0.0485 0.8385 0.9842 0.5579 0.6434 -0.5664 -0.7854 0.0260 0.4589 0.2510 0.5187 -0.2522 -0.1495 0.5915 -0.0480 0.4477 -0.5023 0.2109 -0.2749 0.1461 -0.0199 0.5563 0.6906 0.3890 0.4748 -0.3994 -0.4954 -0.2159 0.8355 0.2765 0.9340 -0.2060 -0.2126 1.2495 -0.2025 0.8596 -1.4641 -0.2813 -0.2921 -0.1769 -0.1038 0.5414 -0.3065 -0.5753 -0.4664 0.2811 0.6499 -0.1554 0.5579 0.1260 0.3800 -0.3233 -0.3281 0.5493 -0.2069 0.4788 -0.4841 -0.2033 -0.3285 -0.1651 -0.1142 0.7230 0.2210 -0.4336 -0.2516 0.1582 0.3956 -0.5652 -0.4285 -0.3171 -0.2512 1.0525 -0.5201 -1.0478 0.9230 0.5918 1.4122 Table 7. Matrix X, re-built by taking the eigenvalues of table 6 that accumulate more than the 90% of the total variance. PC1 PC2 PC3 PC4 PC5 PC6 PC7 PC8 PC9 PC10 X1 0.0838 -0.1639 0.0151 -0.1401 0.1756 0.0352 -0.5348 -0.1247 0.0815 1.0074 X2 0.2416 -0.4013 0.1595 -0.0485 0.8385 0.9842 0.5579 0.6434 -0.5664 -0.7854 X3 0.2416 -0.4013 0.1595 -0.0485 0.8385 0.9842 0.5579 0.6434 -0.5664 -0.7854 X4 0.0260 0.4589 0.2510 0.5187 -0.2522 -0.1495 0.5915 -0.0480 0.4477 -0.5023 X5 0.2109 -0.2749 0.1461 -0.0199 0.5563 0.6906 0.3890 0.4748 -0.3994 -0.4954 X6 -0.2159 0.8355 0.2765 0.9340 -0.2060 -0.2126 1.2495 -0.2025 0.8596 -1,4641 X7 -0.2813 -0.2921 -0.1769 -0.1038 0.5414 -0.3065 -0.5753 -0.4664 0.2811 0.6499 X8 -0.1554 0.5579 0.1260 0.3800 -0.3233 -0.3281 0.5493 -0.2069 0.4788 -0.4841 X9 -0.2033 -0.3285 -0.1651 -0.1142 0.7230 0.2210 -0.4336 -0.2516 0.1582 0.3956 X10 -0.5652 -0.4285 -0.3171 -0.2512 1.0525 -0.5201 -1.0478 -0.9230 0.5918 1.4122 E 4.02 3.01 1.72 0.51 0.21 0 0 0 0 0 C 42.45 74,23 97.78 100 100 100 100 100 100 92.39 Table 8. Principal components and eigenvalues (E) with their cumulative ratio (C). Only those terms with the highest principal component will be taken, which will be found among those representing a 90% of the variance. 4.4 Results final analysis The last step involves obtaining the tags automatically extracted and compare them with those introduced by the user manually. Another Java application has been created with this purpose. Since each element of the file of the principal components –which has been called PCA_filecorresponds with one of the terms appearing in the terms_file, it only will be taken the n values of the highest principal components. After that, the terms occupying the same position in the file terms_file are to be found, thereby obtaining the tags suggested automatically. By selecting the n elements of higher value, the most relevant n terms will be selected, and those are the terms that could be shown to a user that must select tags. As it will be seen in the results section, different values of n will mean different values in regard to the coincidence between the autosuggested tags and those that already exist. In the previous example, it can bee seen in Table 8 how the terms that have been chosen, if n is equivalent to 5, would be X2, X3, X4, X6 and X8, that is: watch, truth, sprword, media, information. These are the terms that have the principal component of the highest value among those principal components constituting at least the 90% of the variance..
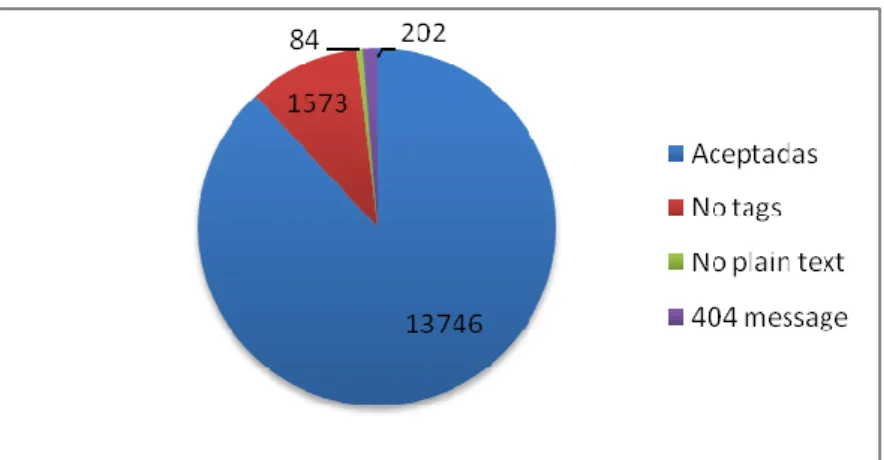
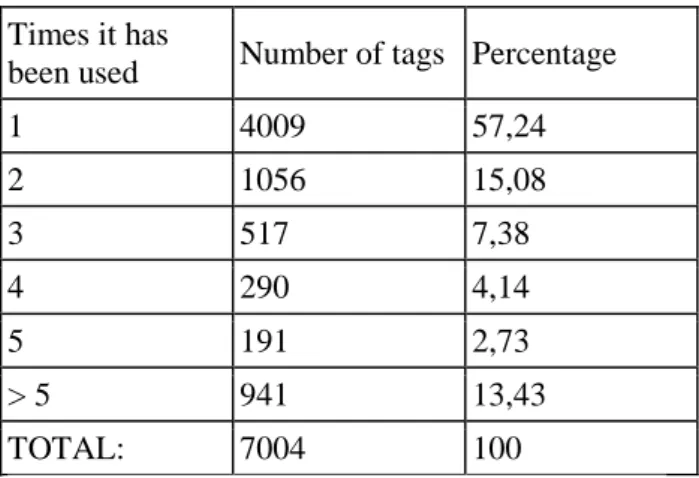
(18) Once the autosuggested tags have been obtained from all the webs, the application finishes its task calculating the percentage of explicit tags (those appearing in the site text) and calculating the percentage of those that are among the n tags that the system has suggested. 5.. Discussion. The sample of URLs and tags, as it has already been explained, has been automatically extracted from the SBS Delicious through an application created ad hoc. In this sense, the application has processed 15,400 URLs, 13,746 of which have been stored in the database. From the 1.654 URLs that have been rejected, 1.573 were rejected because they were not marked with any tag, 84 because they didn‘t have a text format (pdf files, Word documents, etc.) and 202 because they were webs that sent back a 404 message when we tried to access them, in other words, they didn‘t work.. Image 1. Percentage of webs processed To these 13,746 web sites it corresponds a total amount of 57,254 tags, which involves an average of 4 tags per URL (4.16). There are a total amount of 7,004 unique tags, 86.57% of which have been used from 1 to 5 times, that is, have been use to tag from 1 to 5 webs. The remaining 13.43% has been used to mark from 6 to 660 web sites, as it can be seen in table 9 and image 3. Times it has been used. Number of tags Percentage. 1. 4009. 57,24. 2. 1056. 15,08. 3. 517. 7,38. 4. 290. 4,14. 5. 191. 2,73. >5. 941. 13,43. TOTAL: 7004 100 Table 9. Number of times the tags have been used.
(19) Image 2. Percentage of use of the tags. These results show a great variability in the selection of terms that can be used as tags. This aspect will affect the results of our tests. On the other hand, taking the original sample, it can be found out that approximately 50% of the tags that have been used are explicit, that is, they appear in the text. To carry out the research itself, as it has already been said, only those terms appearing in the web site at least 4 times have been used. According to this parameter, it has been obtained the percentage of coincidence that is obtained upon the suggestion of 4-15 terms. It has been considered that if fewer terms are suggested the potential of this application is wasted, and if more than 15 terms are suggested, that would exceed the user‘s capacity.. Image 3. Graph showing how small amount of tags results in low coincidence. As it can bee observed in image 4, the higher the number of tags suggested is, logically the higher the percentage of coincidence. So it is obtained a minimum of 17% for 3 suggested terms and a maximum of 42% for 15 suggested terms. On the other hand, it has been calculated the number of web sites where our method obtains coincidences for some of its tags. As it happened with the explicit tags coincidence, the more.
(20) suggested terms there are, the more websites where our method obtains coincidences can be found, reaching a 59.33%. 6. Conclusions and future work The results that have been obtained are positive bearing in mind 2 aspects the automatic suggestion must face: the user‘s subjectivity and the contents generated by those users. With respect to the user‘s subjectivity, the explicit tags he chooses will depend on his interests: he might be interested in the main topic of a web site or perhaps only in one specific sentence, or she might find a web site interesting for its relation with another topic (―Linux‖ and ―free software‖) o for its design, for instance. On the other hand, the most fundamental characteristic of web 2.0 is that it allows users to generate content through blogs, for example. In this sense, the discussions that take place or the opinions the users show, can become problematic: they can move away from the central concern of the web site or they can focus on one specific aspect, the same as the opinions, thereby negatively affecting our method by making it focus only on those terms that appear in those comments or discussions. Therefore, our method reaching almost a 40% (38.80%) of coincidences in regard to explicit tags is a positive result. It must be noted the fact that approximately 50% of the tags that have been used by users are explicit tags, which shows their importance and relevance. It is a resource easy to obtain and it must be taken into account. In addition to this, other conclusions can be drawn. Firstly, it must be pointed out the fact that a total amount of 1.573 webs, which represents a 10.21% of the sample, were not marked with any tags. This fact implies important consequences because a resource, in SBS, only becomes better known or more accessible through browsing techniques such as pivot browsing by means of its tags. A non-marked resource will be less accessible. So the application of our method of automatic tag suggestion has made this 10.21% of resources more visible. On the other hand, for these types of tag suggestion systems to work properly it is important for the code HTML constituting the web site to be well formed. In this respect, and relating a well formed code HTML to the use of HTML standards of W3C, a recent study by the community of Opera developers has calculated that among a total of 3,000,000 web sites, only 4.13% met the HTML standards. This is a problem because tag suggestion systems must analyze the HTML to extract the text. Although it is true that the current parsers -among them the one used in this.
(21) research (Jericho)- are able to deal with badly closed or non-standard labels, it is also true that in some cases they must ignore the text that is written. Apart from managing a well-formed HTML codes, it is important to use it correctly. The first Java application, which is the one that scans the HTML to extract the text, gives the option to include as text the attribute ‗alt‘ of the pictures, represented by the tag ―IMG‖. On many occasions, what should be an important piece of text (because the picture is supposed to represent something important) becomes an empty text or a repetitive text as ―icon‖ or ―image‖. In fact, in these tests this text has been ignored due to the high percentage of pictures with predetermined text as ―icon‖, which made that text appear as suggested. As for prospective work to be done related to the subject of this paper, it could focus on different aspects: . To analyze how differently tag users use tags. By knowing how they use them, other systems can be created, which would allow to categorize different resources automatically, for instance.. . To create parsers that can analyze different webs in a better way. For example, they could analyze the attribute ‗alt‘ in pictures and depending on the similarity with the web central concern it could be included or not as text.. . To carry out a field study to test this system and observe whether users accept it or not and how they use it.. 7.. References.. . Basile, P.; Gendarmi, D.; Lanubile, F. & Semeraro, G. (2007), Recommending Smart Tags in a Social Bookmarking System, in 'Bridging the Gep between Semantic Web and Web 2.0 (SemNet 2007)' , pp. 22-29 .. . Bateman, S., Muller, M. J., & Freyne, J. (2009). Personalized retrieval in social bookmarking. Proceedings of the ACM 2009 International Conference on Supporting Group Work, pp. 91-94, Sanibel Island, Florida, USA. ACM.. . Benz, D., Tso, K., and Schmidt-Thieme, L. (2006). Automatic bookmark classification: A collaborative approach. In Proceedings of the Second Workshop on Innovations in Web Infrastructure (IWI 2006), Edinburgh, Scotland, 2006.. . Brooks, C. H. and Montanez, N. (2006). Improved annotation of the blogosphere via autotagging and hierarchical clustering. In WWW '06: Proceedings of the 15th international conference on World Wide Web, pages 625-632, New York, NY, USA. ACM.. . Byde, A., Wan, H. and Cayzer, S. (2007) Personalized tag recommendations via tagging and content-based similarity metrics. In Proceddings of the International Conference of Weblogs and Social Media, Boulder, CO, USA.
(22) . Castells, F., Laguna, P., Sörnmo, L., Bollmann, A., and Roig, J. M. (2007). Principal component analysis in ECG signal processing. EURASIP J. Appl. Signal Process. 2007, 1 (Jan. 2007), 98-98.. . Chirita, P. A., Costache, S., Handschuh, S., and Nejdl, W. (2007). Ptag: Large scale automatic generation of personalized annotation tags for the web. In WWW '07: Proceddings of the 16th International Conference on World Wide Web, 2007, pp. 845-854. . Chow, K. O., Fan,K. Y. K. , Chan, A. Y. K., Wong, G. T. L. (2009) Content-Based Tag Generation for the Grouping of Tags. In International Conference on Mobile, Hybrid, and On-line Learning, pp.7-12. . De Lathauwer, L. , De Moor, B., Vandewalle, J. (2000). SVD-based methodologies for fetal electrocardiogram extraction.IEEE International Conference ICASSP '00, proceedings of the Acoustics, Speech, and Signal Processing.. . Diederich, J., Lofciu, T. (2006) Finding Communities of Practice from User Profiles Based On Folksonomies. In Proceedings of the 1st International Worskhop on Building Technology Learning Solutions for Communities of Practice.. . Estellés, E., Del Moral, E., González, F. (2010). Social bookmarking tools as facilitators of learning and research collaborative processes: The Diigo case. Interdisciplinary Journal of E-Learning and Learning Objects (IJELLO), Vol. 7. Retrieved Agost 17, 2010 from www.ijello.org/Volume6/IJELLOv6p175-191Estelles683.pdf. . Farooq, U., Kannampallil, T. G., Song, Y., Ganoe, C. H., Carroll, J. M., and Giles, L. (2007). Evaluating tagging behavior in social bookmarking systems: metrics and design heuristics. In Proceedings of the 2007 international ACM Conference on Supporting Group Work (Sanibel Island, Florida, USA, November 04 - 07, 2007). GROUP '07. ACM, New York, NY, 351-360.. . Fujimura, S., Fujimura, K. O., and Okuda, H. (2007). Blogosonomy: Autotagging any text using bloggers' knowledge. In WI '07: Proceedings of the IEEE/WIC/ACM International Conference on Web Intelligence, pages 205-212, Washington, DC, USA. IEEE Computer Society.. . Gan, G., Ma, C., and Wu, J. (2007). Data Clustering: Theory, Algorithms, and Applications (ASA-SIAM Series on Statistics and Applied Probability). SIAM, Society for Industrial and Applied Mathematics, illustrated edition edition.. . Gonzalez, R.C., Woods, R.E. & Eddins S.L. (2004). Digital Image Processing using Matlab. Pearson.. . Gu xiangbai, Zhu qunxiong, Geng zhiqiang. Self-adaptive signal processing integrated wavelet theory & PCA for process monitoring. 2004 7th International Conference on Signal Processing Proceedings(ICSP'04), Vol.3:2413~2416,2004.. . Hamond, T., Hannay, T., Lund, B. and Scott, J. (2005) Social Bookmarking Tools (I): A general review. D-Lib magazine 11 (4). Retrieved Agost 17, 2010 from http://www.dlib.org/dlib/april05/hammond/04hammond.html. . Heymann, P., Ramage, D., Garcia-Molina. H. (2008) Social Tag Prediction. In Proceedings of the 31th Annual International ACM SIGIR Conference on Research and Development in Information Retrieval (SIGIR'08), pages 531-538.. . Hotho, A., Jäschke, R., Schmitz, C., and Stumme, G. (2006). Information retrieval in folksonomies: Search and ranking. In Sure, Y. and Domingue, J., editors, The Semantic Web: Research and Applications, volume 4011 of Lecture Notes in Computer Science, chapter 31, pages 411-426. Springer Berlin Heidelberg, Berlin, Heidelberg.
(23) . Illig, J.; Hotho, A.; Jäschke, R. & Stumme, G. (2009), A Comparison of content-based Tag Recommendations in Folksonomy Systems, in 'Postproceedings of the International Conference on Knowledge Processing in Practice (KPP 2007)' , Springer, , pp. (to appear).. . Jäschke, R., Marinho, L., Hotho, A., Schmidt-Thieme, L., Stumme, G. (2007) Tag recommendations in folksonomies. In Proceddings of the 11th European Conference on Prinicples and Practice of knowledge Discovery in Daabases, pp. 506-514. . Kropatsch G., Bischof (2001) Digital Image Analysis. Selected Techniques and Applications. Springer. . Lay, D.C. (2001) Linear Algebra and Its Applications, Prentice Hall. . Lee, C. B., Kim, M. S., & Park, H. R. (2003). Automatic Summarization Based on Principal Component Analysis. In Progress in Artificial Inteligence, Lecture Notes in Computer Science (Vol. 2902, págs. 409-413). Springer Berlin / Heidelberg.. . Lee, C. B., Choe, H., Ro, H., & Ock, C. (2005). Extracting the Significant Terms from a Sentence-Term Matrix by Removal of the Noise in Term Usage. Lecture Notes in Computer Science (Vol 3689, págs. 113-120). Springer Berlin / Heidelbertg.. . Lee, C. B., Park, H., and Ock, C. (2005). Significant sentence extraction by Euclidean distance based on singular value decomposition. In Proceedings of the 2nd International Joint Conference of Natural Language Processing (IJCNLP'05). Jeju, Korea. 636—643. . Lee, S.O.K., Chun, A.H.W. (2007). Automatic tag recommendation for the web 2.0 blogosphere using collaborative tagging and hybrid ann semantic structures. In ACOS'07: Proceedings of the 6th Conference on WSEAS International Conference on Applied Computer Science, pages 88-93, Stevens Point, Wisconsin, USA. World Scientific and Engineering Academy and Society (WSEAS).. . Li, X., Guo, L., and Zhao, Y. E. (2008). Tag-based social interest discovery. In Proceeding of the 17th international Conference on World Wide Web (Beijing, China, April 21 - 25, 2008). WWW '08. ACM, New York, NY, 675-684.. . Lu, Y. T., Yu, S. I., Chang, T. C., and jen Hsu, J. Y. (2009). A content-based method to enhance tag recommendation. In Proceedings of IJCAI'09, pages 2064-2069.. . Lund, B., Hamond, T., Flack, M. and Hannay, T. (2005) Social Bookmarking Tools (II): A case study - Connotea. D-Lib magazine 11 (4). Retrieved Agost 17, 2010 from http://www.dlib.org/dlib/april05/lund/04lund.html. . Mathes, A. (2004) Folksonomies -- Cooperative Classification and Communication Through Shared Metadata. Computer Mediated Communication - LIS590CMC. Retrieved Agost 17, 2010 from http://www.adammathes.com/academic/computer-mediatedcommunication/folksonomies.html. . Millen, D., Feinberg, J. and Kerr, B. (2005) Social Bookmarking in the enterprise. Queue, 3(9):28-35. . Millen, D. R.; Whittaker, S. & Yang, M. (2007). Social bookmarking and exploratory search. ESI, 5.. . Mishne, G (2006) Autotag: a collaborative approach to automated tag assignment for weblog posts. In Proceddings of the 15th international conference on World Wide Web, pp. 953-954.. . Mudrová, M. and Procházka, A. (2005). Principal component analysis in image processing. In Technical Computing Conference.. . Nielsen, M.A., Chuang, I.L. (2000). Quantum Computation and Quantum Information. Cambridge University Press..
(24) . Niwa, S., Doi, T., Hon‘Iden, S. (2006). Web Page Recommender System Based on Folksonomy Mining. Transactions of Information Processing Society of Japan, 47(5):1382– 1392.. . Olivera, B., Calado, P., Pinto, H.S. (2008) Automatic Tag Suggestion Based on Resource Contents. EKAW '08: Proceedings of the 16th international conference on Knowledge Engineering, 255-264. Spriger-Verlag, Berlin / Heidelberg. . Poon, M.W.Y., Khan, R.H. , Le-Ngoc, S. (1993). A singular value decomposition (SVD) based method for suppressingocean clutter in high frequency radar. IEEE Transactions on Signal Processing. Volume 41, Issue 3.. . Resnick, P., Iacovou, N., Suchak, M., Bergstrom, P., Riedl, J. (1994). GroupLens: An Open Architecture for Collaborative Filtering of Netnews. In Proceedings of ACM 1994 Conference on Computer Supported Cooperative Work, pp. 175-186. Chapel Hill, North Carolina. ACM.. . Resnick, P., Varian, H. R. (1997) Recommender systems. Commun. ACM, vol. 40, no. 3, pp. 56–58, 1997.. . Rosipal, R., Girolami, M., and Trejo, L. J. (2001). Kernel pca for feature extraction and denoising in non-linear regression. Neural Computing & Applications, 10:231-243.. . Sánchez, E., Ortiz, M.J. (2002). Estimación de la evolución pluviométrica en la España seca atendiendo a diversos pronósticos empíricos de la NAO. III Congreso de la Asociación Española de Climatología.. . Sánchez, E., Ortiz, M.J. (2002). Predicción estacional de condiciones anómalas en el Atlántico Norte. III Congreso de la Asociación Española de Climatología.. . Sarwar, B., Karypis, G., Konstan, J., and Riedl, J. (2001). Item-based collaborative filtering recommendation algorithms. In WWW '01: Proceddings of the 10th International Conference on World Wide Web, 2001, pp. 285-295. . Seng, H., Huang, J.Z. (2005). Analysis of cal l centre arrival data using singular value decomposition. Wiley InterScience, Applied Stochastic Models in Business and Industry 21:251-263.. . Si, X., Liu, Z., Li, P., Jiang, Q., and Sun, M. (2009). Content-based and graph-based tag suggestion. In ECML PKDD DC2009, pages 243-260.. . Song, Y., Zhang, L., and Lee, C. (2008a). A sparse gaussian processes classification framework for fast tag suggestions. In CIKM ‘08: Proceeding of the 17th ACM conference on Information and knowledge mining, pages 93–102, New York, NY, USA, 2008. ACM.. . Song, Y., Zhuang, Z., Li, H., Zhao, Q., Li, J., Lee, W. C., and Giles, C. L. (2008b). Realtime automatic tag recommendation. In SIGIR '08: Proceddings of the 31st annual international ACM SIGIR Conference on Research and Development in information Retrieval, 2008, pp.515-522. . Sood, S., Owsley, S., Hammond, K., and Birnbaum, L. (2007). Tagassist: Automatic tag suggestion for blog posts. In Proceddings of the International Conference on Weblogs and Social Media (ICWSM 2007).. . Stewart, G. W. (1993). On The Early History of The Singular Value Decomposition, SIAM Review , vol. 35, no. 4, 551-566.. . Stojanovic, L., Staab, S., & Studer, R. (2001). eLearning based on the Semantic Web. In WebNet2001-World Conference on the WWW and Internet (pp. 23–27)..
(25) . Vatturi, P.K., Geyer, W., Dugan, C., Muller, M.J., Brownholtz, B. (2008) Tag-based filtering for personalized bookmark recommendations. In the 17th ACM Conference on Information and Knowledge Management (CIKM'08). . Wall, M.E. , Rechtsteiner, A. ,Rocha, L.M. (2003). Singular value decomposition and principal component analysis in: A Practical Approach to Microarray Data Analysis. (Berrar DP, Dubitzky W, Granzow M, eds.), pp. 91-109, Kluwer: Norwell, MA. . Wilson, B. (2008). MAMA: Markup validation report. Opera Developer Community. Avaiable http://dev.opera.com/articles/view/mama-markup-validation-report/. Last accessed 17-02-2010. . Wu, L., Yang, N. Yu, Hua, X-S (2009) Learning to tag. In proceedings of the 18th international conference on World Wide Web (WWW'09), pages 361-370.. . Xu, Z., Fu, Y., Mao, J., and Su, D. (2006). Towards the semantic web: Collaborative tag suggestions. In Proceedings of Collaborative Web Tagging Workshop at 15th International World Wide Web Conference.. . Yang, K., Hwang S., Kang Y., Yang, H. (2009). Folksonomy Analyzer: a FCA-based Tool for Conceptual Knowledge Discovery in Social Tagging Systems". In 1st International Workshop on Mining Social Media, CAEPIA.. . Zhang, N., Zhang, Y., Tang, J. (2009) A Tag Recommendation system for Folksonomy. SWSM'09. . Zubiaga, A., Martínez, R., & Fresno, V. (2009). Getting the most out of social annotations for web page classification. In Proceedings of the 9th ACM symposium on Document engineering (pp. 74-83). Munich, Germany: ACM. doi:10.1145/1600193.1600211.
(26) Table. Mathematic Tool (Name) Customized algorithm (HITS) Information Retrieval measures (AutoTag) Vector Space Model+Cosine Vector Similarity Traditional Collaborative Filtering Techniques Customized Algorithm (TagAssist) Hybrid Artifical Neural Network Table 1. Summary of methods using collaborative filtering. Authors. Year. Xu et al. Mishne Benz et al. Jäsche et al. Sood et al. Lee & Chun. 2006 2006 2006 2007 2007 2007. Mathematic tool (Name) Authors Cosine similarity Brooks & Montanez Cosine similarity + Latent Semantic Analysis (P-TAG) Chirita et al. Cosine similarity (Tagging-based & Content-based Byde et al. similarity) Vector Space Model Lee & Chun Vector Space Model (Tess) Oliveira et al. Machine learning algorithms Song et al. Association rules based on tags Heymann et al. 4 cosine similarities Lu et al. None (simple text processing) Chow et al. Table. 2 Summary of the methods using analysis of the textual content.. Basis for the suggestion Year Type/Algorithm User’s information 2006 --Data Mining+ user’s information 2006 Cluster based User’s information 2007 --Data Mining 2007 KNN User’s information 2008 Graph-based Real-time 2008 --Semantic methods 2009 RankBoost Semantic methods 2009 Language Model + ACP Table 3. Summary of methods applying different techniques Term Notation word W1 watch W2 truth W3 sprwordn W4 news W5 media W6 interconnected W7 information W8 free W9 documentaries W10 Table 4. Relation and notation of terms extracted from the text. Year 2006 2007 2007 2007 2008 2008 2008 2009 2009. Authors Diederich et al. Niwa et al. Basile et al. Fujimura et al. Vatturi et al. Song et al. Wu et al. Zhang et al..
(27) W1 W2 W3 W4 S1 2 0 0 0 S2 0 0 0 2 S3 1 0 0 0 S4 0 3 3 0 S5 2 1 1 1 S6 1 0 0 0 S7 1 0 0 0 S8 0 0 0 0 Table 5. Matrix X of the example. Singular values. 5.88. 5.29. W5 0 0 0 2 1 0 0 0. 4.56. W6 0 4 0 1 0 0 0 0. 2.40. W7 2 0 0 0 0 0 0 1. 1.22. W8 0 2 0 0 0 1 0 0. 1.04. W9 2 0 1 1 0 0 0 0. 0.39. W10 4 0 0 0 0 1 0 1. 0.28. Cumulative ratio 27.92 53.04 74.69 86,09 91.88 96.82 98.67 100 Table 6. Eigenvalues and their cumulative ratio. There will only be taken those equivalent to the 90% of the total variance.. 0.0838 -0.1639 0.0151 -0.1401 0.1756 0.0352 -0.5348 -0.1247 0.0815 1.0074 0.2416 -0.4013 0.1595 -0.0485 0.8385 0.9842 0.5579 0.6434 -0.5664 -0.7854 0.2416 -0.4013 0.1595 -0.0485 0.8385 0.9842 0.5579 0.6434 -0.5664 -0.7854 0.0260 0.4589 0.2510 0.5187 -0.2522 -0.1495 0.5915 -0.0480 0.4477 -0.5023 0.2109 -0.2749 0.1461 -0.0199 0.5563 0.6906 0.3890 0.4748 -0.3994 -0.4954 -0.2159 0.8355 0.2765 0.9340 -0.2060 -0.2126 1.2495 -0.2025 0.8596 -1.4641 -0.2813 -0.2921 -0.1769 -0.1038 0.5414 -0.3065 -0.5753 -0.4664 0.2811 0.6499 -0.1554 0.5579 0.1260 0.3800 -0.3233 -0.3281 0.5493 -0.2069 0.4788 -0.4841 -0.2033 -0.3285 -0.1651 -0.1142 0.7230 0.2210 -0.4336 -0.2516 0.1582 0.3956 -0.5652 -0.4285 -0.3171 -0.2512 1.0525 -0.5201 -1.0478 0.9230 0.5918 1.4122 Table 7. Matrix X, re-built by taking the eigenvalues of table 6 that accumulate more than the 90% of the total variance.. PC1 PC2 PC3 PC4 PC5 PC6 PC7 PC8 PC9 PC10 X1 0.0838 -0.1639 0.0151 -0.1401 0.1756 0.0352 -0.5348 -0.1247 0.0815 1.0074 X2 0.2416 -0.4013 0.1595 -0.0485 0.8385 0.9842 0.5579 0.6434 -0.5664 -0.7854 X3 0.2416 -0.4013 0.1595 -0.0485 0.8385 0.9842 0.5579 0.6434 -0.5664 -0.7854 X4 0.0260 0.4589 0.2510 0.5187 -0.2522 -0.1495 0.5915 -0.0480 0.4477 -0.5023 X5 0.2109 -0.2749 0.1461 -0.0199 0.5563 0.6906 0.3890 0.4748 -0.3994 -0.4954 X6 -0.2159 0.8355 0.2765 0.9340 -0.2060 -0.2126 1.2495 -0.2025 0.8596 -1,4641 X7 -0.2813 -0.2921 -0.1769 -0.1038 0.5414 -0.3065 -0.5753 -0.4664 0.2811 0.6499 X8 -0.1554 0.5579 0.1260 0.3800 -0.3233 -0.3281 0.5493 -0.2069 0.4788 -0.4841 X9 -0.2033 -0.3285 -0.1651 -0.1142 0.7230 0.2210 -0.4336 -0.2516 0.1582 0.3956 X10 -0.5652 -0.4285 -0.3171 -0.2512 1.0525 -0.5201 -1.0478 -0.9230 0.5918 1.4122 E 4.02 3.01 1.72 0.51 0.21 0 0 0 0 0 C 42.45 74,23 97.78 100 100 100 100 100 100 92.39 Table 8. Principal components and eigenvalues (E) with their cumulative ratio (C). Only those terms with the highest principal component will be taken, which will be found among those representing a 90% of the variance..
(28) Times it has been used. Number of tags Percentage. 1. 4009. 57,24. 2. 1056. 15,08. 3. 517. 7,38. 4. 290. 4,14. 5. 191. 2,73. >5. 941. 13,43. TOTAL: 7004 100 Table 9. Number of times the tags have been used.
(29) Figure. 84. 202. 1573. Accepted No tags No html 404 message 13746.
(30) Figure.
(31) Figure.
(32)
Figure
+5
Documento similar
Another possible representation of a functional data sample is by expressing them as linear com- binations of basis functions, and it is called the basis representation.
To achieve a transformation from the original space to a feature space useful for classification, oriented principal component analysis (OPCA) is presented as the solution of
For this reason, in this article, two ways for fitting the different stem taper functions for each tree component are evaluated: case 1, in which, for each component, the taper
The second is based on dimension reduction by using functional principal component analysis of the sample curves (FPCA) and testing multivariate homogeneity on a vector of
The principal component analysis was conducted on the TPM (transcripts per millions reads) values for the differentially expressed genes in the cultivar ‘Garnet’ flower buds, sampled
A web application for the semi-automatic extraction and storage of information was developed, for extracting (digital and scanned) text, and for indexing, searching and storing
Determination of Phase Transition by Principal Component Analysis Applied to Raman Spectra of Polycristalline BATIO 3 at Low and High
Principal component analysis (PCA) of the trees evaluated with the tomography for wood damage as a function of acoustic velocity, sensor evaluation height and biometric
