Analysis of the adoption of the euro on European tourist flows
26
0
0
Texto completo
(2) Abstract. This research had as a primary objective to analyze the impact of the policies carried out by the European Union on the tourism. These policies are aimed to integrate the European countries on a single and open market. To achieve this objective, the main macroeconomic variables of the countries which adopted the euro in 1999 are analyzed. In this way, the countries exposed are Germany, Austria, Belgium, Spain, Finland, France, Ireland, Italy, Luxemburg, Netherlands, Portugal and Greece. The results showed an increase of the tourism activity on those countries that adopted the euro. Moreover, results showed a high sensibility of the tourism sector to the economic fluctuations. Despite a single currency wants to be a strong instrument to face these fluctuations, the euro zone nowadays seems not to be an optimal integrated area.. 2.
(3) Index of contents I.. Introduction ............................................................................................ 4. II.. Process of creating the Economic and Monetary Union .................... 5. III.. Effects of the euro on countries’ economy ......................................... 6. IV.. Effects of the euro on tourism sector .................................................. 9. V.. Data analysis ........................................................................................ 11. VI.. Main Macroeconomic variables of the Eurozone .............................. 11. VII.. Contribution of tourism sector to countries’ economies ................. 18. VIII.. Tourism expenditure ........................................................................... 21. IX.. Conclusions ......................................................................................... 23. X.. Index of tables, graphs and figures ................................................... 25. XI.. References ........................................................................................... 25. 3.
(4) 1. Introduction The selection of this topic for my final degree project emerged during my Erasmus experience in Poland. Nowadays Poland and many other countries of the east of Europe as Hungary, Czech Republic and Croatia still preserve its own currency. As an Erasmus student in Poland I suffered the effects of having a different currency than the euro both as a temporary resident and as a tourist. So I did not hesitate when I saw the possibility to analyze the effects of the Euro on the economies of the Euro Zone and its impact on the tourism. Anyway we have to be aware that the euro affects a lot of economic and social issues. Adopting the euro is an important step of an integration process between different countries. This research is mainly motivated to answer two research questions that I asked myself. The first one, if countries of the east of Europe will prosper more being part of the Eurozone and the second one if sharing a common currency had motivated people to travel more within the Eurozone. Fourteen years after the introduction of the euro on the European market in 2002, we are more able to analyze its impact on the economies in general and on the tourism sector in particular. In general, sharing a common currency makes the economies stronger and more stable by removing exchange rate uncertainty. This fact has a lot of implications and a clear multiplier effect, starting from the point that investors are able to invest more money thanks to the securities and guarantees that offers the market. Moreover, sharing a common currency provides a reduction of international transaction costs and enhances price transparency since countries can express prices in the same unit of account. Due to these positive effect of joining to the Eurozone jointly to all the policies carried out by the European Union and national governments, from 2002 Europe was involved in an economic expansion period and, as we have seen, in a disproportionate optimism. However, the financial crisis of 2007 broke immediately the expansion period to enter in a period of deep crisis. Moreover, structural deficiencies in the design of the Eurozone shed light: asymmetric economic shocks, fiscal policies not coordinated, high budget deficits. The scenario completed changed after the economic crisis and the confidence of the investors on the market fell down. In 2016 Europe is still working to recover the economic levels of 2007. Regarding the effect of the euro on the tourism sector this sector has been benefited of adopting a common currency. On the one hand, investments on tourism has increased over the years from 2002 since removing exchange rate volatility considerably reduce uncertainty. Destinations have adapted and improved their infrastructures and as a result, tourism capacity has increased. On the other hand, sharing the same currency has a lot of advantages for tourists as for example higher transparency of prices and the elimination of the currency exchange costs. Despite these positive effects of the euro, tourism presents a high sensibility to the economic fluctuations. With the crisis of 2007 unemployment has increased in Europe and as a consequence wages have decreased. Taking into account the rela4.
(5) tion between purchasing capacity and tourism, we understand how could affect the economy on tourist flows. All this effects of the integration progress are explained on this research. In order to do this, the present research consists of two differentiated parts. The first one contemplates the theoretical part and the second one the empirical part. On the theoretical part, firstly the process of creating the Economic and Monetary Union (EMU) is explained, starting from the Treaty of Rome in 1957 and ending on the finally step of the process when the euro started to circulate in 2002. Secondly, the expected effects of the euro on countries’ economies are explained. Thirdly, the impact of the euro on the tourism sector, its advantages and disadvantages, are presented. Finally, the empirical analysis is divided into two parts. The first one orientated to study the effect of the euro on those countries that adopted the euro in 2002. In this way the GDP, GDP per capita, the unemployment rate and the inflation rate are useful instruments of study. The second part of the empirical analysis is orientated to the tourism sector. Thereby, this part contains data on the contribution of tourism to the national GDP, to the employment and the investment of the countries on the tourism sector as well as the expenses of countries abroad and the foreign expenses in each country. To close the research, at the end are exposed all the conclusions.. 2. Process of creating the Economic and Monetary Union (EMU) The process of creating the Euro has been a long and progressive process that has not finished yet. The first step of the process was the creation of the European Economic Community (EEC) as a result of the Treaty of Rome in 1957. The EEC was established to reduce tariff barriers and to promote trade. At the same time, there was set the main objective for Europe: establish a common market in order to guarantee economic prosperity and to contribute with the relations of the European nations. The countries that signed this historic agreement were France, Netherlands, Belgium, Luxemburg, Italy and the Federal Republic of Germany being the original members of the European Community. The next important step was the building of the European Monetary System (EMS) in March 1979. European economies suffered many problems due to currency instability in the 60’ so with EMS they wanted to control these fluctuations through the exchange rate mechanism (ERM) keeping within 2.25% the currencies’ exchange rate fluctuations, with the exception of the lira, which was allowed to fluctuate by 6% (European Commission, 2015). Also, the ERM was supported by a consensus among EU countries to control and reduce inflation. A decade later, by the time of the negotiations on the Maastricht Treaty in 1991 the ERM confirmed a success: short term volatility was drastically reduced thanks to a mixture of converging inflation rates, interest rate management which targeted the exchange rate, 5.
(6) joint intervention in the foreign exchange market and capital controls. This success made stronger future negotiations of the Community.. After the success of the ERM, the next step was the Treaty on European Union, signed by Belgium, Denmark, Germany, Greece, Spain, France, Ireland, Italy, Luxemburg, Netherlands, Portugal and United Kingdom at the European Council at Maastricht in December 1991. At Maastricht It was decided that Europe would have a stable currency by the end of the century (Commission of the European communities, 1992). In order to guarantee the strength and adaptability to adopt the single currency there was set the “Maastricht convergence criteria”. This criteria corresponds to five measures: (i) price stability, which is measured with the harmonized consumer price inflation rate and the member states’ inflation rate cannot be higher than 1.5% points above the rate of the three best performing Europeans countries, (ii) the second one is the control of the public finances, which is measured with the government deficit as % of GDP and to meet this criteria, countries’ deficit cannot be higher than 3%, (iii) the third measure is a sustainable public finances which is measured in terms of the government debt as % of GDP and cannot surpass a 60%, (iv) the fourth measure is the durability of convergence which is measured by long-term interest rate and cannot be higher that 2% points above the rate of three best performing European countries in terms of price stability, and (v) the last measure is exchange rate stability, which is measured with the deviation from a central rate and to meet this measure is necessary participate in ERM for two years without severe tensions. Only those countries that would meet the convergence criteria could adopt the euro (UN-WTO, 1998 & Catalunya Caixa, 2007). In 1995 took place the European Council in Madrid. The meeting was chaired by Felipe Gonzalez, President of the European Council and Prime Minister of Spain, in the presence of Mr Santer, Mr Van den Broek and Mr de Silguy for the Commission. The European Council took important decisions on employment, the Intergovernmental Conference and the enlargement to incorporate in countries of Central and Eastern Europe and the Mediterranean. Moreover, they agreed on the name of the single currency: the euro. In 1998, eleven countries met the convergence criteria to adopt the euro. Denmark and the United Kingdom which find shelter to the protocol numbers 11 and 12 of the Treaty refused from participating on the third stage of the EMU. Greece did not met price stability criteria and Sweden, on the one hand did not met the exchange rate stability and on the other hand their legislation was not compatible with the Maastricht Treaty (Catalunya Caixa, 2007). On 31 December 1998 the conversion rates between the euro and the currencies of the participating countries were fixed irrevocably. On 1 January 1999 the euro 6.
(7) started to work like a current currency but only for transactions in these 11 countries: Germany, Austria, Belgium, Spain, Finland, France, Ireland, Italy, Luxemburg, Netherlands and Portugal. Furthermore, the microstates of Vatican City, Monaco and San Marino adopted the currency too. Greece joined to the euro on 1 January 2001. This research, is focused on this group of 12 countries that initially adopted the euro. Finally, on 1 January 2002 the euro currencies were launched and they were widely available for all the sectors. Some countries have joined to the euro the next years: Slovenia on 2007, Malta and Cyprus on 2008, Slovakia on 2009, Estonia on 2011, Latvia on 2014 and the latest country that had recently joined was Lithuania on 2015.. 3. Effects of the euro on countries’ economy We have to consider the euro not only as a currency for European citizens as a symbol of progress but also as a solution for the economic problems of the past: with the economic integration, member states of the European Union, searched for currency stability and an economic situation that brings higher growth and employment. There are many advantages with the economic integration. Despite of this, these advantages or positive effects could be only real or effective if exists an optimal currency area (OCA) (UN-WTO, 1998). Optimal currency area was a theory published by Robert Mundell in 1961. This theory basically says that countries could join to a monetary union if the costs of doing so are lower than the benefits. Principally, benefits of the OCA are the absence of exchange rate uncertainty and due to this absence, an increment of trade between countries of the monetary union is expected. This optimal currency area is based on the following criteria: a strong commercial integration, which implies that foreign trade within the area should represent an important proportion of their GDP. The second criteria require common exogenous shocks, and the third criteria hold that specific shocks to a country should be absorbed by production-factor mobility, real wage flexibility and budgetary federalism. In 1999 internal trade between countries of the European Union amounted among 10 and 20% of the total trade of European Union member states (Fürrutter-Martina, 2012). It represented a high share but still smaller than the amount of trade between regions of the United States. Furthermore, growth rate differences among European countries have been closer along the years. Where the euro area probably fails is on the third criteria. Strong regulations of European countries, differences in languages, cultures and also social protection systems difficult intra-EMU labor mobility. Maybe the Eurozone was not created on an optimal currency area 7.
(8) due to lack of worker’s mobility and strong policies. Despite of this, there is a tendency to an opening of its barriers and finally to an optimal currency area (Fürrutter-Martina, 2012). Furthermore, the euro does not provide stability and economic growth by itself. It could be achieved, first of all, with a good management of the euro zone by the monetary and economic union (EMU) and secondly with mechanisms to intensify the integration of euro’s countries through commercial and cooperation politics. Once we understand this ideal scenario to create a currency union, we can see the effects of the euro on countries’ economy. There are many advantages of the euro for citizens, businesses, and the whole economy in general. Before the introduction of the euro, exchange operations involved uncertainty, costs and lack of transparency. So, with the introduction of the euro, there were reduced the transaction costs and also the interest rates. The changeover to the euro has been estimated to enable consumers and enterprises to save 140 billion francs per years on currency exchanges between member states (UN-WTO, 1998). This saving is expected to increase the purchasing power capacity of their citizens (Ministère de l’Intérieur, 1997). Sharing a common currency between different countries means that price transparency enhances and households can easily compare products by their quality instead of their price. So, it would imply an increase on competitiveness. Furthermore, consumers would have more choosing possibilities and more stable prices. This stability will reduce uncertainly and will give more security and opportunities for enterprises, markets and investors. As a result of this investments and stability, economies expansions are expected. In fact, interbank deposit market and corporate bond market have emerged as key instrumentals to allocate liquidity and funding corporations in the euro area. We can see that all the advantages or effects of the euro are interrelated. Furthermore, all these transformations have been more visible in markets that have international and financial components. Those segments whose structures rely on strong national peculiarity have not experienced the same transformation. At the same time that European economies are growing the euro grows getting more presence on the global economy and getting benefits from economy of scale. Nowadays, the euro is the second reserve currency in the world. The strength and good management of the euro provide economic stability to the euro zone. Thanks to this stability the euro zone can afford better adaptation to external shocks such as changes on the price of oil and turbulences in world markets (Galati-Gabriele, 2001) But, not all are advantages. There are some disadvantages that countries should know before adopting the euro. The first and most direct disadvantage over European economies that adopt the euro is losing their own currency. Losing the national currency means to lose the exchange rate instrument to deal with International turbulences. This impact is more important if there exist asymmetric shocks on the EMU countries, the countries are relatively closed economies and if these countries have their economies less diversified (Belke-Ansgar, 1998). Furthermore, losing the exchange rate instrument is aggravated for the lack of instruments to 8.
(9) compensate this effect such as the monetary policy. Now, employment, prices and wages are too rigid to compensate this effect. Moreover, limits related to public deficit and debt imposed by the Treaty of Maastricht reduce the possibility of changes on fiscal policy by national governments and also is aggravated due to the fact that decisions on national monetary policies are jointly decided to the interests of the whole European Economy. As a result, economic, inflation and employment objectives are set jointly to other countries. There are some more visible and tangible disadvantages as the costs of transition. Costs of issuing the new currency, changing banking systems, software, printed materials and all material related to prices expressed in a new currency. In addition is necessary to train and inform employers, managers and consumers about the new currency. As a conclusion we can affirm that benefits and costs of this integration are difficult to measure. Although during the first years of the inception of the euro many of the could be appreciated since member states enjoyed a period of economic prosperity, during the current economic crisis, many errors and limitations during the creation of the Eurozone came out.. 4. Effects of the euro on tourism sector. Tourism sector jointly with the trade and financial sector are the areas where the impact of the euro has been more significant. These sectors have a huge international component so their stability depends on the global economy. The tourism sector implies a continuous flow of capital and people between different countries. Moreover, according to the World Travel and Tourism Council (WTTC, 2016), the total contribution of tourism sector was 10.2% in 1995 while it represented a 9.8% in 2015. As we have explained before on this paper, the changeover to the euro supposes an increment of the purchasing power of the citizens of the member states. Taking into account that tourism is a luxury good from a consumers’ standpoint, this increment of purchasing power will increase the demand of tourism. A good or item is called a luxury good when the increment of its consumption is proportionally to an increment of house revenues. Tourism demand is most of the times determined by the supply. Tourism supply is composed of different components which are interrelated. Accommodation, restaurants, transport infrastructures and travel agencies are important components of tourism supply. The euro has a direct effect on tourism supply because it affects the business environment in which enterprises and consumers move about. As I said before on this paper, eliminating exchange rates fluctuations for all prices will increase market transparency. Obviously, price transparency could be the most important effect on tourism. With the same currency on different destinations and products, tourists can compare easily the quality of the product and understand better for what are their purchasing. As a result, countries cannot devaluate their currencies to compete with other destinations by price. So the euro opens a new 9.
(10) area of competitively where the quality of the product is necessary to attract these tourists. The disappearance of the foreign exchange market is another effect to encourage people traveling between the euro area. These fluctuations are eliminated both for travelers and professionals reducing the costs and time spent on currency exchange. One study about a traveler crossing Europe before the euro revealed that without having spent anything, due to exchange rate expenses this traveler returns with a half of his money (Ministère de l’Intérieur, 1997). For professionals of the sector, the euro supposes a reduction of transactional and operational costs (also supported for technological developments as online payments). In addition, business environment is beneficed of more stability and as a consequence enterprises are more willingness to invest. Furthermore, the adoption of the euro has consequences on international tourist flows. Thereby, the adoption of the euro may lead to new international tourism flows (tourism creation) as well as to geographical restructuring of tourism (tourism diversion). According to the UNWTO data, tourist arrivals to the Eurozone represented 30% of overall world tourist arrivals in 2012, and half of these tourists arrived from other member states. Tourism diversion takes place when low-cost tourism suppliers outside the currency union are replaced by higher cost Eurozone producers. So, trips to destinations outside the Eurozone are replaced by travels within the Eurozone countries. According to Santana-Gallego et al (2010), the impact of the euro on tourism comes not only from the elimination of exchange rate volatility and exchange costs but also from the elimination of any calculus and the use of the same physical currency Recent depreciation on 2014 and 2015 of the euro against foreign currencies as the dollar and the British pound has boosted the tourist arrivals from abroad to the Eurozone (inbound tourism). Thereby, this increment of tourism is estimated to add 0,2 points to the Eurozone's GDP (Oddo Securities, 2015) This increment is due to the international tourism of United States, United Kingdom and China, which see how its purchasing power increase in the Eurozone. Moreover, this depreciation supposes an increment of the tourism between countries of the Eurozone and also a decrease of tourism of euro countries to countries out of the Eurozone. As we have seen on this paper, depreciating the currency has been an instrument to attract tourists. This recent situation of the European Economy demonstrates its effectiveness. The adoption of the same currency for European countries is not the only advantage of the integration for tourists. Nowadays being European citizens brings rights by itself. As a European citizen we can freely travel to all the Member States of the Union with only an identification card or valid passport. Moreover, as a travel consumer between the Union we are assisted and protected with rights and legislations in favor of the traveler. Definitively, tourism sector is beneficiated of the integration between European countries. Not only for the currency, if not for 10.
(11) all the legislations, rights and policies associated. So, it seems that integration has encouraged tourists to travel among the Eurozone countries.. 5. Data analysis In this section, I will analyze some data on the impact of the euro on the member states’ economies paying special attention to the impact on the tourism sector. Firstly, I explore the performance of main macroeconomic variables, GDP, GDP per capita, inflation and unemployment during the period 1995-2014 to explore how they behave before and after the induction of the euro. We differentiate the countries into two groups: Southern and Northern Eurozone countries. Secondly, I analyze the impact of the tourism sector on the member countries’ economies such as total contribution of tourism sector to GDP, to total employment and public and private investment on tourism sector. Thirdly, I focus on tourism movements by exploring total tourist arrivals and departures to the Eurozone. Moreover, tourist arrivals by country of origin are also investigated.. 5.1 Main Macroeconomic variables of the Eurozone First of all, we analyze the evolution of countries’ GDP for the period 1995-2014. The GDP, that is the gross domestic product is an indicator used to measure the monetary value of all finished goods and services within a country in a specific time period. It is useful to measure the national economic activity. So we can compare the data before the introduction of the euro and its impact on the following years. Figure 1 represents the growth rate GDP of Northern European Countries between 1995 and 2014 and illustration 2 represents the growth rate GDP of Southern European Countries between 1995 and 2014. Figure 1: Growth rate GDP of Northern European Countries between 1995-2014. 11.
(12) 0,150. 0,100. 0,050. 0,000. -0,050. -0,100 Austria. Belgium. Finland. Germany. Ireland. Luxembourg. Netherlands. Source: Data from Eurostat. Figure 2: Growth rate GDP of Southern European Countries between 1995-2014 0,080 0,060 0,040 0,020 0,000 -0,020 -0,040 -0,060 -0,080 -0,100 France. Greece. Italy. Portugal. Spain. Source: Data from Eurostat. In general, countries both from the Northern and Southern of Europe have experienced an increment of its national production from 1994. This increment is higher on the countries of the Northern. As explained on section 3, countries with high financial and international components on their economies have experienced a bigger impact with the integration of the euro. Is the case of countries as Luxemburg and Ireland which have a growth rate of their GDP of 94.31 % and a 138% respectively since 1995. On the opposite side we found Greece with a growth rate 12.
(13) of 8.92% and Portugal with a 16.83%. It is visible the impact of the financial crisis of 2008 where practically all the countries suffered its effects and in 2014 all the countries of the Southern less France were still in recession. Highlight too the boost of the economy in 1999 coinciding with the introduction of the euro. The next macro variable to analyze is the GDP per capita. The difference with the GDP is that GDP per capita divide the GDP of a period between the total population of the country in order to obtain a measure of the average income level of countries’ citizens. It is useful to compare living standard of different countries. Again, Figure 3 shows the GDP per capita of Northern countries of Europe between 1995 and 2014 and Figure 4 shows the GDP per capita of Southern countries.. Figure 3: Growth rate GDP per capita of Northern European countries between 1995-2014 0,150 0,100 0,050 0,000 -0,050 -0,100 Austria. Belgium. Finland. Ireland. Luxembourg. Netherlands. Germany. Source: Data from Eurostat. Figure 4: Growth rate GDP per capita of Southern European countries between 1995-2014. 13.
(14) 0,08 0,06 0,04 0,02 0 -0,02 -0,04 -0,06 -0,08 -0,1 France. Greece. Italy. Portugal. Spain. Source: Data from Eurostat. At first sight is palpable the differences of living standard between Northern and Southern countries. Despite of France and Italy which presented a similar level than most of Northern countries on 1995, Spain, Portugal and Greece’s living standard presented a very poor level. It is visible again two trends. The first one is the growth of the economies since the creation of the euro on 1999 and secondly, the financial recession of 2008. This recession has been more significant on Southern countries, where countries like Italy and Greece have returned to levels at the end of the twentieth century. Meanwhile, Northern countries are still recovering of the recession. Maybe, this recession demonstrates that Euro zone is still younger and weak. The lack of instruments to detect and face these shocks and the difference between countries offers an uncertainly scenario for the euro and Europe. The next macro variable is unemployment. Unemployment is the result of dividing the people who are searching for a job of a country between its active population. Figure 5 shows the unemployment of Northern European countries between 1995 and 2014 and Figure 6 shows the unemployment of Southern European countries between 1995 and 2014.. Figure 5: Unemployment of Northern European countries between 1995-2014. 14.
(15) Source: Data from Eurostat. Figure 6: Unemployment of Southern European countries between 1995-2014. Source: Data from Eurostat. 15.
(16) Unemployment in the Eurozone presents two tendencies. The first one is a decrease from 1995 until the crash of 2008, where unemployment starts to increase. It is not the case of most of the Northern countries as Germany, Netherlands, Austria and Belgium that suffered an increase of unemployment before the crisis of 2008. In fact, Germany is the country which better supported the crisis mainly because they applied internal flexibility measures. In this way, in 2014 the countries with lower unemployment rate were Austria and Germany with a 5%. On the opposite site, Greece with a 26,29% followed by Spain with a 24,7% were the countries with a higher unemployment rate. Comparing the unemployment situation between Northern and Southern European countries it is noticeable the difference of the economies. In 2014 the average unemployment rate of the Northern countries was 7,38% against the 17,52% of Southern countries. Again, this data demonstrates that negative shocks would have asymmetrical impacts on the countries of the euro zone. Thereby, this analysis shows a higher sensibility of the work market on Southern countries, concretely in countries as Spain, Greece and Portugal which facing to similar negative variations of the economic activity have suffered a higher destruction of employment. In the case of Spain, this destruction of employment coincided with the crash of the real estate bubble in 2008. The real estate sector represented an important sector of the Spanish economy. In fact, this sector supposed an employment destruction of 1,4 million between 2008 and 2012. Europe has faced persistent structural unemployment for the past two decades specially when compared to other developed economies as the United States. This high natural rate of unemployment is due to inflexibility of labor markets, substantial unemployment benefit which encourage frictional unemployment, low geographical mobility and rigid labor market regulations which discourage firms to sign new workers. The last macroeconomic variable to analyze is inflation. Inflation is a sustained and rapid increase in aggregate price level, as measured by some aggregate index (such as Consumer Price Index or GDP deflator) over months, quarters or years, and mirrored in the correspondingly decreasing purchasing power of the currency. It has its worst effect on the fixed-wage earners, and is a disincentive for saving. Figure 7 shows the inflation rate of Northern European countries from 1995 to 2014 and Figure 8 shows inflation rate of Southern countries between 1995 and 2014.. 16.
(17) Figure 7: Inflation rate Northern European countries 1995-2014. Source: Data from Eurostat. Figure 8: Inflation rate Southern European countries 1995-2014. Source: Data from Eurostat. 17.
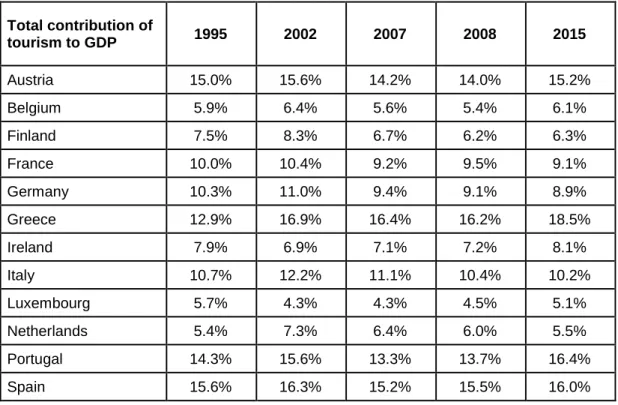
(18) In general, countries of the Eurozone have a similar tendency of inflation rate. Despite of the fact that inflation rates behave similarly, there is one difference between Northern and Southern countries after the introduction of the euro in 1999. It is true that prices increased for all countries in 1999. Despite of this, the introduction of the euro supposed a stability of prices for Southern countries meanwhile Northern countries started to suffer higher variations of its prices. The crash of 2008 was a breaking point. Global economy started a recession period and in 2009 inflation decrease to the lowest levels from the introduction of the euro. This period of uncertainly was followed with an increase of the inflation rate until 2011 where inflation rate started a decreasing period that nowadays is still fighting to recover. This last period coincides with the decrease of the price of the oil.. 5.2 Contribution of tourism sector to countries’ economies On this section the contribution of tourism to the economies of the countries in the Eurozone is explored. The following tables show tourism data for the period starting from 1995 until 2015 and they contain data of key years as 2002 when the euro was introduced, and 2008 and 2015 to see the impact of the recession. To analyze the weight of the tourism sector the first table shows the total contribution of tourism to national GDP, the second table have data of employment contribution to national employment and the third table contains data of the investments made in tourism sector. Table 1: Total contribution of tourism sector to GDP Total contribution of tourism to GDP. 18. 1995. 2002. 2007. 2008. 2015. Austria. 15.0%. 15.6%. 14.2%. 14.0%. 15.2%. Belgium. 5.9%. 6.4%. 5.6%. 5.4%. 6.1%. Finland. 7.5%. 8.3%. 6.7%. 6.2%. 6.3%. France. 10.0%. 10.4%. 9.2%. 9.5%. 9.1%. Germany. 10.3%. 11.0%. 9.4%. 9.1%. 8.9%. Greece. 12.9%. 16.9%. 16.4%. 16.2%. 18.5%. Ireland. 7.9%. 6.9%. 7.1%. 7.2%. 8.1%. Italy. 10.7%. 12.2%. 11.1%. 10.4%. 10.2%. Luxembourg. 5.7%. 4.3%. 4.3%. 4.5%. 5.1%. Netherlands. 5.4%. 7.3%. 6.4%. 6.0%. 5.5%. Portugal. 14.3%. 15.6%. 13.3%. 13.7%. 16.4%. Spain. 15.6%. 16.3%. 15.2%. 15.5%. 16.0%.
(19) Average Eurozone. 10.1%. 10.9%. 9.9%. 9.8%. 10.5%. Source: Data from World Travel and Tourism Council (WTTC). From 1995 to 2015 the contribution of tourism to national GDP has not experienced large changes. Indeed, Greece is the only country which has suffered a bigger impact. From 1995 to 2015 tourism has increased a 5.6 percentage points in Greece, thanks to the weakness of the other productive sectors. The next country with a larger increase in the share of tourism sector on GDP is Portugal with an increase of 2.1 percentage points. On the other side, Germany has decreased a 1.4 percentage points the contribution of tourism sector to GDP. In general, with the exception of Luxemburg and Ireland, there was an increase of the weight of tourism sector on European economies from 1995 to 2002 reaching an average of 10,923% in 2002 instead of a 10,096% on 1995. In 2007 and 2008, there was a decrease of the tourism activity reaching an average of 9,801% due to the global crisis started in 2007. From 2008 until 2015 has been a recovery of the tourism sector, reaching a media of 10,458% for the countries of the Eurozone, still smaller than in 2002.. Table 2: Total contribution of tourism to employment Total contribution tourism to Employment. 19. 1995. 2002. 2007. 2008. 2015. Austria. 15.7%. 16.9%. 15.5%. 15.3%. 16.4%. Belgium. 6.4%. 7.1%. 6.1%. 6.0%. 6.6%. Finland. 7.8%. 8.9%. 7.2%. 6.5%. 6.7%. France. 11.0%. 11.5%. 10.4%. 10.9%. 10.1%. Germany. 13.4%. 14.5%. 12.5%. 12.1%. 12.2%. Greece. 17.6%. 21.6%. 20.3%. 20.0%. 23.1%. Ireland. 7.7%. 7.0%. 7.0%. 7.2%. 8.1%. Italy. 11.1%. 13.1%. 12.5%. 11.7%. 11.6%. Luxembourg. 6.8%. 5.4%. 6.0%. 6.2%. 7.2%. Netherlands. 10.2%. 12.9%. 11.9%. 11.4%. 9.5%. Portugal. 16.0%. 18.3%. 16.0%. 16.7%. 19.3%. Spain. 16.1%. 16.4%. 15.8%. 15.8%. 16.2%. Average Eurozone. 11.7% 12.8% 11.8% 11.6% 12.2% Source: Data from World Travel and Tourism Council (WTTC).
(20) Table 2 shows the contribution of tourism on the national employment. It is interrelated with the contribution of tourism to the GDP and the investments in tourism sector. The employment related with the tourism sector follows the same tendency than the contribution of the GDP by the tourism sector. From 1995 to 2002 there was an increase of the employment related to tourist activity. Again, in 2007 the global crisis had an impact on the tourism sector, consequently employment was destroyed. Despite the contribution of GDP decreased to lower values in 2007 respect to 1995, the employment contribution was similar or higher. This fact could be understood for the precarious jobs related to the tourism sector. Finally highlight the work force of the tourism sector in Greece, where almost one out of four employers works in the tourism sector. Table 3 shows the investment (in billion US) in the tourism sector by countries and per years. In 1995 the total investment of Eurozone countries was of 69,7275 billion dollars. France was the country with a higher investment with 21 billion dollars followed by Germany with an investment of 14 billion dollars. From 1995 to 2002 there was a decrease of 2 billion dollars on the total investment, principally due to France that drastically decreased its investment but it was compensated with the increment of the investment of Italy on the tourism sector. In 2007 total investment reached 123 billion dollars, almost the double of 2002 and in 2008 reached the 146 billion dollars. This increment was boosted principally by the main tourist destinations as France, Spain, Germany, Italy and Greece. In 2015 the total investment decreased to the 111 billion dollars. This decrease was because of the fall on investments of the Southern countries of Europe as Spain, Italy and Greece, which had to cut the investments to face the economic recession. Table 3: Total investment in tourism sector (in billions of US$). 20. Investment (Capital investment) billion US$. 1995. 2002. 2007. 2008. 2015. Austria. 2.90. 3.15. 4.64. 3.39. 3.71. Belgium. 2.52. 1.18. 2.12. 1.99. 2.49. Finland. 0.77. 0.87. 1.25. 1.14. 1.29. France. 21.33. 13.97. 23.03. 31.20. 33.04. Germany. 14.85. 13.34. 20.92. 30.53. 27.80. Greece. 3.14. 4.88. 11.79. 12.05. 2.98. Ireland. 1.17. 1.90. 6.68. 6.36. 4.18. Italy. 6.85. 11.06. 23.85. 22.87. 9.66. Luxembourg. 0.32. 0.31. 0.27. 0.28. 1.06. Netherlands. 3.23. 2.56. 5.29. 5.90. 4.16. Portugal. 1.24. 2.55. 2.98. 4.88. 2.71.
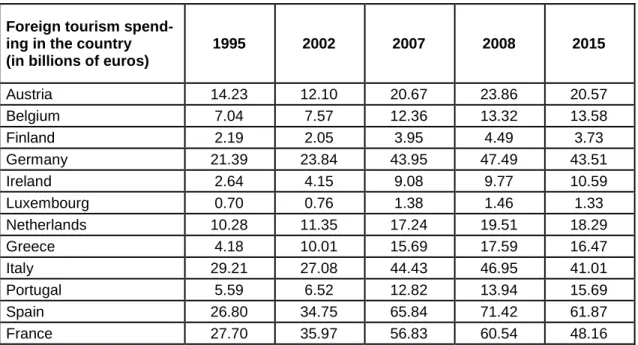
(21) Spain. 11.41. 11.43. 21.04. 25.80. 18.71. Total investment. 69.73 67.19 123.86 146.39 111.79 Source: Data from World Travel and Tourism Council (WTTC). 5.3 Tourism expenditure On this section is analyzed the tourism expenditure both abroad (outbound tourism) and in the country by foreign tourist (inbound tourism). These tables show the same tendency seen before on the other statistics. From the introduction of the euro in 2002 the tourism spending had a significant grown until 2008, year where tourism spending started to decrease due to financial crisis. Again, is visible the sensibility of the tourism sector to the fluctuations of the economy. Moreover, we can see if a country is more able to be an inbound or outbound country. In this way, Germany is the principal outbound country. In 2015 Germany tourists spent 88 billion euros abroad of its country and received only a half of this amount. The second country with a higher tourism spending abroad of its country was France with 45 billion euros in 2015. Despite of this, France has a positive balance of payments thanks to the foreign spending in France. On the other side, in 2015 Spain was the first inbound country with 61 billion euros and followed again by France with 48 billion euros. In order to eliminate the effect of the size of the country, the next table shows the relation between tourism spending abroad and tourism spending in the country:. Table 4: Tourism spending abroad by countries of the Eurozone National tourism spending abroad (in billions of euros) Austria Belgium Finland Germany Ireland Luxembourg Netherlands Greece Italy Portugal Spain France. 21. 1995. 2002. 8.70 9.99 2.69 64.73 2.40. 7.67 11.24 2.31 58.20 3.83 1.15 13.88 2.45 18.76 2.53 8.98 26.42 Source: Data from. 12.84 1.49 16.04 2.43 5.57 19.67. 2007. 2008. 2015. 12.72 13.87 10.83 19.20 20.71 22.02 4.55 5.31 5.49 93.80 102.40 88.58 8.77 10.53 5.29 1.92 2.06 2.18 17.93 20.77 20.21 3.43 3.95 3.43 31.75 36.60 28.89 4.67 5.10 4.77 23.47 26.37 22.73 43.80 48.17 45.79 World Travel and Tourism Council (WTTC).
(22) Table 5: Foreign spending in the countries of the Eurozone Foreign tourism spending in the country (in billions of euros) Austria Belgium Finland Germany Ireland Luxembourg Netherlands Greece Italy Portugal Spain France. 1995. 2002. 2007. 2008. 2015. 14.23 12.10 20.67 23.86 20.57 7.04 7.57 12.36 13.32 13.58 2.19 2.05 3.95 4.49 3.73 21.39 23.84 43.95 47.49 43.51 2.64 4.15 9.08 9.77 10.59 0.70 0.76 1.38 1.46 1.33 10.28 11.35 17.24 19.51 18.29 4.18 10.01 15.69 17.59 16.47 29.21 27.08 44.43 46.95 41.01 5.59 6.52 12.82 13.94 15.69 26.80 34.75 65.84 71.42 61.87 27.70 35.97 56.83 60.54 48.16 Source: Data from World Travel and Tourism Council (WTTC). Table 6 presents the ratio between national tourism spending abroad between foreign spending in the country. In this way, countries with a ratio higher than 100% are net departure countries and countries with a ratio lower than 100% are net receiving countries. In general, all countries have little variations over the years but there are two countries that have an opposite tendency. The first one is Germany. In 1995 Germany spent triple than the money that received. In 2015 this ratio was the double than in 1995 thanks to the increment of tourist arrivals in Germany. The second one is Ireland. The principal economic sector of Ireland is the financial sector. This fact explains how in 2008 Ireland had a ratio of 1 and in 2015 of 0.5. Foreign spending in Ireland was similar in 2008 and 2015, but tourism spending abroad decreased to the half. Table 6: Ratio national tourism spending abroad/ foreign spending in the countries Ratio national tourism spending abroad/ foreign spending in the countries Austria Belgium Finland Germany Ireland Luxembourg Netherlands. 22. 1995. 2002. 2007. 2008. 2015. 61.2% 141.9% 122.9% 302.6% 90.9% 0.0% 125.0%. 63.4% 148.6% 112.5% 244.2% 92.4% 151.5% 122.3%. 61.5% 155.3% 115.1% 213.4% 96.7% 139.2% 104.0%. 58.1% 155.4% 118.2% 215.6% 107.8% 140.8% 106.5%. 52.7% 162.1% 147.3% 203.6% 50.0% 164.7% 110.5%.
(23) Greece Italy Portugal Spain France. 35.7% 24.5% 21.9% 22.4% 20.8% 54.9% 69.3% 71.5% 78.0% 70.4% 43.5% 38.7% 36.4% 36.6% 30.4% 20.8% 25.9% 35.6% 36.9% 36.7% 71.0% 73.5% 77.1% 79.6% 95.1% Source: Data from World Travel and Tourism Council (WTTC). 6. Conclusions. The introduction of the euro has been an important step for the integration of European countries in a single market. From the origin of the project in 1957 until nowadays, nineteen countries have adopted the common currency, that is the euro. Despite of the fact that the European Council established a converge criteria to adopt the euro, in 1998 there was some flexibility to facilitate the entrance of all these countries to the currency union since the good economic perspectives. However, nowadays most of the countries do not meet these criteria but they are in the Eurozone. This fact let me to conclude that the euro was not introduced on an optimal currency area and many problems arose after the financial crash of 2007. As we have seen of this research there are some economic barriers as low labor mobility between the European countries which make countries to present very different unemployment rates. For instance, the unemployment rates of Spain or Greece are three times higher than the rate for Germany. The monetary integration is a mechanism that needs flexibility to face turbulences on the financial markets such as the one generated during the crisis of 2007 which demonstrated the lack of responses or instruments to counter the depression. Despite of these negative aspects of the currency integration, the positive effects of the euro must be a motivation for Europe to take care of the single currency. In general, sharing a common currency provides price transparency, low uncertainty, stability and a reduction of transaction costs between other benefits. The single market and the common currency have made EMU countries more open in terms of capital, trade and tourism flows. This is translated in higher investment level, economic progress and expansion. On section 5, we have seen how the main macroeconomic variables of the countries have behaved since the introduction of the euro in 1999 and it started to circulate in 2002. It means that the standard of living, the employment and the stability of prices are better than before the euro. Against this, European countries have suffered the financial crisis of 2007 as a block. This crisis has been more relevant on the Southern of Europe than in the 23.
(24) Northern. It worth to mention that in 2015 inbound and outbound countries followed the same tendency than in 2002. Southern countries are more able to attract more tourists than being origin countries. In general, Southern countries are net inbound destinations and Northern countries net outbound countries. Particularly, the integration of European countries in a monetary union has beneficiated the tourism sector. The introduction of the euro and the economic expansion in 2002 have produced multiple effects on tourism. The stability and security generated by the integration has boosted the investments on the tourism sector. From 2002 until 2008 there was an increase of 79 billion dollars on tourist investments. As a consequence, destinations have increased and improved their facilities and infrastructures, leading to an increase of its tourist capacity. Prices and transparency on tourism sector have result into an increase of competitiveness and quality and all these factors caused an increase of tourism flows both from other EMU countries and third countries not sharing the euro. However, the negative side of this expansion of the tourism sector after the introduction of the euro is that the employment related to the tourism sector seems to be of low quality (temporary contracts, low salaries and low productivity). In fact, tourism contribution to GDP was of 10.45% in 2015 while tourism contribution to national employment was of 12.24%. On the other hand, the economic growth during the period 2000-2007 increased the wages of European workers, leading to an increase of their purchasing power and so, to a higher liability to travel. The elimination of exchange rate volatility has also motivated tourists to travel. In this way trips to destinations outside the Eurozone are replaced by travels within the Eurozone countries, although in the last year we have also observed an increase on inbound tourism from non-EMU countries.. 24.
(25) 7. Index of tables and figures. Data from Eurostat: Figure 1: Growth rate GDP of Northern European Countries between 1995-2014 Figure 2: Growth rate GDP of Southern European Countries between 1995-2014 Figure 3: Growth rate GDP per capita of Northern European countries between 1995-2014 Figure 4: Growth rate GDP per capita of Southern European countries between 1995-2014 Figure 5: Unemployment of Northern European countries between 1995-2014 Figure 6: Unemployment of Southern European countries between 1995-2014 Figure 7: Inflation rate Northern European countries 1995-2014 Figure 8: Inflation rate Southern European countries 1995-2014 Data from World Travel and Tourism Council (WTTC): Table 1: Total contribution of tourism sector on GDP Table 2: Total contribution of tourism to employment Table 3: Total investment in tourism sector (in billion dollars) Table 4: Tourism spending abroad by countries of the Eurozone Table 5: Foreign spending in the countries of the Eurozone Table 6: Ratio spending abroad between foreign spending in the countries 8. References. Belke, A., & Gros, D. (1998). Asymmetric shocks and EMU: Is there a need for a stability fund?. Catalunya Caixa. (2007). Los criterios de convergencia del tratado de maastricht, quince años después.. Commission of the European communities. (1992). Treaty on European union.. European Commission. (2015). One currency for one Europe, the road to the euro.. Fürrutter, M. (2012). The Eurozone: An optimal currency area?. 25.
(26) Galati, G., & Tsatsaronis, K. (2001). The impact of the euro on Europe’s financial markets.. La gazette officielle du tourisme.(1997). (Nº 1373). París. Ledesma, F. J., Pérez, J. V., & Santana, M. (2010). On the impact of the euro on international tourism.. Ministère de l’Intérieur. (1997). Le passage à la monnaie unique.. Oddo Securities. (2015). Impact of euro depreciation on tourism in Europe.. World Tourism Organization. (1998). The euro impact on tourism.. 26.
(27)
Figure


+5


Documento similar
As pointed out by Saget (2000), the absence of a systematic relation between employment and growth in some countries can come out of the bad quality of the data on
The rigid inflation rate of the monetarists depends on the expansion rate of the quantity of money, the growth rate of real income, the acceleration of the expected rate of
Glarichelys knorri (Gray, 1837): figure 1 = remain of the secondary palatine, dorsal view, from plate 4, figure 3; figure 2: frontal view; figure 3 = lower jaw
As shown in Figure 2 , trends in both lines follow the same path which means that the GDP has a positive effect on exports from the countries concerned. In other words,
Regarding the correlation between loans and GDP, has been analyzed both financial flows and stocks, first by analyzing flows, there are also obtained data in conjunction
This paper estimates the evolution of the total energy use over the period 1995–2015 in four European Union (EU) countries, the Czech Republic, Hungary, Italy, and
A) The online editions of the sample of European quality print newspapers use the opinion section to reinforce the topics and points of view presented in the
The analysis of the economic evolution of the television operators of the major European countries, from 2007 to 2010, is based on three TV models: the public
