Economic and sectoral aspects Commission analyses supplementing its views on enlargement Communication from the Commission, sent to the Council on 20 April 1978 COM (78) 200 final/Part I, 27 April 1978
56
0
0
Texto completo
(2) This publication is also available in the following languages: ISBN ISBN ISBN ISBN ISBN. 92-825-040992-825-041092-825-041292- 825-041392- 825-0414-. A bibliographical slip can be found at the end of. this volume.. Articles and texts appearing in this document may be reproduced freely in whole or in part so long as their source is mentioned.. Printed in Belgium. 1978. ISBN 92- 825-0411-. Catalogue Number: CB- NF-. 78- 003- EN-.
(3) contents Foreword. Part One Survey of . economic tries. developments in the applicant coun-. Spain General characteristics Structure of industry. Greece General characteristics Structure of industry. Portugal General characteristics Structure of industry. Summary Part Two. Economic problems connected with enlargement General problems. Growth and level of development Employment, unemployment and emigration Utilization of resources. Structural changes . The conditions for macroeconomic equilibrium Industly Capacity and fabric of industry. Adjustment to the opening. up of markets. Particular cases . Agriculture. General aspects . Regionalproblems. Part Three. The financial .aspects Financial flows between the applicant countries and the Community of Nine .. The Community budget and the other Community financial instruments Transfers of income and capital Basic assessment factors. Community instruments Requirements and. countries .. Conclusions .. absorption capacity. of the. applicant.
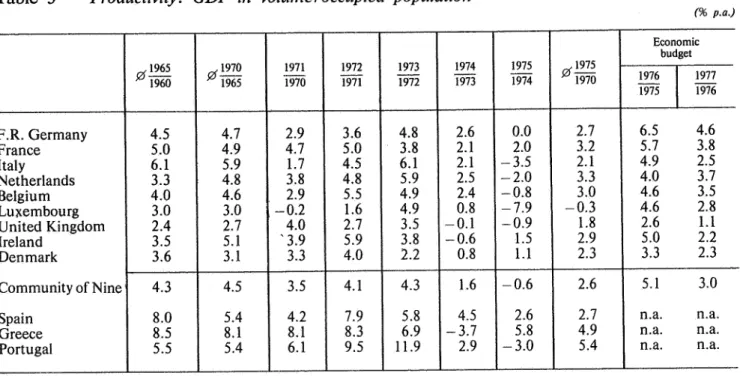
(4) Annexes .. Table Table 2. Growth of GDP (volume) .. Table 3. Productivity: GDP in volume/occupied popula-. Table 4. Gross fixed. capital formation as proportion of. Table 5 Table 6. Occupied civilian labour force by sector of activ-. ity .. tion .. GDP .. Exports as proportion of GDP . Foreign trade in volume and import elasticities. 7- Implicit price deflators for GDP .. Table Table 8. Table 9 Table 10. Compensation of employees as. GDP(value) .. percentage of. Proportion of employees in total labour force GDP adjusted to take Estimates of. per capita. account of purchasing power parities.
(5) Foreword On the basis of an examination. of the. conditions in which each of the three. (growth rates foreign , capital formation, human resources , the sectoral distribution of labour , the geo, public finance trade and balance of payments, price and wage trends analyses the structure of industry), this paper. countries 2 has achieved economic growth over the last fifteen years. graphical location of growth and the economic problems which the applicant countries will face and pose in joining the Community,. This analysis concentrates on their growth capacity and the leeway they have to make up in their development , their employment problems and the effects of those problems in terms of unemployment and emigration of labour, the changes which will have to be made in sharing their resources between immediate and future consumption , and production intended for the home market or export; the substantial structural changes which adjustment will require in terms of rural exodus , sectoral options and regional balance; the major macroeconomic equilibria without which lasting growth cannot be achieved, It was felt necessary to take the general economic analysis a step further by including the main horizontal dimensions of the problems highlighted, Industry.. agriculture , regional problems and the external context have thus been examined in this paper in so far as they appear inseparably linked to the economic study. enlargement. The services sector has not been included owing toa lack of adequate data. All this has revealed that the problems connected with enlargement must be seen in terms of consistency within a Community of Twelve. In the light of these problems and their main dimensions , an initial study has been made of the financial aspects of enlargement. This study is based on a still very approximate but nonetheless useful examination of financial flows between the applicant countries and the present Community, using a simulated national budget for a Community of Twelve in 1978 and estimates (on the basis of past figures) for spontaneous capital transfers and incomes. The results of this exerrole they cise , an attempt to outline existing Community instruments and the capacity of the applay, and an examination of the requirements and absorption plicant countries confirm the economic need for a consistent approach in terms of a Community of Twelve.. I The Commission Communication on which. this Supplement is based consists of analyses further. to its general views on enlargement (Supplements 1/78 and 2/78). 2 Spain , Greece and Portugal.. S. 3/78. conceived.
(6) Part One. Human resources. Survey of economic. 3, Since 1967 the growth rate of the total. Spanish population has been appreciably. development in the. higher than that of the Community s population: + 1 % per year from 1962 to 1970 and +0, 9% per annum from 1970 to 1975 in Spain , and only +0. 8 (1960- 70) and 0, 55%. applicant countries. Spain. (1970- 75). per annum in the. Community.. General characteristics. This difference , which is also found at the level of the growth of the population of working age , is even greater if the growth of. Growth. the labour force is taken into account. In Spain the labour force increased every year. 1, Since 1960 the Spanish economy has. witnessed a long period of intensive growth. As shown in Table 1 , since 1960 the average annual gross domestic product (GDP) in Spain has always exceeded the highest rates recorded in the Community. It is to be noted. that , while the gap between growth in Spain and in the Community widened appreciably. over the period 1970- , the cycles of the two economies were out of phase by ;about one year: in 1975 there. was a marked slack-. ening of growth in the nine - 1.8. Member States. by 0. 8% from 1962 to 1970 and by 1.1 % from 1970 to 1975 , whereas in the Community it increased by only 0. 24% from 1960 to 1970 and by 0.33 % per annum from 1970 to 1975, Whereas this increase in the population constituted one of the factors accounting for the sharp growth in the Spanish economy in the sixties ,. since 1970. owing to the slower trend of economic growth , the gap between the increase in the labour force (+ 1, 1 % per. annum) and the increase in the employed population (only + 0, 6 % per annum since 1970) has been widening.. % of GDP in real terms) but a less ac-. centuated slackening of growth in Spain ( + 0. 8 % of the GDP in real terms); in 1976. Distribution ql the. employed population by. however , whereas the Community economy. sector ql activity and labour productivity. year.. 4. As in the case of the speeding-up of growth , the .contribution of the various sectors has altered; the breakdown of the em-. showed a +4, 7%. rate of growth in its GDP in Spain the rate was only 1.9% for the same. 2. This. long period of growth was. ployed population by sector of activity re~. accom-. panied by fairly profound changes in the relative contributions by agriculture , industry. and services. to GDP. In 1961 ,. agriculture I. accounted for 26. 5% of GDP , industry 33% and services 40. 5%; in 1974 these shares changed to 10.3% for agriculture , 41.9% for industry and 47. 9% for services. It should be. added in this connection that from 1970 to. 1974 it was industry s contribution to GDP which increased regularly, whereas the share of services tended to stabilize and agriculture s share pursued its downward course. The data for 1975 and 1976 contradicting this. trend are due mainly to cyclical factors.. veals a similar development , but less marked:. from 1962. to 1965, the annual average. employed population engaged in agriculture was 36, 2 %, whereas in 1975 it was only 22%; percentage of the. for industry, the equivalent percentages. were 34. 7% (1962- 65) and 38.3% (1975), and. I In. the broad sense ' of the term , i.e.. including forestry. and fisheries.. S. 3/78.
(7) for services , 29.1. % 0962- 65). and 39.. 0975).. A comparison of these facts with the structure of GDP by sector of activity indicates widely differing trends in the apparent productivity of labour.. 5. Taken. 7. Since 1960, Spain has regularly us~. an. increasing share of GDP for capital formation , reaching on average from 1970 to 1975 rates as high as in France and the Netherlands and in any event higher than Commu-. overall, GDP per employed person. increased from 1962 to 1975 at an annual rate of about 6. 5 %. It is , however , mainly the industrial sector that achieved a high performance (about + 7. 5 % per annum over the period in. Capital formation. question) whereas services and. above all agriculture recorded appreciably smaller average annual increases in productivity (about + 5 % and + 3.5 respectively from 1962 to 1975). As a result of this dual trend of employed population and productivity, agriculture , which still employed 2. 8 mil-. nity average. In order to assess this trend be taken of the fact that the Spanish labour force has in-. account must nevertheless. creased by about 0. 9% per annum since 1960 , whereas in the Community the rate was only 0. 24% in the sixties and has been since 1970. The mere mainteonly 0.33 nance in Spain of the capital stock per person. gainfully employed therefore meant that gross fixed capital formation increased pro-. portionally faster than in the Community; it is therefore the additional increase in gross. much lower. lion workers in 1975 , continues to have a level of productivity than the. fixed capital formation that indicates the effort made in Spain to step up the amount of capital per person gainfully employed.. and consequently and this feamarked underemployment ture is today proportionally more accentuated than it could have been in the early sixties.. Furthermore, owing to the low initial level of public infrastructure and the major effort to develop tourist facilities , building and construction occupied a regularly growing share. It is probable, furthermore , that following. of gross fixed. rest of the economy. this period of rural depopulation , the average age of those still engaged in agriculture is quite high.. 6. As. regards the results in terms of em-. ployment the growth performance has not. made it possible to eliminate unemployment or to stem the tide of emigration. Admittedly, during the sixties , unemployment settled at a low level 0. 1.9% of the labour force) and there was a very sharp improvement in net emigration (91 000 in 1964 as against 21 000 in 1970). Since the beginning of the seventies, however ,. capital formation until 1974.. More recently, however ,. in 1975 and 1976 whereas the share of total investments in GDP declined , the share of investment in. plant and machinery remained relatively stable. According to the latest statistics available , this phenomenon recurred in 1977 while the share of gross fixed asset capital formation in GDP again decreased. It therefore seems that the. present cyclical slowinvestment in plant. down has not touched. and machinery, and this would suggest that the present trend of productivity in Spanish industry will be maintained.. there has been another. emigration: the unemployment rate was 5.3% of the la-. upsurge in unemployment and. External trade. bour force in 1976 and net emigration stood fact that ,. features-illustrate the given the mode of growth chosen job creation in industry has proved clearly in-. 8. The period 1960- 75 is marked by the progressive re- integration of Spain into the international economic scene after a long. sufficient to absorb the annual increase in the labour force and in the number of workers released annually from agriculture.. phase of reliance on protectionism. The development of exports of goods and services illustrates this very clearly: they grew so. at 134000. These two. S. 3/78.
(8) much faster than GDP itself that their share in GDP rose from an average of 10% for the. period 1961- 65 to almost 15% in 1975; this corresponds to an average annual growth rate in real terms of 10, 2% (1965- 70). (1961- 65),. then 14,. and 5. 8% (1970- 75).. This phenomenon is linked with the development of industrial potential (share of investment in. plant and machinery). and. growth of industry s contribution to GDP for during the sixties Spain expanded its exports of manufactures to such an extent that. it made considerable gains in market shares. These gains were concentrated in the market of the Community of Six (partiaularly Germany and France) and of. North America.. From 1964 to 1971 the average annual increase in Spanish exports may be estimated at 17.4 % in relation to total Community imports of manufactures , and at 18. 9% in relation to total North American imports, At the. same time Spanish. foodstuffs (+9% per annum on real terms from 1964 to 1971) progressively replaced exports of agricultural products (only + 2 % per annum in real terms over the same period). exports of. improvement in export results indicates that the Spanish supply of manufactures has progressively adapt-. This tendency towards an. on overall terms of competitiveness favourable to it. It must ne-. ed to world demand. prosuccess on foreign. vertheless be said that the processed. ducts to which Spanish. markets is due are either consumer. which are at present ' sensitive '. goods. (footwear. textiles) or intermediate goods (such as steel) for which the world market is very tight; in both cases competition centres on prices. By choosing in this way to base the growth of its exports on this type of goods , Spain has made its trade balance dependent upon moderating rises in production costs , particularly wage and salary costs.. during this period imports , which increased in. volume by 24% per annum , were in fact induced by. large-scale investment in basic. plant and machinery (an increase in investment of 14. 2 % per annum in real terms over the same period). A system of aid for the import of capital goods was introduced by the Spanish authorities, Once this initial phase of investment in plant and machinery. it was to be expected. was over. that growth of imports. would slacken . and that at the same time the elasticity of imports would stabilize at lower levels (1.2 from 1965 to 1970 and 1.5 from 1970 to 1975). Other factors lead one, however , to inquire as to the real causes of such. a restrained growth of Spanish imports.. Firstly the tariff protection enjoyed by the Spanish economy must be considered: it is interesting in this connection to recall that from 1968 to 1970 import. duties represented. on average 14. 6 % of total imports as against. for example , only 5. 5% in Italy and 3, 7% in Germany. 1 In this context it seems necessary to evaluate the real extent of the tariff liberalization measures adopted since 1972. and in any event to have a recent. estimate. of the degree of protection of the. Spanish. economy. Secondly, although import substitution has occurred since about 1965 , it may be asked how Spanish imports and particularly imports of agricultural products and foodstuffs would develop in the absence of deliberate policies on the part of the auon this matter (quotas , state- trading, thorities. etc, ); it should be added in this context. that. the drop in the share of agricultural products and foodstuffs in total imports and the consequent soaring food prices since 1965 in particular have led to moderate growth of private consumption in. real terms?. 9. With regard to imports , a sal.ient feature of the Spanish. economy in the sixties , as in-. dicated in Table 6 was considerable elasticity of imports in. relati,on to the growth of. GDP in real terms. More precisely, this elasticity was at its greatest from 1960 to 1965;. I 9. 8%. in Italy and 7.3% in Germany if import duties. are taken in relation to Italian and German imports from outside the Community. 2 8.4% per annum in real terms from 1960 to 1965, 8% from 1965 to 1970 and 5. 7% from 1970 to 1975.. S. 3/78.
(9) (-. ing to estimates available to the Commission. Balance of payments trends. and the OECD Secretariat,. 10, From 1970 to 1973 , Spain had a surplus on current account , 1 in contrast to the trend. since 1964. This result was made possible by the export growth described above, the renewal of emigration (and therefore further in-. transfers of earnings by Spanish workers abroad), the continuing gains from. creases in. tourism , substantial drop in freight payments. (the Spanish merchant navy expanded each year by about 8% in real terms - a rate exceeded only by Japan) and lastly the very modest increase in imports,. 11. Since the early sixties , moreover , Spain has been a net importer of long-term capital which has been channelled into both industrial and real estate investments. From 1970 to 1973 the development of the balance of. payments was also marked by a substantial increase in foreign exchange reserves (more million over the four years).. than USD 4 500. From 1970 to 1973 the resulting regular increase in the ratio of exchange reserves to average monthly imports in Spain was on the. same level as that of Japan , Germany and Switzerland in 1972,. count deficit. It should be pointed out that this deficit is largely due to the higher price of oil imports which represent about 50% of Spain s trade deficit. Long- term imports of capital have not sufficed to cover this current account deficit and so Spain has drawn on its reserves USD I 800 million in 1974 , 1975 and 1976) and has borrowed a moderate. amount from the IMF (about USD 700 million from the oil facility) and on the Euromarkets. Recents events tend to indicate that. Spain is pursuing a policy of competitive de-. valuation,. whether foodstuffs or manufactures, It is particularly worrying for these last two years since Spain saw in 1976. fected all products,. and 1977 both a very modest expansion of 2 and a slowing-. down of the. consumption. rise in unit labour costs; international. tion combined. peseta must therefore have played a relatively important part in the recent acceleration of inflation in Spain,. 14. In. the early seventies rapidly rising. wages and salaries certainly accounted to a. large extent for the general rise in prices, If account is taken , however , of the trend of the proportion of wage and salary earners in the total labour force (see Tables 8 and 9), the long- term development of the. remuneration in GDP. does not. share of. indicate an. upward trend, In addition , the rise in wage. costs per unit of output slowed down sub-. , which suggests that wage. and salary costs played a relatively less role. cisive. de-. in the acceleration of inflation in. Spain in late 1976. and early 1.977,. Public finance 15, From 1973 to 1976 gross saving by the public authorities was positive; in 1976 ,. uses. and capital resources taken into account ,. ac-. provisional estimates they had a slight surplus of about Ptas 17 000 million. cording to. (some 0. 2 % of GDP), The growth of. prospects for the. public finances depend on the. for which the. Government has announced the following. Prices and wages. 13. Since 1960 the Spanish economy has alrises appreciably. higher than the average rate of inflation in the Community, as Table 7 shows. Accord-. S. 3/78. infla-. with the devaluation of the. achievement of tax reform ,. ways had a rate of price. even. and 1977:. whereas in the Community inflation is slowing down , in Spain the acceleration has , on the contrary, been very marked, With regard to consumer prices , this phenomenon has af-. stantially in 1976. 12. Since 1974 Spain has had a current ac-. this trend. worsened significantly in 1976. I Goods, services, factor income, private and public. transfers. Private consumption in real terms. + 2. 7'fb. in 1976. and + 1.5 % in 1977 , according to the estimates of the GECD. Secretariat..
(10) the income of natural persons , of a comprehensive , personal and progressive nature, the in-. guidelines: the introduction of a tax on. troduction of a tax on wealth , the restructur-. ing and rationalization. of indirect taxes. 1955- 1973, as a result. of large-scale migra-. tions rather than the spread. of economic. growth, Assuming that the process of industrialization and expansion of the services sector continues, spontaneous tendencies to-. which would be harmonized with the Euro-. wards increased urbanization and concentra-. pean taxation system. tion of. , and in particular the. introduction of value-added tax. Total receipts from taxes and social security. activity will remain strong.. contributions increased from 17% of GDP in 1970 to 20% of GDP in 1975 and were at an appreciably lower level than in the Community countries (EEC 1970- 75: Italy 30% of GDP , Netherlands 48% of GDP). Social se-. Structure of industry. curity contributions represented 47,. the real growth growth rates of the gross in-. 5% of. these receipts in 1975 (Italy: 44.4%; France: 39, 9 %; for the same year).. Value added. 17. In 1976,. the contribution of industry to. GDP was about 41 %, From 1973. to 1976. dustrial product (value added). industry. and its main components were as follows: 1974- 1973. Geographical location Qf growth. 16. The considerable economic boom in Spain since 1960, based mainly on the growth of the industrial and services sectors has resulted in substantial changes in the. of. Mining Manufacturing industries Electricity, gas, water Building and construction. 1976- 1975. 0.4 5.4 4.4. Total industry. geographical distribution of the population. 1975- 1974. 1.4. ~ 1.9. 1.0. 2.5. 2.4. with increased concentration in the industrial. areas and large towns, Internal. migratory. movements have been on a very large scale affecting 6 million inhabitants between 1950. and 1970, This has. led to:. large-scale concentration of the tion in provinces with the highest. Gross industrial product (excluding building and construction) 1.. Mining. 2.. Manufacturing industries. 89.5. Food, beverages and tabacco. 12. 12.. popula-. Textiles, food. per capita. Wood, cork and furniture Paper , publishing and printing Chemical products Oil and coal by- products. income (Biscay, Madrid , Guipuzcoa , Barcelona), which already had a high degree of population density. In 1975 , these four provinces , together with the provinces of Corun, Oviedo , Seville and Valencia , accounted for 45. 7% of the population compared with 44% in' 1970 and 38% in 1960; a considerable loss of population in the central provinces around Madrid , in the south and along the frontier with Portugal. The ten per capita income have an average density of 30 to 40. wear and garments. 1.8. Non-metallic mineral products. Base metal industries. 10.. Metal goods. Electrical and non- electrical machinery Transport equipment Miscellaneous pwducts (including leather. 6.4. and rubber) 3.. 13.. Electricity, gas and water. provinces with the lowest. Total for all industry (excluding building and construction. 100.. inhabitants per square kilometre,. There was some reduction in income differentials between regions during the period. Ministry of Industrial Affairs, ' La Madrid 1977.. Source:. Industria Espanola en 1976'. S. 3/78.
(11) Employment Size. 18. In 1974 ,. % of. % of. number. industrial. of firms. emplo)DTIent. employment was made up as. follows by sector (in %):. 71.8 28.. up to 5 employees. Metal processing Food products. 24. 10.5. Non-metallic ores Textiles Garments Transport. 6 to 500 , employees. over 500 employees. 8.4. Exports. Furniture, etc.. exports of goods and ser-. Chemicals. 19. In general ,. Base metals. vices account for only a small proportion of. Miscellaneous plastic (etc,. GDP in Spain (13. 5% in 1974- 75), The pro-. Paper and cardboard. Beverages Wood and cork Rubber. 1.9 1.3. Leather and hides. Tobacco. Oil and coal. ports in 1975 according to the nine sections I and destination of the exports: of the SITC. by- products. breakdown of industrial units by size showed a marked preponderance of very small firms , though most of the labour force was employed in medium-sized units:. Standard International Trade Classification.. 1975. Spain.. Exports in. Community. Total. of Nine. SITC section. I 342.4. 17.. 238. 236. 252. 120.. 1.5. 416.. 5.4 25. 25. 14.5. 1974. 1976. 1 116.. 891.4. 66.4. 451.5. 123. 148.4. 51.8 62. 63. 38. 34. 39.3 34. 40. 26.. 114. 87.. 160. 46. 141.9 777. 638.. 450.. 0.1. 7675.4. 100.. Countries outside Community of Nine. 3 426.. 44.. 92. 73. 274. 1 197.. 1284. 666.. Countries outside Community. 33: 48.. 422. 114.. 37.1. 81.5. 36.4 61.2 65. 60. 65. 59.. 83. 72.6 243. 1 158.. 1417. 655.4. 74.. 4249.. 55.. Japan. Canada. USA. of Twelve. mio USD. mio USD. mio USD. mio USD. S. 3/78. portion of services in exports is large, and in exports of goods manufactured products are by far the largest item (67.4%), accounting for 5. 3% of GDP in 1974- 1975, The following table gives a breakdown of ex-. 3985.. 9'0. 13.. 31.4 48. 34. 33.. 109.. 60.1 58.3 58. 58.3 58. 73.. 13.. 335. 3.5. 30. 39.3. 26.. 51.9. 806.. 10.5. 89.1. 27.6. 11.5. 4.4. 1.0 1.8. 53. 1.8. 1.3. 19.1. 11.3. 17. 10 1.1. mio USD. mio USD. mio USD. 10.1. 1.2. 1.3. 1.2. 11.0. 31.5. 0.3. 1.5. 0.4. 79.. 8.4. l.l l.l. 1.0. 91.3.
(12) The share of the Community of Nine , which was 44. 6% of the total in 1975 and 46% in ex-. it must be noted that the transport, warehousing and communications subsector which is particularly highly developed in Greece , contributed 8, 5% of GDP in 1975). tobacco,. reflects the key role played by this sector in. 1976, is higher for food products , and. stock, mineral fuels , ed products ,. live-. lubricants and associat-. non-edible raw materials,. cluding fuels ,. and beverages. and. the level attained in the Community (though. which respectively accounted for 17.4 %, 2%, 3, 0% and 3.1 % of total Spanish ex-. despite a trade deficit of some USD 2 000 million , Spain recorded a surplus in trade with the Community in some sectors such as animal and vegetable oils and fats and various manufactured products.. Greece s development over the years,. last fifteen. ports, In 1975 ,. Human resources population is. particularly low (0.3. per year), partly as a result of the. to 0.. low birth. rate (155 births per thousand inhabitants in. Greece. for example, 14.1 in France but 19. 6 in Portugal , 18.3 in Spain. 1975 compared with ,. and 21, 6. General characteristics. in Ireland). The employed labour. force actually contracted from 1961. at an annual. Growth. 20. Since. total. 21. The annual growth of Greece. to 1971. rate of around O, 9%-even. though the unemployment rate was reduced. 1960 Greece has had one of the. highest growth rates of all the OECD ) countries; in addition , it has been relatively unaffected in recent years by the slowdown in economic activity (see Table 1), with the result that from the middle of the period under review the gap between growth in Greece. and in the Community has tended to widen slightly, Among the factors that have made this growth possible are the trend of productivity, which differed according to the sector. and the transfers of labour: the effect. has. appreciably over the same period, However at the beginning of the seventies emigration. was tending to stabilize at levels lower than in succeeding years and indeed gave way to net immigration in 1975 and 1976. Distribution of the labour force. by sector of activity and trend of labour. 22. The. productivity sectoral distribution of the. labour force has also. Greek. undergone marked. been to modify quite appreciably the relative importance of the various sectors. Agriculture , for instance , accounted in 1961 for approximately 26. 3 % of GDP compared with 16. 7% in 1975~an appreciably slower rate of. changes but has presented in recent years a. corresponding figures for industry are 25 % in 1961 compared with 31.8% in 1975 , and for. absolute terms by around 4.5% per. change than in Spain , for example; 1 the. services 48;7% in 1961 and 51.6% in 1975, It would seem therefore that not only has agriculture lost relatively little of its importance but that at the same time the industrial sector , because of the very low starting point has not yet reached the stage of providing a. very substantial share of GDP; the fact that the share of the services sector is already at. rather different profile from that in Spain or Portugal (Table 2), The proportion of Greece labour force employed in agriculture was still 35.4% in 1975 (compared with ~n average 56.3 % in 1961- 65) and although it declined in year. from 1961 to 1971. , it would seem that since the beginning of the seventies the rate of contraction has been only around 2 %. More-. over , the average age of the labour force employed in agriculture is markedly higher than in the other. sectors. Consequently, the in-. dustrial and services sectors. employ relative-. Point 6.. S. 3/78.
(13) ly small proportions of the labour force ,. al-. though this phenomenon is appreciably less marked in the case of services (3.4% of the. cline in non-residential construction. (45.5%. of total gross fixed capital formation in 19.60. 36 % in. 1975) and a sharp drop in. residential. labour force in 1975) than in the case of inthe labour force in the dustry (28.. construction from 1974 only (31.6% of the total in 1974 , 30, 8% in 1975 and 21.3% in. same year),. 1976), This long-. 2% of. In parallel to this sectoral trend , in the Greek labour force there has continued to be a very considerable preponderance of self-employed. workers, The 1971 census shows that in. Greece self-employed workers (including family helpers) accounted for nearly 60% of the labour force compared with the OECD average of 10- 20% (in Ireland , Italy, Japan. and Spain the rate is 30 %). Quite apart from. the fact that industry s low contribution to GDP may in itself be a possible explanation. this abnormally low proportion of wage and. salary earners would indicate that the industry and services sectors comprise mainly medium-sized and small firms and that consequently productivity in those sectors must be relatively low ,. in some branches at least.. Greek productivity overall has increased very. term trend is reflected,. moreover, in the relative shares of total gross fixed capital formation (Table 4) provided by the main sectors: agriculture and industry,. which each contributed. 18, 5%. in 1960 ,. ac-. counted for 10.5% and ?R 2% respectively in 1965 , while the proportion for services de61.3%. clined from 63.. 2% to. External trade. 24. The strong. growth of. Greek exports. since 1960 has resulted in a very significant increase in the contribution of exports to. GDP (Table 5). Thus Greek exports account-. ed for a bare 8 % of GDP on average in 1961- 65 but for over 13. 5% on average in 1973- 75 , thus catching up with the level achieved by. Spain. Under the influence of. rapidly, The sectoral breakdown of productiv-. the Association Agreement Greek exports. ity growth reveals large gains in agriculture in the 1961- 71 period (though this development was to lose impetus appreciably after. munity, which barely absorbed 40% of total Greek exports in 1959 but 50% in 1975-an. 1971), whereas smaller gains were registered by industry and services in the same period (but productivity in manufacturing has been. increasing fast since 1971).. have been directed mainly towards the Comappreciably higher level than for Spain , for. example (barely 45%), The product structure of Greek exports has undergone rapid change since 1960: .exports. of agricultural products,. raw materials and primary products still accounted for nearly 86% of the total in 1959 but represented only 50% of total exports in. Capital .formation. 1974. 23. Between 1960 and 1975 the proportion. of GDP set aside. capital formation in Greece was higher than the average for the Community countries, Investment plummeted in 1974 ,. for. however , and has remained at a. Compared with other countries ,. however. Greece is lagging in exports of manufactures: in 1974 they. represented only 50% of the. total compared with over 70% for Portugal and. depressed level since then: for example vestment amounted to over 26. 5 % of GDP in 1973 but accounted for under 20% in. Spain and 80% for the Community as a whole. Furthermore , because the handicap of. 1975,. ficiently offset ,. , in-. The breakdown of capital formation by type. of capital goods reveals a steady rise up to 1972- 73 in capital formation in plant and ma-. chinery, while the trend in building and construction was marked by a continuous deS. 3/78. the product. structure has not yet been sufthe long- term trend of. share in the external market does not appear to show any substantial gains for its economy.. Greece s. 25, With regard to imports (Table 6) their. rate of increase is twice as high as that of GDP;.
(14) they comprise mainly plant and machinery. (over 35% of total in 1974) and energy products (over 22% of the total in the same. year), It should be. remembered however. s industrial potential is relatively little developed (by comparison with services. that Greece. Community: this trend has been reversed inflation slowed down distinctly in 1977. Higher labour costs have contributed relatively more than the higher import prices to the sharp acceleration of inflation in the last few years, although Greece. since 1973. for example), whereas industrial investment involves a high level of imports of foreign plant and machinery. It is probably, there-. fore , that an acceleration of industrial growth in Greece would be accompanied by greater elasticity of imports.. Public finance 28. Although. complete figures. thE' following remarks can be made: current saving by the State was. positive from 1965. to 1975;. central govern-. ment saving, which was positive from 1965. Balance of payments trends. deficit on current account recorded annually by Greece since the beginning of the fifties does not seem to have constituted. 26, The. a particularly severe constraint on economic policy judging by the growth rate achieved since 1960. Furthermore , the stability of the. exchange rate (no devaluation between 1953. and 1971) shows that the Greek economy has not experienced any abrupt change in. the trend of its balance of payments. Until 1971 the main tendency was for the trade deficit to rise steadily but a sharp improvement in invisible earnings (freight costs. to 1973, became negative in 1974 and 1975 (seen from the angle of national accounts),. As regards. the structure of public revenue. total receipts from taxes and social. security. contributions accounted on average. in 1970-. 75 for around 24% of GDP (Italy, 30% and Netherlands , 48 % of GDP). Of the total receipts from taxes and social security contributions , current taxes on income and wealth accounted for 18% in 1976 (12.5% on average in the 1970- 76 period) while social security contributions accounted for 28 %. Moreover , the low rate of growth of receipts from. income tax appears to be attributable in part. and especially tourism and remittances from. to tax evasion and tax avoidance,. Greek emigrants abroad) ensured that the di~ ficit on current account increased at a correspondingly slower rate, Since 1973 the com-. The geographical location qf growth. bined effect of oil price increases (which affects imports) and the marked slowing down of economic activity abroad (which affects factor income and services) has been that the invisibles balance no longer offsets the trade deficit to the same extent , with the result that the current deficit has appreciably. worsened. This recent deterioration has been financed mainly by an increase in inflows of capital for the purchase of immovable proper-. ty and a district rise in inflows. private purposes, capital for industrial investment of. 29. The Greek economy is characterized by. large-scale concentration of the population and growth in Attica. Because of the pull of Athens and Piraeus , this region , with 3% of the surface area of the country, accounted for 32% of the population in 1971 and about 47% of GDP in 1965. 1 The population density of. Greater Athens was 5 935 inhabitants. Prices. per. square kilometre (compared with a populainhabitants per tion density of 34 to square kilometre in the other regions), and. 80. per. capita. GDP about twice as high as in. most of the. 27. During. are not. available at present ,. other regions. From 1961 to. I Because. the sixties the rate of inflation the. in Greece was appreciably slower than in. of the concentration of growth and populas GDP to national GDP in 1971 will have been much higher than the 1965 figure of 47%. tion in Athens, the contribution of Attica. S. 3/78.
(15) (%. During the period. 1962- 1976 ,. creased by 37% at the expense of nearly all. the manufacturing. sector at factor cost. the other regions. The heaviest depopulation was suffered by the poorest regions; this pro-. rapidly.. cess continued from 1970 to 1975.. Production of manl,ffacturing sector. 1971 , the population of the Athens region in-. production in rose. annual increase in volume terms). The socio-economic structure of. the popula-. tion in the various regions suggesis that fu-. ture economic growth , by producing changes. structures (fall in the propor-. in productive tion of the labour force working in. agricul-. 1962 1963 1964 1965. 5.3 12. 10.. 1967 1968 1969 1970. 1972 1973 1974 1975. 11.6 14. 15.. 17. 5.1. ture and rise in other sectors) will tend to in-. crease concentration in the Athens- Piraeus. region and depopulation in the other regions,. dustry in GDP rose from 14. 3% in 1960 to 22% in 1976. However , the share of industry. and particularly manufacturing ' industry in. Structure of industry. 30. In 1975 , the industrial sector accounted for 31, 8 % of GDP. 25. 9%. As a result , the share of manufacturing in~. in 1960. From 1970. to. as a whole , as against 1975 , GDP was. made up as follows by sector of activity.. total production remains below the level in Spain and especially Portugal.. From 1962. manufacturing sector changed as follows: 1970. 18.. Agriculture Mining Manufacturing industries Building and construction Electricity, gas, water Transport and communications Other services. 1.4 19.. 1971. 1972. 1973. 42. 100. 1974. 1975. 17. 1.4 19.. 17. 1.5. 15. 1.5. 16. 1.5. 16. 1.5. 19.4. 21.0. 20.. 20.. 9.4. 10.. 2.4. 2.4. Total GDP Source:. to 1975 , the structure of the. 42.1 100. 41.5 100. 41.5 100. 43.4 100. 43. 100. OECD.. Structure of the product of manufacturing industry. Foodstuffs, Textiles. beverages, tobacco. Garments, footwear. Wood, furniture Paper, printing, publishing Chemical products Non-metal minerals. 1970. 1973. 20.. 21.4. 20.. 15.. 15.. 17. 15.. 11.6. 11.0. 15. 10.. 18. 14.. 1975. 17.4 17.. 9.4 11.2. 12.. 13.. 7.4 1.6 15.. Transport equipment. 1.4 13.. 7.4 13.. 12.. 13.. 12.. 3.3. Miscellaneous Total industrial products. S. 3/78. 1968. 4.1. Metal products, machinery. National Accounts.. 1965. 10.. Base metals. Source:. 1962. 100. 100. 100. 100. 100. 100.
(16) 31. The following table gives a breakdown of value added and employment by sector in. manufacturing industry:. percentage is relatively low compared with. other two applicant. countries. In 1975 , the towards exports. industries most orientated. were leather products , garment manufacture. Industrial sector, breakdown. value added. of. and employment Value added (1973) as %. furs and footwear ,. petroleum products, base metallurgy, and non-metal minerals (mainly cement).. Employ-. Numbers employed. ment as % of total. of total. Industrial sector. Food products Beverages Tobacco Textiles Garments and footwear Wood and cork. 10.. 89 285. Exports as % of;. % share. the value. added of. exports of manufactured. production. products. 14.. 12307. 9049 16.. 68 419 72 030. 1.5 11.3 11.9. 34406. Furniture Paper Publishing and printing Leather Rubber and plastics Chemical products. 1.2. 29 445. 2.4. IS 963 13061. 7971. 1.3. Non-metal minerals Base metal industries Metal products Non-electrical equipment Electrical equipment. 6.3 7.4. 20 255. 3765 37465 7859 47850 23697 30473. 3.4. Miscellaneous Total. 11.9. Beverages Tabacco Textiles Garments and footwear Wood and cork. 10. 0.1. 14.4 38.. 100. 1.6. Base metal Industries. 21.3 33. 23. 34.. Metal products. 13.. Oil and coal. Non metal mine rals. 15. 13.. Machines and equipment Transport equipment. Electrical machinery and equipment. 1975.. very marked preponderance of small firms employing less than ten persons (more than 90% of all firms in manufactur-. 11.0 11.3. 43.. Miscellaneous Statistical yearbook for Greece. 13.. 1.9. Paper Publishing and printing Leather and furs Rubber and plastics. Chemical products 1.3. 52 808 12 102. Transport equipment. Food products. Furniture. 15 832. 8.4. Oil and coal. Source:. in total. Total. 25.. 1.0. 16.. 100. There is a. ing industry). These. small firms employ. more than a fifth of the all those working in industry. Exports of manufactured products. 32. Though manufacturing industry pro-. duces mainly for the home market (about 83% of gross production), exports of manu-. The table on page 17 shows the destination of exports in 1975, broken down according to the nine sections of the. SITC.. The share of the Community of Nine , which was 42, 5% of the total in 1975 , is highest for the following sectors: animal and vegetable oils and fats , miscellaneous manufactured articles, mineral fuels , lubricants and by- pro-. ducts, In. 1975. Greece recorded. a. USD I 130. 5 million total trading deficit with. the EEC , but recorded a surplus for food. factured products have grown steadily, rising. from 10. 2 % of. total exports in 1965 1. to 52. 7% in 1976 (I.e. about 5% of GDP). This. I Year. in which the industrial complexes built between. 1960 and 1965 began to export.. S. 3/78.
(17) 1975. Greece: Exports in. of Nine. SITC. section. 0-9. 2 278.. 22.. 11.0 1.8 28.. 9.4 100.. 206.. 74. 366. 65. 81.8. 40. 64. 58. 40. 30. 56. 56.1 73.4 37.. 1146.4. 50.. 1103.. 59. 35.3. 207. 120.. 41.6. 116.. lOLl. 133.. 59. 70. 43. 43. 26. 62.. 1132.. 49.. 300. 65. 83. 150.4 29.4 58.4 286.4 23.. 12.. 120. 103.. 99. 12.. 67. 346. 65. 81.7. 40. 64.. 9.1 27.1. 51.5. 16.. 39. 29. 50. 53. 73.. 11.3. .37.. 39.1. Japan. Canada. USA. mlO. mio USD. mio USD. mio USD. mio USD. mio USD. mio USD 508. 185. 199. 251.5 42. 133.4 652. 88. 215.. Countries outside Countries outside Community Community of Twe1ve of Nine. Commun.ity. Total. USD 1.7. 1.7 14.. 0.4. 24.. 13.. 1.0 1.0. 4.4 1.4. 1.0. 1.3. 15.. 115.. 48.. 0.1. 1.3. 18.. 36.. 1.6. co mineral fuels , lubricants and associated. for the smallest share (under 39% as against over 51 % in Greece and over 48 % in Spain).. laneous manufactured articles,. Human resources. products and livestock, beverages and tobac-. ~ducts, animal oils and fats and miscel34. The. population of Portugal has been in-. creasing since 1965 at a rate of around 0.4%. per annum. To this natural trend should be added, at least for 1974 and 1975 , the repatriation of around 500 000 people of whom a. Portugal General characteristics. relatively small proportion were 65 or older.. Leaving aside trends over the last two years. Growth 33. From. 1960 to 1973 Portugal experienced. long period of sustained growth , with the exception of 1966 and 1969, when there was a slowdown. This performance ,. better than that of any. which was. Member State of. the Community, was not , however , as good. as that of Spain and Greece. for the same. period, ! Portugal's growth is mainly based on. the industrial sector: industry. share of. GDP rose from under 40% in 1962. to over. 47% in 1975 , whereas agriculture s share. dropped from 24, S % in 1962 to under 12 in 1975 and services went from 36% in 1962 to 41. % in 1975. Consequently, as a result. the Portuguese labour force has tended to increase by slightly more than 0, 5% per annum over an average period (since 1965); this. pattern is the result of the combined effects of a fairly sharp annual increase in the population of working age (over 1.5% per annum) and a progressive. decrease in the rate. 2 % in 1965 as against 62.4% As in the case of Spain, emigration. of activity 2 (70.. in 1975),. 000 to 150000 people per notable exception of 1974-. is high (around 110. annum), with the. 75 when this trend was very sharply reversed. following repatriations, Distribution of the labour force. the changes in production structures that have accompanied growth , Portugal (which. and labour activity. , incidentally, by far the poorest of. the applicant countries) is the one where Industry accounts for the largest share of GDP (over. breakdown of GDP by sector of origin is not. 47% as against 32% in Greece and barely 41 % in Spain) and where services account S. 3/78. 35. It is. paradoxical that in Portugal the. I Table. Defined as the ratio between the labour force and the population of working age..
(18) %.. reflected in the structure of the employed. labour force, Thus indu$try, accounting for over 47% of GDP , employed only 33. 5% of the labour force in 1975 , as against correof 41 and close on in Spain for example. Recent figures. sponding proportions 35, 5%. show that services account for about 33 % of GDP but roughly '38, 5% of the employed la-. bour force, Over the whole ten- year. period. Greece and over 22% in the Community. In. 1975 it was even down to less than 13%,. Since the mid-sixties ,. the relative share of in-. vestments in agriculture has decreased steadily, although the very marked slowdown in. gross fixed capital formation in 1974. and. 1975 did not affect agriculture and had . relatively little effect on industry but was con-. centrated on services.. the number of people engaged in agriculture decreased by around 3 % per annum 1965- 75. whereas services showed and annual increase of close on 2 % and industry was slightly less than 1%.. Portugal' s fairly favourable performance since. 1960 as regards overall productivity (table 3) sector of over. is largely attributable to the industrial. (annual increase. in productivity. External trade. 37. Portuguese. exports went through a pe-. riod of high growth until around 1967when they levelled off at lower rates of increase, Since the early seventies they account for a major share of GDP altogether compar-. 5%) and to a lesser extent the services sector. The slow growth in agricultural productivity must , as in the case of Spain , have further increased the difference between the low average level of productivity in this sector and that of the rest of the economy: this has led. to increased under-employtnent in. able to the share accounted for by German or United Kingdom exports , and in any. Portuguese agriculture.. materials and semi- finished products (38, of the total) and manufactured goods such as. Lastly, a feature of the. Portuguese economy. since 1960 has been the h~gh. proportion of. wage and salary earners in the total labour force; this proportion is steadily increasing. since it averaged close on 74% of the employed labour force over the period 1962and over 76% from 1971 to 1975 (Table 9). Portugal is consequently the only applicant Community in this respect. Compared with Spain for exam-. country on a par with the. ple , Portugal has a higher proportion of wage and salary earners in all sectors of activity (including agriculture).. event considerably. higher than. Greek or Spanish exports.. that for. Since 1965 the structure of Portuguese ex-. ports has changed considerably. In 1965 Portugal exported mainly food products , raw. textiles, leather etc. (over 42% of the total):. categories were down to 29 % and 34 % of the total. On the other hand , the share of machinery, transport in 1975 these two. equipment and similar manufactures increased from II % in 1965 to close on 30% in 1975. Overall , manufactures accounted .for. % of all Portuguese exports in 1975 as against approximately 62% in 1965. Lastly, since the mid-sixties , the OECD area. over 70. has become an even bigger purchaser of Por, it absorbed 80%. tuguese products: in 1975. of Portuguese sales abroad as against 65% in 1967. The Community, which absorbed 50% Capital formation. of Portuguese exports in 1975 occupied a. 36. Since 1960 investments have tended to. elasticity of Portuguese imports in relation to. increase more rapidly than GDP and until. growth has been considerably lower than in Spain or in Greece and closer to the Community average. Although the import elas-. special place in this trend, Since 1960 , the. 1973/74 represented one of the keys to Por-. tugal's growth. Despite this, the level of capital formation in GDP is relatively low. The. 6% at the. proportion (Table 4) has been 18. in Spain and most as against over 23. ticities (Table 6) calculated for 1970- 75. unduly low owing to Portugal' s. appear. economic. problems in 1974 and 1975, calculations for S. 3/78.
(19) 73 confirm this decreasing trend, though attenuating it (1.4 for 1968the period 1968-. as against 0, 7. for 1970- 75).. Balance of payments trends 38, From. 1965 to 1973 there was a substan-. tial surplus each year in Portugal's balance on current account. These surplus were due. to the fact that large flows of earning from. tourism and especially of remittances from Portuguese nationals working abroad amply offset the trade deficit. The current account surpluses were more than adequate to cover the capital movements balance, since Portugal tended to import long- term private capital and export long- term public capital. As a result of this trend Portugal increased its ex-. change reserves each year (for example by close on USD 1 000 million in all from 1969 to 197~), Since 1974 this. trend, which elicits. comments similar to those made in the case of Spain , has been completely reversed under the combined effect of the rise in oil prices and economic changes following the 1974 revolution.. icy guidelines for 1977 were amended , but it remains very uncertain whether the official forecasts will be met, According to - the OECD (December 1977), the general government deficit could approach 10% of GDP. The draft budget for 1978 , which is considerably more restrictive, forecast stagnation in p~blic consumption in real terms , but since capitel expenditure (including transfers and the purchase of shares in public corporations) should pick up once again , the borrowing requirement of the State is expected to be only. slightly reduced. Consequently. balance. on current account for the whole of the pu-. blic sector could show a slight surplus in 1978 , whereas the borrowing requirement would be 5% of GDP, As regards the structure of public revenue, out of total receipts. from taxes and social security contributions (25% of GDP in 1975), social security contributions accounted for 31.3% in 1975 (26% on average in 1970- 75).. Geographical location of growth 41, The. Portuguese economy is character-. ized by the concentration of the population. Prices. 39, Table 9 shows that. and secondary and tertiary activities in the in terms of the. GDP deflator , inflation in Portugal remained very moderate during the sixties (when. prices increased less slowly than in Germany, for example); moreover , on average over the period 1970- 75 the rise in the GDP deflator remained close to the performance of other countries , but the result conceals a very. marked deterioration. the. in the situation since. three most northerly coastal regions. In 1970. these three regions accounted for 37% of the surface of Portugal 80% of its population 90% of GDP and 95% of industrial producGDP in the area around tion. The. per capita. Lisbon was more than twice as high as that of the other two main regions and its population growth much more rapid.. 1974.. This situation is due to the fact. Public . finance. in particular) makes up about 55% of the to-. 40. A public finance deficit first appeared in. the high proportion of the labour force work-. nomic growth is mainly concentrated on Lisbon , which with its surrounding area (Setubal tal urban population. In the inland regions. 1974 and has since grown. The borrowing re-. quirement of the whole of the public sector was around 1.7% of GDP in 1974 and rose to around 9% of GDP in 1976, Because of the extent of the imbalance ,. S. 3/78. that eco-. the budget pol-. ing in agriculture , their relatively high average age and the low productivity of the ag-. ricultural sector suggest , that the depopulation process observed in the past will probably continue,.
(20) Principle structural changes in the. mark (for purposes of comparison , France repatriated a little more than 700 000 people af-. 1974. Portuguese economy since. ter the end of the Algerian war when its own 42, The changes made following the revolution of April 1974 can be grouped together. under three headings:. population was 46 million). Moreover , the sudden break in economic relations with the escudo area resulted in reduced trade and an appreciable drop in. private transfers to the. mother country, Extension of the public sector Extension of the. public sector has been. cau.sed by direct nationalization . (chemicals steel , shipbuilding, cement and oil-refineries),. public sector holdings resulting from the nationalization of banks and insurance companies , and large-scale agricultural' reform. 1976 ,. the total. public sector. , Le, the tradi-. tional public sector and the productive public sector accounted for 24.4 % of total valued. added and 45.4% of investment (in 1974 , the same figures in Italy were 26% and 30%, and in France , in 1975 , 17% and 19%), It. employed about 20% of wage. and salary. earners,. 43. These phenomena had. sions on the functioning. their repercus-. of the Portugese. economy, at a time when a major economic recession was spreading on the international level; moreover , since 1974 , Portugal' s eco-. nomic development The. disarray.. has been thrown. into. resulting situation is as follows:. capital formation and exports have been replaced by public and private consumption. as the driving force behind growth; there has been a marked slowdown in in-. vestment in plant . and machinery; unemployment has risen sharply, in the order of 450 000 to 500 000 unemployment. namely around 14 % of the labour force at. Changing the rules of the economic game. the end of 1976 and inflation has accelerated; there has been a progressive devaluation. First of all , the limits of the sectors and firms liable for nationalization were not defined until fairly late (end 1976) and this un-. of a. certainly weighed heavily pnactivity in the private economic sector (in particular as regards investment), Then ,. faced with. ments (USD 2800 million for 1974 , 1975 and 1976 together),. rising. unemployment (resulting from the international recession and repatriations following decolonization), the authorities virtually pro-. hibited dismissals while simultaneously setting up a policy of saving firms in difficulty. by means of loans.. of the escudo since 1974 and the appearance deficit in the current balance of pay-. Lastly, in addition to. fundamental in the structure of financing,. a. Structure of Industry. the Sixties and early Seventies a series of factors such as relatively low wages and interest rates , aids in the form of tax advantages , tariff protection and a system of li44. During. cences governing access to industry led to. trols set up,. high levels of investment and growth, From 1971 to 1975 , GDP was made up as follows by sector of activity.. Problems of decolonization. The growth rate of production. subsidy policy was developed and price con-. The economic consequences of decoloniza-. tion are considerable: for example, from. April 1974 to mid- 1976 , around 500000 Portuguese were repatriated at a time when the total population was around the 9 million. in manufac-. turing industry fell from an annual average of 10% during the period 1963- 1973 to 2% in 1974. In 1975 , it declined by 5%. The recovery which began towards the end of 1975. seems to have continued at a steady rate up to the middle of 1977.. S. 3/78.
(21) Agriculture, forestry and fishing Mining Manufacturing industries Electricity, gas and water Building and construction GDP. Real growth rates for the main sectors have been as follows:. 1971. 1972. 1973. 1974. 1975. 13,. 12.. 12.. 11.6. 11.8. 37.. 0.5 38. 3.4. 39.4. 39.. 37.. 100. 100. 100. 100. 100. 3.3. The growth of the foodstuffs industries is linked to the rapid rise in the resident population after 1974; another sector with very. was printing and publishing. The decline in the textile industries was caused by the sharp fall in external demand in 1975, In the first .half of 1976, there was a significant recovery in chemicals rapid growth in 1974- 75. 1968- 1973. 1974. 1975. 13.1. 27.. Foodstuffs, beverages, tobacco. base metals ,. non-metallic minerals and textiles, By contrast , the level of activity in industries producing capital goods remained. Textile products and food-. 17.. 11.6. wear. low,. Wood products and furni-. 1.0. ture. Paper, printing and publishing Chemical produits Non-metal minerals Base metals Metal products, machinery, electrical goods, transport equipment Miscellaneous. In 1973 , the share of these. 29. 10. 10.. 1.9 13.1. 11.9. ~ 18.. value added was as follows: Foodstuffs , beverages, tobacco Non-metal mineral products. 10.. Metal products, machinery and 12.. 1.0 16.. 12.. 21.3. Total manufacturing industry Source:. sectors in total. 31.0 transport equipment 21.4 footwear Textiles , garments and Wood and wood products Chemical products and allied products 11.2 4.2 Base metal industries 5.3 Miscellaneous. IBRO, study on Portugal. March 1977.. Community of Nine. Total SITC. section. 162.. 137.. 11.0. 57. 67. 144.5. 125.. 664. 256. 312.. 6.4 34. 13. 16.1. 47.4 357. 142. 145.. S. 3/78. 1939.. 37. 53. 55. 46. 15.. 14.. 0-9. 35. 49.3 67. 16. 18.. 11.5. 100.. 937.. Countries outside Countries outside Community Community of Twelve of Nine. 50.. 89.. 54. 50.. 105.4 69. 69. 33.. 64. 50. 32. 83. 81.7. 78.\. 62. 46. 44. 53.4 34.. 64.4 291.4 106. 164. 12.. 27.5 79. 73.0 51.3 43. 41.7 52. 84.. 49.. 897.. 46.. 307. 113. 167.1. 12.3. 965.. 69. 59. 31.5. Japan. Canada. USA. mio USD. mio USD. mio USD. mio USO. mio USD. mio USO. mio. uso. 214. 39.. 100. 1.9. 13.. 23.9. 1.1. 17.. 2.4. 0.4 2.3 58.. 7.1. 1.0. 4.3. 1.3. 1.0. 19. 14.. 139.. 4.5 3.4. 24.. 1.2. 18.3. 0.3.
(22) , .. Export of manufactured products. 45, Exports of manufactured products (average 1974- 75). account for 65. 8% of all ex-. ber of ' problem ' nity;. industries in the. (v) very marked. orientation of. Commuexternal. towards the Community, amounting to. trade. ported goods and 10.5% of GDP. The preceding table shows the destination of ex-. about 50. ports , broken down according to the. nine categories of the SITC.. (vi) the three. % for both sales markets and sup-. plies; source of la~. countries are a. for the Community (as are Yugoslavia Turkey and the North African countries). During the period of high economic growth up to 1973, these links created a sort of de bour. The share of the Community of Nine , which was 50, 2% in 1975 , is highest in non-edible. raw materials, excluding fuels ,. machinery. and transport equipment and certain manufactured products. Portugal , which in 1975. had a USD 570 million deficit in trade with the Community, showed a surplus in food products and livestock , nonedible raw materials , excluding fuels , and certain manufactured products,. ment in' Spain , Greece and Portugal and their. present economic situation shows a number of points in common which would appear , at first sight , to make these three countries . homogeneous group,. The main points in. common. are as follows:. a level of development. which is very considerably lower than the Community average;. (ii) large-scale. and growing. regional disequi-. leading to the concentration of popu-. lation and growth in a few regions and depopulation in others;. (iii) the agriculture, in terms of both production and employconsiderable weight of. ment. The relative importance of agriculture , however , diminishing fairly rapidly, in line. with the growth pattern observed in the past in other industrialized countries; nonetheless productivity is still very low in agriculture, and none of the countries (except Greece) is agriculturally self-sufficient; (iv) broadly production. bour shortage from labour. surpluses in the. applicant countries. Since the emergence of high and continuing levels of unemployment in the Community, this interdependence has. lateral dependence of the three applicant countries on the Community, particularly France and Germany, There are two aspects. 46, A brief survey of economic develop-. libria,. plicant countries and the Community, with the Community being able to make up its la-. gradually changed into a relationship of uni-. Summary. (i). facto interdependence between the three ap-. similar structure in. industrial. and particularly industrial exports);. the three countries are competitors in a num-. to this relationship of dependence: the emi-. gration of large numbers of workers has reduced pressure on labour markets in Spain Greece and Portugal; at the same time. transfers of earning by the emigrant workers. have provided very .substantial resources which help to offset imports into Spain Greece and Portugal;. (vii) a high. level of. investment. since the. Sixties and a sharp decline more recently; it should also be mentio.ned. middle of the. in this connection that savings patterns in the three countries have been relatively similar; (viii) considerable underemployment prob-. mainly for structural reasons; (ix) foodstuffs are still a major item in the structure of private consumption; lems,. (x). lack of infrastructure. and a relatively low GDP.. share of public expenditure in. All these aspects are characteristics of a stage of development lying mid-way between the developing countries and the industrialized countries,. 47. Despite mon ,. this. it cannot. series of points in com-. be said that Spain , Greece. S. 3/78.
(23) and Portugal are similar countries from an economic point of. view. On the contrary,. marked. which have developed. divergences. over the last fifteen years or quite recently show clearly that each of the countries, especially Portugal , must be looked at separately, Firstly,. Spain. has a large market (35 million. inhabitants) with high growth and is a major competitor , at least in some .sectors. For. these main reasons, the Spanish economy seems, more than the other two applicant countries , to have high growth potential. In Greece,. earnings from tourism and shipping. and the need to speed. up industrialization are factors likely to promote a high mediumterm growth rate, provided that balance of. payments problems are overcome, These two. countries seem to have reached. higher level of GDP in real terms than is generally imagined, In relation to the Community, a. their GDP is lower than but close to those of Ireland and Italy (Table 10), Portu-. Table 13 also shows how much lower. comes in terms of GDP: the per capita GDP calculated for this country is 60% of GDP in Ireland, which is the least prosper-. gal. ous of the Community countries. to this leeway,. In addition. Portugal has been facing very. serious economic difficulties since 1974. The large-scale decolonization process has been accompanied by very far-reaching changes in. the structure. of the Portugese economy.. These factors , coming on top of a slowdown in world economic growth ,. have resulted in. massive external payments deficits very difficult financing. posing. problems.. common features of the three applicant countries (very low level of develop-. 48, The. ment , importance of agriculture , inability to create sufficient jobs and resulting labour flows , regional imbalances and concentration. of industry on sectors already in difficulty the present. in. Community), increase the prob-. lems which the new Community of Twelve will face in restoring growth and improving. cohesion.. S. 3/78.
(24) : \ j.. Part Two. Economic problems connected enlargement. tries, the applicant countries have the advantage of modern, competitive production units capable of withstanding international competition and thus exploiting the benefits deriving from lower wage and salary costs.. General problems. 50. The favourable overall. with. growth must be qualified by considerations. Growth and level of development 49, From the viewpoint of enlargement , the. growth capacity. assessment. which may be made of the applicant cou~~ tries from the viewpoint of their economIC. of the applicant countries. outlined in the above analysis of past trends is a positive factor. It provides, grounds for. hoping that , by the time of full accession there will be a further reduction of disparities in relation to the present Community as regards living standards , levels of productivity and production and employment structures, However , it must be borne in mind that. many obstacles will have to be. relating to their level of development. 1975 , per capita GDP in Spain and Greece. was still about one third below the Community average, while that of Portugal ~as, even lower well under half the Community s per cap it; GDP. If one assumes that the~e ,diffe~ences in productivity are broadly similar . it will be easier to measure the progress which will have to be achieved for these countries to be effectively integrated in the Community as a whole.. both by the applicant countries and the. overcome. The differences in levels of development are not only reflected in differences of GDP per. Community before the growth rate observed before the crisis can be restored, For the ap-. head of population or per person employed. They are also reflected in the various coun-. plicant countries in particular ,. tries ' economic and. their degrees of social protection ,. their capac-. macroeconomic variables and thus steady. ity for industrial adaptation the. seriousness. the social and political context makes control of the major. growth difficult.. The economies. of the applicant countries. have achieved rapid growth of productivity (about 7% for Spain and Greece and 5, for Portugal over the period 1960- 1975).. This. overall performance has been obtained. not. only through substantial transfers of the labour force from low productivity sectors to other sectors with higher productivity (from. social infrastructures. of regional disparities, and the level and scale of public services , particularly as regards education and vocational training. These are structural factors which could cause obstacles. or strains. in the. development process, It. must therefore be ensured that there. is a as. close liaison between efforts to achieve high an. overall growth rate as possible and. back-up measures to improve economic and. agriculture to industry), but also through the growth of the industrial sector itself. On the whole , industry has achieved the most rapid growth of productivity, exceeding that of ag-. social structures,. riculture in. 51. Despite the high rate of growth " une. most cases, High productivity. potential has been obtained. indlhtry through the rapid growth of productivc illvestment , which has made it possible to carry out substantial structural changes and to in. achieve, on the whole , steady growth \)f he. Employment, unemployment and emigration. ployment , underemloyment and emigration have posed a long-standing problem f?r the three applicant countries. Over the period as a whole total employment declined in. relative share of exports in world tradt:.. continuous and rapid growth of the capit;J stock has meant that , in a number of indus-. I GDP. per person employed.. Corrected to take account of purchasing powers.. S. 3/78.
(25) Greece and Portugal. Spain , by contrast , has achieved a steady rise in its employed working population , though this rise has proved insufficient in view of the labour potential. available. Several factors call for rapid growth in these three countries, The marked accu-. . by Spain Greece and Portugal has resulted in an increase in the potential growth of their productivity, Rationalization investment has. change improvements in employment prospects and public services.. Utilization of resources. mulation of capital achieved. continued even during recent years , a factor. which has no doubt helped to maintain this. tendency. Consequently, if employment is to be increased , rapid growth of production is necessary, This applies particularly to industry.. 53. The need to achieve rapid growth is even more marked in the three applicant countries than in the present Community, They face broadly the same needs as most of the Western countries , but have ~o deal with additional specific " growth requirements , As. in the case of the. Community countries. Greece, Spain and Portugal must offset ,. in. , the deterioration in their terms of trade caused by the rise in oil prices , and endeavour to reduce their oil deficit. This repart at least. 52. Emigration has traditionally been a means of relieving unemployment problems. in these countries, but it has also created a. substantial flow of income transfers and has sometimes provided vocational training expe-. quires both investment to curb energy con-. sumption , the development of whatever sources of energy they have themselves , and. an increase. in the. from the three countries has been mainly. In addition ,. spontaneous trends in agricultu-. concentrated on the Community. The em-. ral trade could well result in a large agricul~. volume of their exports,. rience for the emigrant workers, Emigration. ployment situation in the Co;l1munity makes it improbable in the medium term that there. will be a return to emigration flows on a pre~ crisis scale, However , account must be taken of the fact that marked emigration potential exists in the applicant countries , stimulated. by. significant wage and salary differentials. and by differences. in the level of social ser-. vices. Problems could arise if, despite the de-. economic conditions in the Community, the above factors induced firms in the Community to recruit labour from terioration of. these countries. In the longer term , following. full accession and , in particular , as a result of. freedom of movement for workers ,. tural deficit for the applicant. countries. In. too , large-scale investment is therefore necessary. The need to increase exports does indeed go beyond the immediate objecthis area ,. tive of restoring equilibrium in the external. balance. The growth and sectoral. change. achieved in the applicant countries in the. post-war period was largely obtained through. steadily increasing involvement in world trade. This trend must be continued. Two conditions would appear to be essential. namely an improvement in the international context and the continued growth of their share in world markets. The importance of a. emigra-. renewal in growth in the western world and. tion flows will be mainly ' dependent on comparative growth rates between the applicant countries and the present Community, A relatively satisfactory development of the employment situation is also necessary in the. dent: the Community accounts for 45 to 50% of the total exports of the three applicant countries. Bearing in mind the indirect. applicant countries in that the process of rec-. tifying internal and external disequilibria will mean that the growth of incomes will have. to be compatible. with macro-economic re-. quirements. This will be easier to achieve if wage and salary earners can be offered in exS. 3/78. in particular in the Community is clearly evi-. effects of an aceleration in economic growth in the Community, it is evident that the three applicant countries will not be able to restore a satisfactory growth rate and balance of payments situation , unless the Community itself can reestablish a more sustained rate of growth..
(26) 54, The three applicant countries have also to solve serious problems involving structural change , which will be dealt with in the fol-. lowing section. To a large extent , solving these problems will require considerable inregard to industrial development. imprpving economic and social infrastructures or regional development. vestment whether with. Devoting greater resources to both investment even if some of it comes from abroad,. and to exports. maintain unless. will be a there is. difficult path to rapid growth, If. growth is not rapid , the growth in the level of consumption would be severely limited,. which would create socia" strains harmful to the continuity of. economic policy,. Structural changes. munity of twelve as regards commercial policy with non- Community countries, The steel industry provides an obvious example. here, The problems. involved in this. sector. are particularly significant insofar as private. investment flows towards. the applicant. countries would be encouraged more so , .since the Community s. and, even specialized. financial instruments (EIB , Regional Fund) will be applicable. For these reasons an overall view of sectoral developments is necessary in order to identify the main dangers of incompatibility. 57. The. industrial question is also relevant. with regard to the options to be made on the agricultural front. These two aspects are dealt with in greater detail in the following sections. Agriculture will probably demand the most far-reaching structural change in the three applicant countries,. 55. Despite their development during the last 20 years , the industrial capacity of the three countries applying for accession is, on. the whole , weak , though to differing tlegrees,. Whether it is a question of further enhancing their export performance , withstanding. the gradual dismantlement of customs barri-. ers during the transition. period or creating. sufficient jobs, if only to cope with the rural exodus which will inevitably occur , it will be largely up to industry to provide the neces-. sary support.. However. diversifying and. strengthening industrial potential. in a context of mediocre growth , both domestically. and externally, is a difficult enterprise, It will require sustained demand , which will str~ngthen confidence of investors and free the re-. sources necessary. for the. development of. production capacity,. Employment in agriculture is still very high although diminishing rapidly. Even more striking is the fact that productivity in this. sector has deteriorated in relation to the rest of the economy since productivity in agriculture has grown less rapidly than in the other. major sectors of production. The rapid rise of agricultural productivity will therefore imply an even larger rural exodus in the long term. Factors such as the age structure of the pop-. ulation ,. large-scale irrigation requirements. and the capital stock of farms aspects in achieving this. will be key. progress,. Accession presents these countries and the. Community with a crucial choice as to the future of their agriculture. The development and structure of their agricultural production and their balance of trade with . other countries will be mal kedly influenced by the. 56. From the point of view of enlargement the industrial development of the countries concerned raises questions of compatibility at Community level. Even assuming there is a recovery in growth , the sectoral options. made by these countries will probably raise two types of problem: firstly, the threat they pose to some industries in the existing memnew confuture Comstraints they will place on the ber countries , and , secondly the. pol~. icies on prices adopted. both as regards the products in which they enjoy a comparative. advantage (citrus fruit , olive-oil , tobacco and. early vegetables) and those which they. do. not produce in sufficient quantity (meat , butter , milk and cereals). In addition to the effects of the policy on prices , account will also have to be taken of the agricultural trade arrangements with countries lying outside the Community. The choices made at Commu-. S. 3/78.
Figure


+3


Documento similar
The areas studied through this database are how many heartbeats are needed to identify a user; the costs of convergence of the presented model; the classification of a non-seen user
Before the chemometric techniques were used to typ- ify the ciders on the basis of the fermentation technol- ogy employed in their manufacture and according to their content in
The Dwellers in the Garden of Allah 109... The Dwellers in the Garden of Allah
The goal of this study was assisting the learners in the writing class to enhance their metacognitive awareness and consider its impact on the writing skill and intrinsic motivation
In order to explore the role of dual mycorrhization and urea fertilization on Fraxinus plants survival and growth in poor substrates, and also to contribute information on
The aim of this study is to determine the pre-service physics teachers' views on the effect of designing and developing physics digital stories (DST) on improving their 21st
problems with solutions extracted from past experience, through the development of products based on their experience and by improving their efficiency in the existing
We relate changes in the structure and levels for tobacco taxes, which are published in the Boletín Oficial del Estado[12], to shifts in the distribution of cigarette prices
