Two groups of red giants with distinct chemical abundances in the bulge
globular cluster NGC 6553 through the eyes of APOGEE
Baitian Tang,
1‹Roger E. Cohen,
1Doug Geisler,
1Ricardo P. Schiavon,
2Steven R. Majewski,
3Sandro Villanova,
1Ricardo Carrera,
4Olga Zamora,
4D. A. Garcia-Hernandez,
4Matthew Shetrone,
5Peter Frinchaboy,
6Andres Meza,
7J. G. Fern´andez-Trincado,
8Ricardo R. Mu˜noz,
9Chien-Cheng Lin,
10Richard R. Lane,
11Christian Nitschelm,
12Kaike Pan,
13Dmitry Bizyaev,
13,14Daniel Oravetz
13and Audrey Simmons
13Affiliations are listed at the end of the paper
Accepted 2016 October 20. Received 2016 October 6; in original form 2016 September 2
A B S T R A C T
Multiple populations revealed in globular clusters (GCs) are important windows to the forma-tion and evoluforma-tion of these stellar systems. The metal-rich GCs in the Galactic bulge are an indispensable part of this picture, but the high optical extinction in this region has prevented extensive research. In this work, we use the high-resolution near-infrared (NIR) spectroscopic data from Apache Point Observatory Galactic Evolution Experiment (APOGEE) to study the chemical abundances of NGC 6553, which is one of the most metal-rich bulge GCs. We iden-tify 10 red giants as cluster members using their positions, radial velocities, iron abundances, and NIR photometry. Our sample stars show a mean radial velocity of−0.14±5.47 km s−1, and a mean [Fe/H] of−0.15±0.05. We clearly separate two populations of stars in C and N in this GC for the first time. NGC 6553 is the most metal-rich GC where the multiple stellar population phenomenon is found until now. Substantial chemical variations are also found in Na, O, and Al. However, the two populations show similar Si, Ca, and iron-peak element abundances. Therefore, we infer that the CNO, NeNa, and MgAl cycles have been activated, but the MgAl cycle is too weak to show its effect on Mg. Type Ia and Type II supernovae do not seem to have significantly polluted the second generation stars. Comparing with other GC studies, NGC 6553 shows similar chemical variations as other relatively metal-rich GCs. We also confront current GC formation theories with our results, and suggest possible avenues for improvement in the models.
Key words: stars: abundances – stars: evolution – Galaxy: bulge – globular clusters: individ-ual: NGC 6553.
1 I N T R O D U C T I O N
The longstanding notion that Galactic globular clusters (GCs) are quintessential simple stellar populations is now challenged by the discoveries of multiple populations (MPs) in an increasing number of GCs. The MP phenomenon has now been seen in main-sequence (MS), subgiant branch, red giant branch (RGB), horizontal branch, and asymptotic giant branch (AGB) stars (M´esz´aros et al.2015; Garc´ıa-Hern´andez et al.2015; Gratton, Carretta & Bragaglia2012, and references therein). Among these stellar phases, giant stars
E-mail:[email protected]
are more luminous and thus more accessible for detailed stud-ies. Colour–magnitude diagrams (CMDs) show prominent multiple RGBs in the clusterωCen when viewed in a number of different filters (e.g. Lee et al.1999; Pancino et al.2000). In particular, ul-traviolet (UV) filters are the best at revealing MPs, since the UV includes a number of strong molecular bands containing especially C and N, which are prime elements affected by MPs. The first clus-ter abundance anomalies were reported in Osborn (1971), where two stars in M5 and M10 showed high N abundances in their DDO photometry. The Str¨omgrenc1 index and the Washington C
54 GCs through theF275W,F336W,F438Wfilters of the Wide Field Camera 3 on boardHSTand found MPs in their entire sample with a bewildering array of detailed behaviour. The first paper of that survey successfully separates at least five different populations along the MS and the RGB of the cluster NGC 2808 (Milone et al.
2015).
While photometry is a time efficient way of revealing MPs, high-resolution spectroscopy allows deeper insight into GC formation and internal stellar evolution by providing detailed elemental abun-dances for a number of elements with a variety of nucleosynthetic origins. N–C, Na–O, Al–Mg anticorrelations, and somewhat less frequently Si–Al correlations have been observed and discussed in numerous works: for example, Gratton, Sneden & Carretta (2004), Carretta et al. (2009a,b, 2010, 2014, 2015),Villanova & Geisler (2011), and Gratton et al. (2011,2015). These correlations are sig-natures of specific nuclear cycles. In particular, the CNO, NeNa, and MgAl modes of hydrogen burning are suggested to be respon-sible for the observed correlations (e.g. Arnould, Goriely & Jorissen
1999; Carretta et al.2009a; Ventura et al.2013). Several possible as-trophysical sites for the stars of the first generation (FG), which pol-lute the environment leading to a distinct second generation (SG), have been proposed, e.g. AGB stars (Ventura, Carini & D’Antona
2011; Ventura et al.2013), fast rotating massive stars (Decressin, Charbonnel & Meynet2007), massive binaries (de Mink et al.2009), and supermassive stars (Denissenkov & Hartwick2014).
The Galactic bulge (GB) is one of the most massive and likely the oldest components of the Milky Way and its stars are direct links to the pristine formation mechanisms of the early Galaxy (Schultheis et al.2015; Howes et al.2016). However, despite its proximity and central role as a primordial component of the Galaxy, the GB has resisted thorough investigation due to high foreground extinction, which strongly limits optical observations. Until recently, detailed spectroscopic studies with multi-object spectrographs have been mainly explored in a few low extinction windows, e.g. Baade’s win-dow and Plaut’s field (Zoccali et al.2008; Hill et al.2011; Johnson et al.2011; Ness et al.2013). Viewed through these windows, the GB field stars display more than one peak in their metallicity distri-bution function (Babusiaux et al.2010; Ness et al.2013). However, observing in the near-infrared (NIR) helps to minimize the generally strong extinction and opens the entire bulge for study. Therefore, an NIR high-resolution multi-object spectrograph, such as that used by the Apache Point Observatory Galactic Evolution Experiment (APOGEE; Majewski et al.2015), provides new opportunities to push forward our knowledge about the chemical evolution of the bulge (e.g. Schiavon et al.2016).
GB GCs provide important insight into galaxy formation as well as its subsequent dynamical and chemical evolution (Mauro et al.
2012; Bica, Ortolani & Barbuy2016; Cohen et al. 2016). NGC 6553 (αJ2000=18h09m17s.6,δJ2000= −25◦5431,l=5◦.25, andb=
−3◦.03) is one of the most metal-rich bulge GCs, and has Galactic coordinates in a Sun-centred system ofX= +5.9 kpc,Y= +0.5 kpc, andZ= −0.3 kpc.1Therefore, NGC 6553 is at the near edge of
the bulge and, accounting for a reddeningE(B−V) of 0.63, has a luminosity (MV) of−7.77 (Harris1996). IfMVis used as a rough
proxy of GC mass, NGC 6553 is an intermediate-mass example in the bulge GC mass distribution. Note that we see a spread in the current values of Galactic coordinates, reddening, and luminosities from Guarnieri et al. (1998), Harris (1996), and Valenti, Ferraro &
1http://physwww.physics.mcmaster.ca/∼harris/mwgc.dat
Origlia (2010),2so these values may not be known to better than
∼10–20 per cent. In terms of GC metallicity, Alves-Brito et al. (2006) noticed a significant range in literature values,−0.55< [Fe/H]<−0.06 (a complete list of literature results can be found in the next section). Johnson et al. (2014) measured the Na, Mg, Al, Si, Ca, Cr, Fe, Co, Ni, and Cu abundances in 12 cluster members, and found that the chemical pattern of NGC 6553 agrees with other bulge field stars, except for larger Na scatter. They suggested that this scatter may be caused by additional self-enrichment.
Thanks to the lower extinction and more available CNO molec-ular lines in the APOGEE survey, we recently found substantial chemical variations in several bulge GCs, e.g. NGC 6553, NGC 6528, and Terzan 5 (Schiavon et al.2016). In this paper, we present a more detailed analysis of the chemical pattern observed in the gi-ant stars of NGC 6553 (Section 2). We clearly separate two groups of stars in C and N (Section 3). We investigate the APOGEE chem-ical abundances, and supplement it with two recent high-resolution spectroscopic studies (Section 4). We compare our results to the general picture outlined by literature GC studies, and discuss the possibility of applying AGB polluting models to explain the chem-ical pattern in NGC 6553 (Section 5). Finally, a brief summary of the results and a look to the future are given in Section 6.
2 S A M P L E S E L E C T I O N A N D DATA R E D U C T I O N
APOGEE (Majewski et al.2015) was one of the programs operating during the Sloan Digital Sky Survey III (SDSS-III; Eisenstein et al.
2011). The multi-object NIR fibre spectrograph on the 2.5-m tele-scope at Apache Point Observatory (Gunn et al.2006) delivers high-resolution (R∼22 500)H-band spectra (λ=1.51–1.69µm), and the APOGEE survey targeted a colour-selected sample, which pre-dominately consists of good stars across the Milky Way. APOGEE data reduction software is applied to reduce multiple 3D raw data cubes into calibrated, well-sampled, combined 1D spectra (Nidever et al.2015). In addition, the APOGEE Stellar Parameter and Chem-ical Abundances Pipeline (ASPCAP; Garc´ıa P´erez et al.2016) de-rives stellar parameters and elemental abundances by comparing observed spectra to libraries of theoretical spectra (Shetrone et al.
2015; Zamora et al.2015) to find the closest model match, using
χ2minimization in a multidimensional parameter space. Through
SDSS Data Release 12 (DR12), up to 15 chemical elements were identified, and measured abundances provided. The calibrations of stellar parameters and abundances from the pipeline were described in Holtzman et al. (2015). They compared the APOGEE abundances with those from other high-resolution spectroscopic studies, and suggested that the internal scatter of the calibrated abundances is generally between 0.05 and 0.09 dex, while the external accuracy may be good to 0.1–0.2 dex. A new DR (SDSS DR13) is now pub-licly available (Holtzman et al. in preparation; SDSS Collaboration et al.2016). DR13 is a rerelease of all APOGEE-1 data between 2011 May and 2014 July, where pipeline and calibration improve-ments made since DR12 are integrated, and more element species are identified, i.e. CI, TiII, P, Cr, Co, Cu, Ge, and Rb. Therefore, we decided to use the results from DR13. Note that all the element abun-dances are derived under local thermodynamic equilibrium (LTE) assumption. Non-LTE effects for the NIR lines are poorly known but currently being investigated (e.g. Bergemann et al.2013,2015).
To gain as much information on cluster membership as possi-ble, our spectroscopic targets were positionally matched to NIR point spread function (PSF) photometry based on imaging from the VISTA Variables in the Via Lactea (VVV) survey (Minniti et al.
2010). The resultingJHKSphotometric catalogues have
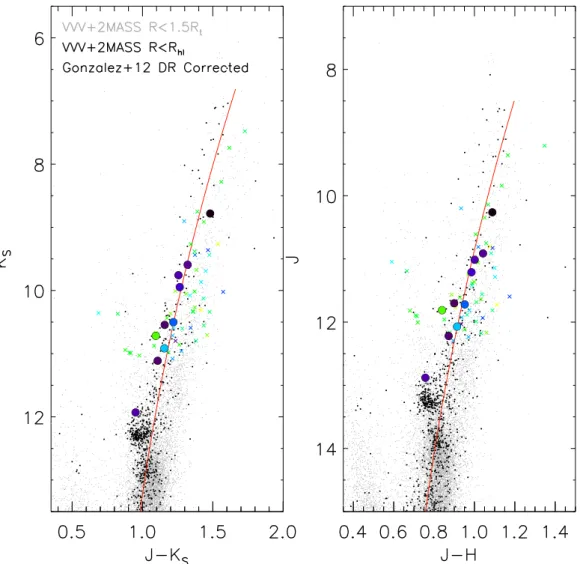
photomet-ric zero-point uncertainties and an astrometphotomet-ric rms of∼0.02 mag and 0.2 arcsec, respectively, with respect to the Two Micron All Sky Survey Point Source Catalog (2MASS PSC; Skrutskie et al.2006). Examples and details regarding 2MASS-calibrated PSF photome-try of preprocessed VVV imaging are presented elsewhere (Chen´e et al.2012; Mauro et al.2012,2013; Cohen et al.2014). In addi-tion, the VVV PSF catalogues have been merged with bright stars from the 2MASS PSC which are saturated in the VVV images. The NIR photometric properties and CMD of NGC 6553 are discussed in detail in Cohen et al. (2016). In addition to employing the raw 2MASS-calibrated NIR CMDs, we have also employed the redden-ing map of Gonzalez et al. (2012) to correct the spatially variable reddening, but we apply this map in a differential sense relative to the value ofE(J−KS), which they report at the centre of NGC 6553.
Although reddening maps are available at higher spatial resolution close to the cluster centre (Alonso-Garc´ıa et al.2012), these maps rely on the use of cluster members, and therefore do not extend over the full tidal radius of the cluster.
We select candidate cluster members by leveraging together all of the information at hand, including positions, radial velocities, and abundances from APOGEE, and the aforementioned PSF photom-etry. We begin by considering only stars within 1.5 times the cluster tidal radius (Rt) from the Harris (1996) catalogue. We include stars
slightly beyondRtbecause the tidal radius resulting from King
pro-file fits, especially when relying on optical integrated light propro-files, is not always well constrained (e.g. McLaughlin & van der Marel
2005; Cohen et al.2014). Extratidal stars identified via abundances consistent with their host clusters have been identified spectroscop-ically in some cases (e.g. Kunder et al.2014). Although this topic is beyond the scope of the present investigation, there were no stars in our sample falling slightly outside our radial cut which had photom-etry, velocities, and metallicities clearly indicative of membership in NGC 6553. In Fig.1, we plot the spatial location of all stars in the sample (within the 7 deg2APOGEE field), colour-coded by radius
from the centre of NGC 6553, with stars havingR>1.5Rtshown in
grey. Stars which we consider to be members are plotted in Fig.1
as filled circles, and non-members are shown using small crosses; the large circle indicates the cluster tidal radius. Fig.2shows the same stars in the plane of [Fe/H] versus radial velocity, both derived from APOGEE, and we see a clear concentration of stars which are spatially close to the centre of NGC 6553 and having properties in excellent agreement with literature values for the cluster [Fe/H] and radial velocity (see the last paragraph of this section for a com-plete list of literature results). At this point, we have a preliminary cluster candidate list which is quite conservative, with all excluded stars having radial velocities differing from the cluster mean by
>50 km s−1(compared to typical GC central velocity dispersions
of<20 km s−1; Harris1996; McLaughlin & van der Marel2005;
Watkins et al.2015), or [Fe/H] differing from the cluster mean by
>0.2 dex (compared to the<0.1 dex relative precision of APOGEE abundances; see Table1), or in most cases, both. As a final check on cluster membership, we compare the locations of candidate mem-bers in the differential reddening-corrected NIR CMDs against the expected locus of NGC 6553 in Fig.3. There, we plot stars inside the cluster half-light radius in black and those within 1.5Rtin grey
to highlight the relative locations of the cluster and field (e.g. GB and disc) in the CMD. In addition, an empirical cluster RGB fiducial
Figure 1. Locations of the stars in the 7 deg2APOGEE field of NGC 6553. The solid circle indicates cluster tidal radius (Rt). Non-members outside 1.5Rt are the grey crosses. Stars inside 1.5Rtare colour-coded, according to the colour bar shown in Fig.2. Cluster members and non-members are labelled by filled circles and crosses, respectively.
Figure 2. [Fe/H] versus radial velocity. Symbol meanings are the same as in Fig.1.
sequence constructed from statistically decontaminated photometry (Cohen et al.2016) is shown as a red line. Given the differential reddening towards this cluster, as well as the formal uncertainties of the Gonzalez et al. (2012) differential reddening corrections, we do not make rigorous CMD cuts, but rather simply exclude all candi-date members passing the aforementioned spatial, metallicity, and velocity cuts which have CMD locations highly discrepant with the locus of the NGC 6553 RGB. Specifically, four candidates were considered non-members because they have (J−KS) colours more
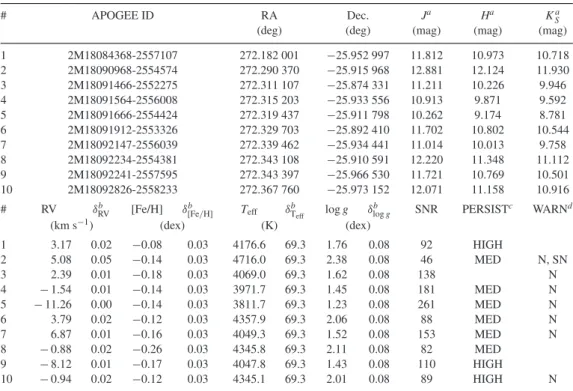
Table 1. Basic parameters for cluster members of NGC 6553.
# APOGEE ID RA Dec. Ja Ha Ka
S
(deg) (deg) (mag) (mag) (mag)
1 2M18084368-2557107 272.182 001 −25.952 997 11.812 10.973 10.718
2 2M18090968-2554574 272.290 370 −25.915 968 12.881 12.124 11.930
3 2M18091466-2552275 272.311 107 −25.874 331 11.211 10.226 9.946
4 2M18091564-2556008 272.315 203 −25.933 556 10.913 9.871 9.592
5 2M18091666-2554424 272.319 437 −25.911 798 10.262 9.174 8.781
6 2M18091912-2553326 272.329 703 −25.892 410 11.702 10.802 10.544
7 2M18092147-2556039 272.339 462 −25.934 441 11.014 10.013 9.758
8 2M18092234-2554381 272.343 108 −25.910 591 12.220 11.348 11.112
9 2M18092241-2557595 272.343 397 −25.966 530 11.721 10.769 10.501
10 2M18092826-2558233 272.367 760 −25.973 152 12.071 11.158 10.916
# RV δbRV [Fe/H] δ[Feb /H] Teff δbTeff logg δ
b
logg SNR PERSISTc WARNd
(km s−1) (dex) (K) (dex)
1 3.17 0.02 −0.08 0.03 4176.6 69.3 1.76 0.08 92 HIGH
2 5.08 0.05 −0.14 0.03 4716.0 69.3 2.38 0.08 46 MED N, SN
3 2.39 0.01 −0.18 0.03 4069.0 69.3 1.62 0.08 138 N
4 −1.54 0.01 −0.14 0.03 3971.7 69.3 1.45 0.08 181 MED N
5 −11.26 0.00 −0.14 0.03 3811.7 69.3 1.23 0.08 261 MED N
6 3.79 0.02 −0.12 0.03 4357.9 69.3 2.06 0.08 88 MED N
7 6.87 0.01 −0.16 0.03 4049.3 69.3 1.52 0.08 153 MED N
8 −0.88 0.02 −0.26 0.03 4345.8 69.3 2.11 0.08 82 MED
9 −8.12 0.01 −0.17 0.03 4047.8 69.3 1.43 0.08 110 HIGH
10 −0.94 0.02 −0.12 0.03 4345.1 69.3 2.01 0.08 89 HIGH N
Notes.aDifferential reddening corrected magnitude. bMeasurement error.
cPERSIST: spectrum has a significant number (>20 per cent) of pixels in the high (or medium) persistence region. dN_WARN: parameter value is within half grid spacing of the synthetic spectrum grid edge for nitrogen. SN_WARN: SNR<70.
with a radial velocity and CMD location consistent with cluster membership was excluded because it does not have reliable abun-dances from APOGEE. We note that two of the stars in the NGC 6553 sample selected by Schiavon et al. (2016) are excluded in this work due to their CMD locations.
From the coordinate information, these 10 cluster members have no overlap with the spectroscopic studies of NGC 6553 pub-lished after the year 2006, which include Alves-Brito et al. (2006), Zoccali et al. (2008), Gonzalez et al. (2011), Johnson et al. (2014), and Dias et al. (2015). Most of the APOGEE spectra for our sam-ple have signal-to-noise ratio (SNR) higher than 80, except the second star in Table 1. Each star in our sample has a single one hour visit, so the SNR is correlated with the stellar brightness. The SNR plays an important role in estimating the uncertainties of el-ement abundances (Majewski et al.2015). Three stars are labelled as ‘PERSIST_HIGH’ and six are labelled as ‘PERSIST_MED’. Persistence, where a significant fraction of accumulated charge is released over a long period of time, is particularly strong in one of the detectors (1.51–1.58 µm) used in the SDSS III/APOGEE survey (Nidever et al. 2015). However, by comparing the results from spectra containing persistence pixels versus those without, Holtzman et al. (2015) suggest that persistence does not dramati-cally impact the parameters in DR12 data.
From APOGEE measurements, our 10 cluster members show a mean RV of−0.14±5.473km s−1. Our mean RV agrees with the
other determinations: 4±7.1 km s−1(Cohen et al.1999), 1.6± 6 km s−1 (Mel´endez et al.2003),−1.86± 2.01 km s−1
(Alves-Brito et al. 2006),−2.03± 4.85 km s−1 (Johnson et al.2014),
3Standard deviation.
and 6± 8 km s−1(Dias et al.2015). In addition, the APOGEE
data yield a mean [Fe/H] of−0.15±0.05. This GC has diverse metallicity results from the literature:−0.55±0.2 (Barbuy et al.
1999),−0.16± 0.08 (Cohen et al. 1999),−0.7± 0.3 (Coelho et al.2001),−0.3±0.2 (Origlia, Rich & Castro2002),−0.2± 0.1 (Mel´endez et al.2003),−0.2±0.02 (Alves-Brito et al.2006), −0.11±0.07 (Johnson et al.2014), and−0.13±0.02 (Dias et al.
2015). We notice that as more high resolution and high S/N spectra have become available in recent years, the cluster metallicity is converging to between−0.1 and−0.2 dex, which agrees well with our result from APOGEE.
3 T W O P O P U L AT I O N S O F S TA R S W I T H D I S T I N C T C H E M I C A L A B U N DA N C E S
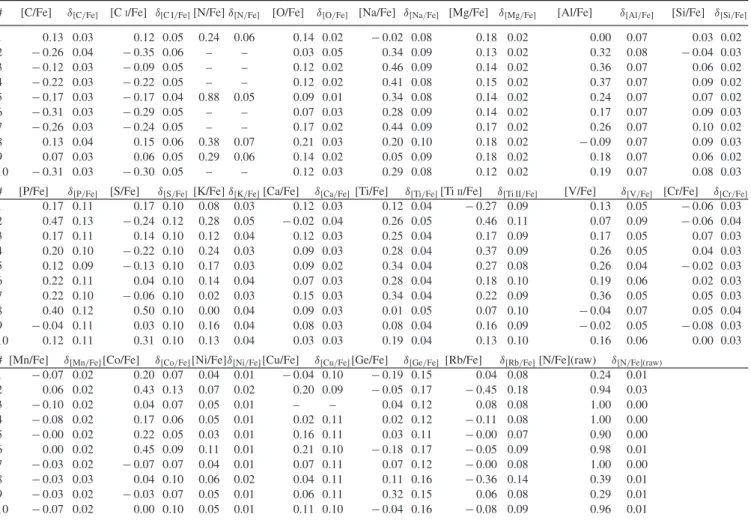
Fig.4shows the calibrated chemical abundances from ASPCAP as a function of atomic number for NGC 6553 stars (see Table2
for detailed information). In DR13, [C/Fe] is calculated using the molecular bands (mainly CO), and [CI/Fe] measures the C
abun-dance from atomic lines. In the case of Ti, [Ti/Fe] is based only on TiIlines, and [TiII/Fe] is from a single TiIIline.
Abundances of the light elements involved in proton capture processes (C, N, O, F, Na, Mg, Al, and Si) are known to vary in GCs, which is the main chemical evidence for MPs (Kraft1979,
Figure 3. Differential reddening-corrected CMD of NGC 6553 from PSF photometry of VVV imaging, supplemented with bright stars from 2MASS. The cluster fiducial sequence is indicated as a red solid line. The grey dots are stars within 1.5Rt(tidal radius), and the black dots are stars within the half-light radius. APOGEE targets inside 1.5Rtare colour-coded as in Fig.1. Cluster members and non-members determined in this paper are labelled by filled circles and crosses, respectively. See text for more details.
Table 2. DR13 calibrated abundances and errors for NGC 6553 cluster members.
# [C/Fe] δ[C/Fe] [CI/Fe] δ[C I/Fe][N/Fe]δ[N/Fe] [O/Fe] δ[O/Fe] [Na/Fe] δ[Na/Fe] [Mg/Fe] δ[Mg/Fe] [Al/Fe] δ[Al/Fe] [Si/Fe] δ[Si/Fe]
1 0.13 0.03 0.12 0.05 0.24 0.06 0.14 0.02 −0.02 0.08 0.18 0.02 0.00 0.07 0.03 0.02
2 −0.26 0.04 −0.35 0.06 – – 0.03 0.05 0.34 0.09 0.13 0.02 0.32 0.08 −0.04 0.03
3 −0.12 0.03 −0.09 0.05 – – 0.12 0.02 0.46 0.09 0.14 0.02 0.36 0.07 0.06 0.02
4 −0.22 0.03 −0.22 0.05 – – 0.12 0.02 0.41 0.08 0.15 0.02 0.37 0.07 0.09 0.02
5 −0.17 0.03 −0.17 0.04 0.88 0.05 0.09 0.01 0.34 0.08 0.14 0.02 0.24 0.07 0.07 0.02
6 −0.31 0.03 −0.29 0.05 – – 0.07 0.03 0.28 0.09 0.14 0.02 0.17 0.07 0.09 0.03
7 −0.26 0.03 −0.24 0.05 – – 0.17 0.02 0.44 0.09 0.17 0.02 0.26 0.07 0.10 0.02
8 0.13 0.04 0.15 0.06 0.38 0.07 0.21 0.03 0.20 0.10 0.18 0.02 −0.09 0.07 0.09 0.03
9 0.07 0.03 0.06 0.05 0.29 0.06 0.14 0.02 0.05 0.09 0.18 0.02 0.18 0.07 0.06 0.02
10 −0.31 0.03 −0.30 0.05 – – 0.12 0.03 0.29 0.08 0.12 0.02 0.19 0.07 0.08 0.03
# [P/Fe] δ[P/Fe] [S/Fe] δ[S/Fe] [K/Fe]δ[K/Fe][Ca/Fe] δ[Ca/Fe][Ti/Fe] δ[Ti/Fe][TiII/Fe] δ[Ti II/Fe] [V/Fe] δ[V/Fe] [Cr/Fe] δ[Cr/Fe]
1 0.17 0.11 0.17 0.10 0.08 0.03 0.12 0.03 0.12 0.04 −0.27 0.09 0.13 0.05 −0.06 0.03
2 0.47 0.13 −0.24 0.12 0.28 0.05 −0.02 0.04 0.26 0.05 0.46 0.11 0.07 0.09 −0.06 0.04
3 0.17 0.11 0.14 0.10 0.12 0.04 0.12 0.03 0.25 0.04 0.17 0.09 0.17 0.05 0.07 0.03
4 0.20 0.10 −0.22 0.10 0.24 0.03 0.09 0.03 0.28 0.04 0.37 0.09 0.26 0.05 0.04 0.03
5 0.12 0.09 −0.13 0.10 0.17 0.03 0.09 0.02 0.34 0.04 0.27 0.08 0.26 0.04 −0.02 0.03
6 0.22 0.11 0.04 0.10 0.14 0.04 0.07 0.03 0.28 0.04 0.18 0.10 0.19 0.06 0.02 0.03
7 0.22 0.10 −0.06 0.10 0.02 0.03 0.15 0.03 0.34 0.04 0.22 0.09 0.36 0.05 0.05 0.03
8 0.40 0.12 0.50 0.10 0.00 0.04 0.09 0.03 0.01 0.05 0.07 0.10 −0.04 0.07 0.05 0.04
9 −0.04 0.11 0.03 0.10 0.16 0.04 0.08 0.03 0.08 0.04 0.16 0.09 −0.02 0.05 −0.08 0.03
10 0.12 0.11 0.31 0.10 0.13 0.04 0.03 0.03 0.19 0.04 0.13 0.10 0.16 0.06 0.00 0.03
# [Mn/Fe] δ[Mn/Fe][Co/Fe] δ[Co/Fe][Ni/Fe]δ[Ni/Fe][Cu/Fe] δ[Cu/Fe][Ge/Fe] δ[Ge/Fe] [Rb/Fe] δ[Rb/Fe][N/Fe](raw) δ[N/Fe](raw) 1 −0.07 0.02 0.20 0.07 0.04 0.01 −0.04 0.10 −0.19 0.15 0.04 0.08 0.24 0.01
2 0.06 0.02 0.43 0.13 0.07 0.02 0.20 0.09 −0.05 0.17 −0.45 0.18 0.94 0.03
3 −0.10 0.02 0.04 0.07 0.05 0.01 – – 0.04 0.12 0.08 0.08 1.00 0.00
4 −0.08 0.02 0.17 0.06 0.05 0.01 0.02 0.11 0.02 0.12 −0.11 0.08 1.00 0.00
5 −0.00 0.02 0.22 0.05 0.03 0.01 0.16 0.11 0.03 0.11 −0.00 0.07 0.90 0.00
6 0.00 0.02 0.45 0.09 0.11 0.01 0.21 0.10 −0.18 0.17 −0.05 0.09 0.98 0.01
7 −0.03 0.02 −0.07 0.07 0.04 0.01 0.07 0.11 0.07 0.12 −0.00 0.08 1.00 0.00
8 −0.03 0.03 0.04 0.10 0.06 0.02 0.04 0.11 0.11 0.16 −0.36 0.14 0.39 0.01
9 −0.03 0.02 −0.03 0.07 0.05 0.01 0.06 0.11 0.32 0.15 0.06 0.08 0.29 0.01
10 −0.07 0.02 0.00 0.10 0.05 0.01 0.11 0.10 −0.04 0.16 −0.08 0.09 0.96 0.01
Notes:All values are given in the unit of dex. [N/Fe] (raw) are not calibrated. See text for information about [N/Fe] (raw).
In our APOGEE NGC 6553 sample, seven stars have an ‘N_WARN’ flag (Table1), indicating that the nitrogen abundance is fitted within a half grid spacing of the synthetic spectrum grid edge. A quick examination of the chemical pattern of each star in Fig. 4reveals two possible groups of stars with distinct cali-brated C (as measured from molecular lines), CI(as measured from atomic lines), and N4abundances. To further explore this idea, we
plot the patterns of [Na/Fe]–[O/Fe], [O/Fe]–[CI/Fe], [N/Fe] (raw)–
[C/Fe], and [Na/Fe]–[CI/Fe] in Fig. 5. [N/Fe] (raw) abundances
are converted from [N/M]. We use ‘raw’ here to differentiate from calibrated abundances. The [N/M] values come from a global fit to the spectrum, which is done simultaneously with the main stellar parameters, e.g.Teff, logg, and etc. The stars with the ‘N_WARN’
flag may have real [N/Fe] abundances which are higher than [N/Fe] (raw). Therefore, the [N/Fe] (raw) abundances should be used with extra caution. An independent confirmation of conclusions drawn solely from [N/Fe] (raw) would be helpful. Panels C and D of Fig.5
clearly show two groups of stars with distinct chemical abundances of [C/Fe], [CI/Fe], and [N/Fe] (raw). The best-fitting [Na/Fe]
abun-dances are different in the two groups of stars, but if measurement errors are considered, a more continuous variation in [Na/Fe] is possible. [O/Fe] abundances of the two groups of stars also have overlap. A very similar situation was also found in M4 (Villanova &
4Six stars with the ‘N_WARN’ flag (except star 5) have no calibrated N abundances assigned in DR13.
Geisler2011). Interestingly, M´esz´aros et al. (2015) suggested that the separation between N-weak and N-strong groups increases with cluster metallicity. Our confirmation of C and N bimodality in the metal-rich GC NGC 6553 agrees with this hypothesis.
The chemical variations in GCs may have several possible ex-planations. If chemical variations are caused by the first dredge-up and extra mixing in the RGB phase (Boothroyd & Sackmann1999; Charbonnel & Zahn2007), then the associated theories predict that [N/C] should be an increasing function of absolute magnitude or stellar mass. Using theKsapparent magnitude as a proxy5for
intrin-sic luminosity, however, we find no such correlation in NGC 6553 (top panel of Fig.6). M´esz´aros et al. (2015) mention that ASPCAP temperatures in metal-poor GCs may be subjected to possible off-sets with respect to ones based on photometry. NGC 6553 is one of the most metal-rich GCs, therefore the temperature offset should not be severe here. Furthermore, while there may be concern that the chemical variations are caused by temperature or surface grav-ity effects, the [N/C] versusTeffand [N/C] versus loggplots show
this concern is not valid, because the two groups of stars have sim-ilar temperatures and surface gravities (middle and bottom panels of Fig.6). Thus, the self-enriched two stellar generation scenario seems to be a viable theory to explain the chemical variations which we observed. Following the literature convention, we name these
(A)
(B)
(C)
(D)
Figure 5. Two generations of stars in the parameter space of [C/Fe], [CI/Fe], [N/Fe] (raw), [O/Fe], and [Na/Fe]. The presumed FG stars are labelled as blue circles, and the SG stars are labelled as red circles. The error bars indicate the measurement errors. The cyan stars are pure yields from the metal-rich AGB models of Ventura et al. (2013). The primordial abundances are labelled with ‘P’, and the initial mass of the stars in solar mass units are indicated by numbers. See text for more details about the models.
two stellar generations as FG and SG. The FG in NGC 6553 in-cludes stars 1, 8, and 9 (Table1), while the rest of the stars are SG. The FG stars represent almost one-third of our sample (see Section 5.2 for more discussion).
4 C H E M I C A L A B U N DA N C E S O F N G C 6 5 5 3
Before we further investigate the other element abundances of NGC 6553 derived by APOGEE, it is helpful to know more about the er-ror budgets of APOGEE measurements. Holtzman et al. (2015) estimated that the internal scatter for typical APOGEE abundance values is between 0.05 and 0.09 dex, while the external scatter is about 0.1–0.2 dex. Therefore, internally comparing the APOGEE calibrated abundances is more reliable. Recently, Souto et al. (2016) manually derived the chemical abundances for 12 stars in NGC 2420, one of the calibrating clusters for ASPCAP, and compared the results with the DR13 calibrated abundances. The derived mean metallicity for NGC 2420 stars is−0.16, which is very close to the mean metallicity of NGC 6553 stars. Therefore, the Souto
Figure 6. [N/C] (raw) as a function ofKs, Teff, and logg. The FG stars are labelled as blue circles, while the SG stars are labelled as red circles.
et al. study is informative for understanding the calibrated ASPCAP abundances which we use in this paper. Souto et al. found generally good agreements (i.e.≤0.1 dex) in the chemical abundances be-tween the manually derived results and the DR13 calibrated results, except for the elements Na, Al, and V. Note that the difference be-tween results derived manually and that from DR13 is an indication of the external abundance scatter.
Nevertheless, we also plot the results from two recent high-resolution studies of NGC 6553 in our figures: Alves-Brito et al. (2006, hereafterAB06) and Johnson et al. (2014, hereafterJ14). We include these two representative samples because the for-mer sample was observed by UVES, which has very high spec-tral resolution (R = 47 000) in the optical, and the latter one has decent sample size (N = 12), though at lower spectral resolution (R = 20 000). We use the measurements from J14
here, instead of the measurements from Zoccali et al. (2008) and Gonzalez et al. (2011), for the following reasons: (1) the
J14 and the Gonzalez et al. samples are selected from the Zoccali et al. sample. We pick one sample to avoid duplication; (2) the 12 cluster members in theJ14sample are identified by the [Fe/H] versus RV diagram; (3) the results fromJ14and Gonzalez et al. samples agree reasonably well, andJ14presents more abun-dance measurements. Unfortunately, we have no stars in common with the above samples.
4.1 The CNO, NeNa, and MgAl cycles
Figure 7. [Al/Fe] versus [Mg/Fe]. We also plot the measurements and uncertainties fromJ14(grey squares) andAB06(green triangles). The rest of the symbols are explained in Fig.5.
they can also be produced through the NeNa and MgAl cycles during the hydrogen burning (Arnould et al.1999). The noble gas Ne cannot be detected in cool stars. Meanwhile, O, as part of the CNO cycle, shows a decreasing trend with core temperature (Arnould et al.1999). Contrary to C and N, which are almost unmeasurable from optical spectra, O has a few forbidden lines in this optical region, e.g. [OI] at 6300 and 6363 Å. Though the exact nature
of the polluters responsible for O and Na variations are still under study (see Section 5), the Na–O anticorrelation is broadly observed in GCs (e.g. Sneden2000), and has been used to distinguish the two generations of stars (e.g. Carretta et al.2009a). It is also seen in this work (Panel A of Fig.5). At the same time, the O–CIcorrelation
presented in Panel B of Fig.5also suggests that the CNO cycle is activated.
The Al–Mg anticorrelation is suggestive of the MgAl cycle. Car-retta et al. (2009b) found that the Al–Mg anticorrelation is not always present in their sample of 17 Galactic GCs. The existence of this anticorrelation may be related to the mass and metallicity of the GC. Theoretical studies (Arnould et al.1999; Ventura et al.2013) indicate that the MgAl cycle requires higher temperature than the NeNa cycle, and the fraction of Mg which is transferred to Al is also smaller. In Fig.7, the [Al/Fe] dynamic range reaches∼0.5 dex, and FG stars generally show smaller [Al/Fe] than SG stars. Note that one FG star has [Al/Fe] comparable to the lowest [Al/Fe] found in SG stars. This is possibly caused by the internal error on Al measurements. On the other hand, the [Mg/Fe] abundances show a much smaller variation (∼0.08 dex). We see a hint of slightly larger [Mg/Fe] in FG stars. However, due to the internal scatter of the cal-ibrated abundances from ASPCAP (0.05–0.09 dex), we cannot tell if the [Mg/Fe] abundances are truly different in the two generations. This is consistent with the studies of Carretta et al. (2009b), who found that the Al–Mg anticorrelations are less prominent in metal-rich GCs, because the core temperature of the polluting stars may not be high enough to convert most Mg to Al. However,AB06and
J14measurements show a large Mg scatter, possibly caused by the larger errors or different stars. In any case, no Al–Mg anticorrelation can be found in any of these samples. Clearly, the calibrated Mg abundances from ASPCAP have a smaller scatter than the optical Mg abundances, a finding which supports the notion that the former [Mg/Fe] measurements have higher quality.
Figure 8. [Si/Fe] versus [Al/Fe]. Symbols are explained in Figs5and7.
Figure 9. [Al/Fe] versus [Na/Fe]. Symbols are explained in Figs5and7.
Silicon is suggested to be a possible ‘leakage’ from the MgAl cy-cle when the temperature is high enough (Arnould et al.1999; Yong et al.2005; Ventura et al.2013). The temperature dependence of Maxwellian-averaged reaction rates for proton captures can be used to predict when the28Si leakage becomes predominant in the MgAl
cycle (fig. 8 of Arnould et al. 1999). Note that this temperature may be metallicity and model dependent. Carretta et al. (2009b) ex-plained their observation of lack of a Si–Al correlation in metal-rich GCs with the Si leakage theory. The Si–Al correlation is also non-existent in the APOGEE sample of NGC 6553 stars (Fig.8). The Si abundances fromAB06andJ14seem to be systematically larger than the APOGEE results. This may be caused by the Si zero-point offset issue in APOGEE pipeline and calibration (Holtzman et al.
2015). However, similar to Mg, the calibrated Si abundances from ASPCAP also show smaller scatter than the optical Si abundances, indicating that at least their internal errors are small.
Figure 10. [Al/Fe] versus [O/Fe]. Symbols are explained in Figs5and7.
more in the primordial stars in GCs (Carretta et al.2009b), the MgAl cycle may significantly change Al, but not Mg, as observed. The Al–O anticorrelation is also suggested in other GCs (e.g. Shetrone
1996; Kraft et al.1997; Sneden et al.1997; Carretta et al.2009b, but also see Origlia et al.2011). Fig.10clearly shows that the Al–O anticorrelation is present in our sample.
4.2 αelements
According to the nucleosynthetic processes which are associated with differentαelements during Type II supernova (SNe), O and Mg are commonly classified as hydrostaticαelements, and Si, Ca, and Ti are classified as explosiveαelements (Woosley & Weaver
1995). O and Mg are two of the primaryαelements produced, and they are produced in almost the same ratio for stars of disparate mass and progenitor heavy element abundance. On the other hand, two of the heaviest explosiveαelements, Ca and Ti, follow O and Mg in the Galactic environment (e.g. Milky Way bulge), but seem to have a substantial contribution besides Type II SNe in extreme extragalactic environment (e.g. massive elliptical galaxies; Tang, Worthey & Davis2014; Worthey, Tang & Serven2014).
We have shown that O and Mg abundances may be modified in the SG stars through the CNO and MgAl cycles. In Fig.11, the two generations of stars have indistinguishable Si and Ca abundances. We note that the warmest star (Star 2) has the lowest [Si/Fe] and [Ca/Fe], probably due to the weaker transition lines in hotter stars. As we show above, the Si precision in APOGEE is generally good, but there seems to be a zero-point offset between the APOGEE data and the literature. In general, we find no obvious difference in Ca abundances between the two generations, which agrees with the similar statement of Carretta et al. (2010) and M´esz´aros et al. (2015). The APOGEE Ca abundances show smaller scatter and smaller errors than the optical Ca abundances.
To summarize, we see no clear abundance differences in Si and Ca. Using them as indicators, we infer no significant different con-tribution of Type II SNe in the FG and SG stars.
4.3 Iron-peak elements
Though Type Ia SNe, runaway deflagration obliterations of white dwarfs, have a signature more tilted towards the iron-peak group (Nomoto et al.1997), the solar composition of the iron-peak el-ements are in fact a heterogeneous combination of both Type Ia
Figure 11. [Si/Fe] and [Ca/Fe] as a function of [Fe/H]. Symbols are ex-plained in Figs5and7.
SNe and core collapse Type II SNe (Woosley & Weaver1995). As one of the most metal-rich GCs, our sample stars of NGC 6553 show a mean iron abundance of−0.15±0.05. [Cr/Fe], [Mn/Fe], and [Ni/Fe] are mostly within±0.1 dex of the solar abundances (Fig.12). [Cr/Fe] and [Mn/Fe] from APOGEE also have smaller scatter than their optical counterparts. No chemical difference is found in [Fe/H], [Cr/Fe], [Mn/Fe], and [Ni/Fe] for FG and SG stars. Apart from a few notable iron-complex GCs in the literature, the levels of [Fe/H] and iron-peak elements are very constant in GCs (Carretta et al.2009c). Therefore, it seems that Type Ia SNe do not significantly pollute SG stars.
5 D I S C U S S I O N
5.1 Elements with larger uncertainties
In this section, we discuss the elements with larger uncertainties presented in DR13. We first notice that FG and SG stars seem to show different abundances in Ti, TiII, and V. To test this notion, we
run the two-sample Kolmogorov–Smirnov (KS) test on our sample stars. For [C/Fe], [CI/Fe], [N/Fe] (raw), [O/Fe], and [Na/Fe], the
KS test showsPr≤0.05, which means that there is a≤5 per cent
chance that these two samples were drawn from the same parent distribution. Surprisingly, the two generations also show differences in Ti, TiII, and V withPr≤0.05. The reader is reminded that our
Figure 12. Iron-peak elements as a function of [Fe/H]. Symbols are ex-plained in Figs5and7.
two generations indicate at face value that a substantial amount of Ti is generated for SG stars, the opposite of O. However, the Ti and TiIIabundances from APOGEE may be subject to large
uncertain-ties. The Ti and TiIIabundances may show substantial differences
for the same star, e.g. the largest difference is found in the most Na-poor stars of our APOGEE sample (Star 1). Recent study of Hawkins et al. (2016) suggests that some of the TiIlines may be
affected by NLTE effects. Moreover, the two generations of stars also show a separation in V abundances. [V/Fe] is currently not rec-ommended because it displays a large scatter. Hawkins et al. (2016) suggested that V may be similarly affected by NLTE as Ti, since the [V/Fe]–[Fe/H] pattern becomes consistent with the literature after their line selection. In addition, the possible temperature systemat-ics from ASPCAP (Section 3) may drive the low excitation potential features, such as Ti and V, to change oppositely with respect to O.
K, one of the Alkali metals, shows similar abundances for FG and SG stars, which may indicate different nucleosynthesis than the other Alkali metal, Na. This is quite possible since Na has been modified by the NeNa cycle. S abundances show a scatter of 1 dex in our sample stars, because its lines are too weak to be properly identified in the APOGEE spectra of our sample stars. For other elements newly identified in DR13 (P, Co, Cu, Ge, and Rb), there are a few things to note: the detection of the Rb line is extremely challenging; Cu and P both present two promising and strong lines, but one of the P lines is in a region heavily affected by telluric features (Hawkins et al.2016). These elements tend to show large scatter and possible temperature trend (e.g. P in this work) in DR13. So we defer the studies of these elements to a future DR.
5.2 Comparison with literature works
On the basis of the Na–O anticorrelation in 15 GCs, Carretta et al. (2009a) concluded that the FG stars in GCs amount to about 30 per cent of the total population, what they call intermediate pop-ulation amounts to almost 60 per cent and in some clusters there is an extra about 10 per cent in an extreme population (a similar conclusion has been obtained by Bastian & Lardo2015). Using the APOGEE data, we clearly separate two generations of stars, and the FG stars account for 30 per cent of the sample, which is similar to the Carretta et al. value. However, we do not claim this to be statistically significant, due to the limited sample size of this work and unknown selection effects. A larger sample is required.
Carretta et al. (2009b) found that the Al–Mg anticorrelation and Al–Si correlation tend to be more significant in metal-poor or mas-sive GCs, while Ca does not show discernible difference between two generations in any GC (Carretta et al.2010). M´esz´aros et al. (2015) also drew similar conclusions on the aforementioned ele-ments with a self-consistent study of 10 GCs observed by APOGEE. NGC 6553 stars do not show a clear Al–Mg anticorrelation, and no distinguishable Si (and Ca) difference can be found for the two generations. As a metal-rich and intermediate-mass GC, NGC 6553 stars qualitatively agree with the literature results.
5.3 AGB polluting models
Historically, AGB stars (Ventura et al. 2011, 2013), fast rotat-ing massive stars (Decressin et al. 2007), supermassive stars (Denissenkov & Hartwick2014), and massive interactive binaries (de Mink et al.2009) have been proposed to predict the chemical behaviours of observed GCs. In this work, we select the AGB pol-luting models from Ventura et al. (2013, hereafterV13) to compare with our observations, because Renzini et al. (2015) argued that: (1) scenarios appealing to supermassive stars, fast rotating massive stars and massive interactive binaries violate in an irreparable fashion two or more constraints among their seven observational constraints; (2) the AGB models are not totally consistent with observational con-straints (e.g. mass budget problem), but there seem to be ways to save it; (3) the AGB models explicitly illustrate the metallicity and mass dependence of the observed correlations. In the AGB pollut-ing scheme, the dependence on metallicity for various correlations is a reflection of the fact that the hot-bottom burning (HBB) is ex-pected to occur at a higher temperature in more metal-poor stars. Meanwhile, the high-mass AGB stars reach higher temperature at the bottom of the convective envelope, i.e. stronger HBB. There-fore, the advanced nucleosynthetic processes (e.g. MgAl cycle and Si leakage) tend to occur in GCs with low metallicity or in GCs where pollution from massive AGB stars occurred.
Pure AGB yields from the most metal-richV13models are plotted as cyan stars in Figs5,7,8,9, and10. The primordial abundances (P) are set to solar for C, N, Na, and Al, but+0.2 for O, Mg, and Si to account for theαenhancement. Initial stellar masses of the polluting AGB stars are 3.5, 4, 4,5, 5.0, 5.5, 6.0, 6.5, 7.0, 7.5, and 8.0 M. We indicate 3.5, 8.0 M, and sometimes 5.5 Min the figures, since the last model shows the highest [Al/Fe]. The iron abundance of these models is in fact−0.5, somewhat more metal-poor than that of NGC 6553. However, the recent extension of the massive AGBV13models to solar metallicity (Di Criscienzo et al.
2016) suggests that the AGB yields of the key elements (e.g. N, Na) do not vary significantly between [Fe/H]∼ −0.5 (V13) and solar metallicity (see e.g. their figs 9 and 10).
In Fig.5, the FG stars show similar [C/Fe], [N/Fe], [O/Fe], and [Na/Fe] to the primordial abundances, suggesting that the initial abundances determined by the chemical evolution of the Galaxy are also valid in NGC 6553. The SG stars show consistent [N/Fe] and [O/Fe] with the models, though the readers are reminded that the observational N abundances are estimated near the synthetic spectrum grid edge. In theV13AGB models, the C depletion and Na enhancement are clearly stronger than those measured in the most contaminated stars in the cluster. The data of NGC 6553 can only be matched under the AGB scenario if some dilution of the AGB ejecta with pristine material is assumed to happen. Such dilution is required to explain both the Na–O anticorrelation and to reduce the discrepancy between model predictions and the data for [C/Fe] and [Na/Fe]. Fig.8shows that one FG star has large [Al/Fe], which is close to the SG stars, but the other two FG stars have [Al/Fe] abundances similar to the primordial values. The [Mg/Fe] values also match reasonably well for FG stars. The smaller scatter observed in [Mg/Fe] is well reproduced by the almost constant [Mg/Fe] in the pure AGB models, but the dynamic range of [Al/Fe] in the models is slightly smaller (although only of the order of the abundance errors of about 0.1 dex) than the observed one.6In this
case, the dilution correction has a much smaller impact on the Al abundances. For example, the same degree of pollution required to decrease the Na of the ejecta (by∼0.7 dex) to the highest value observed (∼0.4–0.5 dex) would hardly change the situation for Al, as the expected abundances of the latter element would decrease from∼0.3 (in the pure AGB ejecta) to∼0.2 dex (after dilution correction) (Ventura, private communication).
The observed [Si/Fe] in Fig.8obviously show an offset with re-spect to the models, which may be again related with the zero-point issue found in DR13 calibrated Si abundances. However, the ob-served constant [Si/Fe] behaviour is well reproduced by the models. This implies that the Si leakage from the MgAl chain is not present or very weak in NGC 6553. In Figs9and10, we again see that the theoretical primordial abundances are representative of the FG stars, but the slopes of the observed correlations are different from the models, mainly due to the lower [Al/Fe] and higher [Na/Fe] produced in the pure AGB models.
Before ending this section, there are some caveats in modelling which we should note. We compare the pure model yield predictions
6Ventura et al. (2011) attempted to fix the small [Al/Fe] dynamic range
problem in metal-poor models by increasing the cross-section of the MgAl chain by a factor of 2 with respect to the highest value allowed by the European compilation of reaction rates for astrophysics compilation. This revision reproduces the dynamic ranges of Mg depletion and Al enhance-ment observed in metal-poor GCs. Therefore, it may be worth investigating the similar subject in the more metal-rich models.
directly with the stellar abundance data for GC members follow-ing Ventura et al. (2011). These comparisons are only meaningful under the notion that SG stars with a given enhanced abundance pattern are only enriched (or depleted) by those FG stars in the mass range required to generate the needed yields. An exceedingly fine tuning of the star formation and chemical evolution time-scales is needed in order to accomplish even rough agreement with the observations. Such somewhat contrived requirements are posed by all self-enrichment models, so they are not unique to the particu-lar models adopted for the comparisons in this work. Under those assumptions, our comparison with the pure AGB metal-richV13
models shows that data can only be matched by assuming some dilu-tion of the AGB ejecta with pristine material in order to reproduce the observed Na–O anticorrelation and the [C/Fe], [Na/Fe], and [Al/Fe] abundances. We defer a detailed quantitative confrontation between model and data to a future publication.
6 S U M M A RY
We present our study of the stellar chemical abundances of the bulge GC NGC 6553 using calibrated APOGEE values from SDSS DR13. In total, 10 red giants are identified as cluster members using their positions, radial velocities, iron abundances, and NIR photom-etry. Our sample stars have a mean RV of−0.14±5.47 km s−1, and a mean [Fe/H] of−0.15± 0.05, which are consistent with the more recent literature results. We clearly separate two popula-tions of stars in C and N in this GC for the first time. Three stars are grouped as FG, while seven stars are grouped as SG. Strong N–C and Na–O anticorrelations are found with the abundances de-rived by APOGEE. The Al–Na correlation and Al–O anticorrelation are also confirmed. However, the Mg–Al anticorrelation cannot be confirmed since [Mg/Fe] show a scatter comparable to that from ASPCAP. We see no obvious difference in Si and Ca abundances for the two generations. Therefore, our results suggest that the CNO, NeNa, and MgAl cycles have been activated, but the MgAl cycle is too weak to show its effect in Mg. The Si leakage from the MgAl cycle is also weak. Two generations show similar iron-peak element abundances (Fe, Cr, Mn, and Ni), which suggests that Type Ia SNe do not significantly affect the pollution of SG stars.
As a metal-rich and intermediate-mass GC, our results in NGC 6553 generally agree with the current knowledge about GC stellar abundance correlations, i.e. weaker Al–Mg correlation and no Si (or Ca) variation in metal-rich GCs. We also compare our results with the AGB polluting models ofV13. Our comparison with the pure AGB metal-richV13 models shows that the observed data can only be matched by assuming some dilution of the AGB ejecta with pristine material. In addition, self-enrichment models with star formation and chemical evolution is necessary for further GC chemical studies.
From a sample of 10 cluster members, we unequivocally iden-tified two groups of stars with distinct chemical abundances in NGC 6553. Meanwhile, our discussions about various correlations (e.g. the Al–Na correlation) should be confirmed by a larger, self-consistent sample. Detailed studies of chemical abundances in other bulge GCs (Schiavon et al.2016) will be also very helpful to un-derstand the astrophysical processes in these stellar systems.
AC K N OW L E D G E M E N T S
Centro de Excelencia en Astrof´ısica y Tecnolog´ıas Afines (CATA) grant PFB-06/2007. REC acknowledges funding through Gemini-CONICYT Project 32140007. DAG-H was funded by the Ramon y Cajal fellowship number RYC-2013-14182. DAG-H and OZ ac-knowledge support provided by the Spanish Ministry of Economy and Competitiveness (MINECO) under grant AYA-2014-58082-P. AM acknowledges support from Proyecto Interno UNAB DI-677-15/N. JGF-T is currently supported by Centre National d’Etudes Spatiales (CNES) through PhD grant 0101973 and the R´egion de Franche-Comt´e and by the French Programme National de Cos-mologie et Galaxies (PNCG).
Funding for the Sloan Digital Sky Survey IV (SDSS-IV) has been provided by the Alfred P. Sloan Foundation, the US Department of Energy Office of Science, and the Participating Institutions. SDSS-IV acknowledges support and resources from the Center for High-Performance Computing at the University of Utah. The SDSS web site iswww.sdss.org.
SDSS-IV is managed by the Astrophysical Research Consor-tium for the Participating Institutions of the SDSS Collaboration including the Brazilian Participation Group, the Carnegie Institu-tion for Science, Carnegie Mellon University, the Chilean Participa-tion Group, the French ParticipaParticipa-tion Group, Harvard-Smithsonian Center for Astrophysics, Instituto de Astrof`ısica de Canarias, The Johns Hopkins University, Kavli Institute for the Physics and Math-ematics of the Universe (IPMU)/University of Tokyo, Lawrence Berkeley National Laboratory, Leibniz Institut f¨ur Astrophysik Potsdam (AIP), Max-Planck-Institut f¨ur Astronomie (MPIA Hei-delberg), Max-Planck-Institut f¨ur Astrophysik (MPA Garching), Max-Planck-Institut f¨ur Extraterrestrische Physik (MPE), National Astronomical Observatory of China, New Mexico State Univer-sity, New York UniverUniver-sity, University of Notre Dame, Observat´orio Nacional/MCTI, The Ohio State University, Pennsylvania State University, Shanghai Astronomical Observatory, United Kingdom Participation Group, Universidad Nacional Aut´onoma de M´exico, University of Arizona, University of Colorado Boulder, University of Oxford, University of Portsmouth, University of Utah, Univer-sity of Virginia, UniverUniver-sity of Washington, UniverUniver-sity of Wisconsin, Vanderbilt University, and Yale University.
R E F E R E N C E S
Alonso-Garc´ıa J., Mateo M., Sen B., Banerjee M., Catelan M., Minniti D., von Braun K., 2012, AJ, 143, 70
Alves-Brito A. et al., 2006, A&A, 460, 269 (AB06) Arnett W. D., 1971, ApJ, 166, 153
Arnould M., Goriely S., Jorissen A., 1999, A&A, 347, 572 Babusiaux C. et al., 2010, A&A, 519, A77
Barbuy B., Renzini A., Ortolani S., Bica E., Guarnieri M. D., 1999, A&A, 341, 539
Bastian N., Lardo C., 2015, MNRAS, 453, 357
Bergemann M., Kudritzki R.-P., W¨url M., Plez B., Davies B., Gazak Z., 2013, ApJ, 764, 115
Bergemann M., Kudritzki R.-P., Gazak Z., Davies B., Plez B., 2015, ApJ, 804, 113
Bica E., Ortolani S., Barbuy B., 2016, PASA, 33, 28
Boberg O. M., Gerber J. M., Friel E. D., Martell S., Briley M. M., Morrison H. L., 2016, AJ, 151, 127
Boothroyd A. I., Sackmann I.-J., 1999, ApJ, 510, 232 Carretta E. et al., 2009a, A&A, 505, 117
Carretta E., Bragaglia A., Gratton R., Lucatello S., 2009b, A&A, 505, 139 Carretta E., Bragaglia A., Gratton R., D’Orazi V., Lucatello S., 2009c, A&A,
508, 695
Carretta E., Bragaglia A., Gratton R., Lucatello S., Bellazzini M., D’Orazi V., 2010, ApJ, 712, L21
Carretta E. et al., 2014, A&A, 564, A60 Carretta E. et al., 2015, A&A, 578, A116 Charbonnel C., Zahn J.-P., 2007, A&A, 467, L15 Chen´e A.-N. et al., 2012, A&A, 545, A54
Clayton D., 2007, Handbook of Isotopes in the Cosmos. Cambridge Univ. Press, Cambridge
Coelho P., Barbuy B., Perrin M.-N., Idiart T., Schiavon R. P., Ortolani S., Bica E., 2001, A&A, 376, 136
Cohen J. G., Gratton R. G., Behr B. B., Carretta E., 1999, ApJ, 523, 739 Cohen R. E., Mauro F., Geisler D., Moni Bidin C., Dotter A., Bonatto C.,
2014, AJ, 148, 18
Cohen R. E., Moni Bidin C., Mauro F., Bonatto C., Geisler D., 2016, preprint (arXiv:e-prints)
Cummings J. D., Geisler D., Villanova S., Carraro G., 2014, AJ, 148, 27 de Mink S. E., Pols O. R., Langer N., Izzard R. G., 2009, A&A, 507, L1 Decressin T., Charbonnel C., Meynet G., 2007, A&A, 475, 859 Denissenkov P. A., Hartwick F. D. A., 2014, MNRAS, 437, L21 Di Criscienzo M. et al., 2016, MNRAS, 462, 395
Dias B. et al., 2015, A&A, 573, A13 Eisenstein D. J. et al., 2011, AJ, 142, 72
Garc´ıa-Hern´andez D. A., M´esz´aros S., Monelli M., Cassisi S., Stetson P. B., Zamora O., Shetrone M., Lucatello S., 2015, ApJ, 815, L4
Garc´ıa P´erez A. E. et al., 2016, AJ, 151, 144 Gonzalez O. A. et al., 2011, A&A, 530, A54
Gonzalez O. A., Rejkuba M., Zoccali M., Valenti E., Minniti D., Schultheis M., Tobar R., Chen B., 2012, A&A, 543, A13
Gratton R., Sneden C., Carretta E., 2004, ARA&A, 42, 385
Gratton R. G., Johnson C. I., Lucatello S., D’Orazi V., Pilachowski C., 2011, A&A, 534, A72
Gratton R. G., Carretta E., Bragaglia A., 2012, A&AR, 20, 50 Gratton R. G. et al., 2015, A&A, 573, A92
Guarnieri M. D., Ortolani S., Montegriffo P., Renzini A., Barbuy B., Bica E., Moneti A., 1998, A&A, 331, 70
Gunn J. E. et al., 2006, AJ, 131, 2332 Harris W. E., 1996, AJ, 112, 1487
Hawkins K., Masseron T., Jofre P., Gilmore G., Elsworth Y., Hekker S., 2016, A&A, 594, 43
Hill V. et al., 2011, A&A, 534, A80 Holtzman J. A. et al., 2015, AJ, 150, 148 Howes L. M. et al., 2016, MNRAS, 460, 884
Johnson C. I., Rich R. M., Fulbright J. P., Valenti E., McWilliam A., 2011, ApJ, 732, 108
Johnson C. I., Rich R. M., Kobayashi C., Kunder A., Koch A., 2014, AJ, 148, 67 (J14)
Kraft R. P., 1979, ARA&A, 17, 309 Kraft R. P., 1994, PASP, 106, 553
Kraft R. P., Sneden C., Smith G. H., Shetrone M. D., Langer G. E., Pilachowski C. A., 1997, AJ, 113, 279
Kunder A. et al., 2014, A&A, 572, A30
Lee Y.-W., Joo J.-M., Sohn Y.-J., Rey S.-C., Lee H.-C., Walker A. R., 1999, Nature, 402, 55
McLaughlin D. E., van der Marel R. P., 2005, ApJS, 161, 304 Majewski S. R. et al., 2015, preprint (arXiv:e-prints)
Mauro F., Moni Bidin C., Cohen R., Geisler D., Minniti D., Catelan M., Chen´e A.-N., Villanova S., 2012, ApJ, 761, L29
Mauro F., Moni Bidin C., Chen´e A.-N., Geisler D., Alonso-Garc´ıa J., Borissova J., Carraro G., 2013, Rev. Mex. Astron. Astrofis., 49, 189 Mel´endez J., Barbuy B., Bica E., Zoccali M., Ortolani S., Renzini A., Hill
V., 2003, A&A, 411, 417 M´esz´aros S. et al., 2015, AJ, 149, 153 Milone A. P. et al., 2015, ApJ, 808, 51 Minniti D. et al., 2010, New Astron., 15, 433 Ness M. et al., 2013, MNRAS, 430, 836 Nidever D. L. et al., 2015, AJ, 150, 173
Nomoto K., Iwamoto K., Nakasato N., Thielemann F.-K., Brachwitz F., Tsujimoto T., Kubo Y., Kishimoto N., 1997, Nucl. Phys. A, 621, 467 Origlia L., Rich R. M., Castro S., 2002, AJ, 123, 1559
Osborn W., 1971, Observatory, 91, 223
Pancino E., Ferraro F. R., Bellazzini M., Piotto G., Zoccali M., 2000, ApJ, 534, L83
Piotto G. et al., 2015, AJ, 149, 91 Renzini A. et al., 2015, MNRAS, 454, 4197 Schiavon R. P. et al., 2016, in press Schultheis M. et al., 2015, A&A, 584, A45
SDSS Collaboration et al., 2016, preprint (arXiv:e-prints) Shetrone M. D., 1996, AJ, 112, 1517
Shetrone M. et al., 2015, ApJS, 221, 24 Skrutskie M. F. et al., 2006, AJ, 131, 1163
Sneden C., 2000, in Noels A., Magain P., Caro D., Jehin E., Parmentier G., Thoul A. A., eds, Proc. Liege Int. Astrophys. Colloq. 35, The Galactic Halo : From Globular Cluster to Field Stars. Inst Astrophys. Geophys., Belgium, p. 159
Sneden C., Kraft R. P., Shetrone M. D., Smith G. H., Langer G. E., Prosser C. F., 1997, AJ, 114, 1964
Souto D. et al., 2016, ApJ, 830, 35
Tang B., Worthey G., Davis A. B., 2014, MNRAS, 445, 1538 Valenti E., Ferraro F. R., Origlia L., 2010, MNRAS, 402, 1729 Ventura P., Carini R., D’Antona F., 2011, MNRAS, 415, 3865
Ventura P., Di Criscienzo M., Carini R., D’Antona F., 2013, MNRAS, 431, 3642 (V13)
Villanova S., Geisler D., 2011, A&A, 535, A31
Watkins L. L., van der Marel R. P., Bellini A., Anderson J., 2015, ApJ, 803, 29
Woosley S. E., Weaver T. A., 1995, ApJS, 101, 181 Worthey G., Tang B., Serven J., 2014, ApJ, 783, 20
Yong D., Grundahl F., Nissen P. E., Jensen H. R., Lambert D. L., 2005, A&A, 438, 875
Yong D., Grundahl F., Johnson J. A., Asplund M., 2008, ApJ, 684, 1159 Zamora O. et al., 2015, AJ, 149, 181
Zoccali M., Hill V., Lecureur A., Barbuy B., Renzini A., Minniti D., G´omez A., Ortolani S., 2008, A&A, 486, 177
1Departamento de Astronom´ıa, Universidad de Concepci´on, Casilla 160-C,
Concepci´on 3349001, Chile
2Astrophysics Research Institute, Liverpool John Moores University, Liverpool L3 5RF, UK
3Department of Astronomy, University of Virginia, Charlottesville, VA 22904-4325, USA
4Instituto de Astrofisica de Canarias, 38205 La Laguna, E-38205 Tenerife, Spain
5Department of Astronomy, University of Texas at Austin, Austin, TX 78712, USA
6Department of Physics and Astronomy, Texas Christian University, Fort Worth, TX 76129, USA
7Departamento de Ciencias Fisicas, Universidad Andres Bello, Av. Republica 220, Santiago 13114, Chile
8Institut Utinam, CNRS UMR 6213, Universit´e de Franche-Comt´e, OSU THETA Franche-Comt´e-Bourgogne, Observatoire de Besanc¸on, BP F-1615, 25010 Besanc¸on Cedex, France
9Universidad de Chile, Av. Libertador Bernardo O’Higgins 1058, 13114
Santiago de Chile
10Key Laboratory for Research in Galaxies and Cosmology, Shanghai As-tronomical Observatory, Chinese Academy of Sciences, 80 Nandan Road, Shanghai 200030, China
11Instituto de Astrofisica, Pontificia Universidad Cat´olica de Chile, Av. Vicuna Mackenna 4860, 782-0436 Macul, Santiago, Chile
12Unidad de Astronom´ıa, Universidad de Antofagasta, Avenida Angamos 601, Antofagasta 1270300, Chile
13Apache Point Observatory and New Mexico State University, PO Box 59, Sunspot, NM 88349-0059, USA
14Sternberg Astronomical Institute, Moscow State University, 119992 Moscow

![Figure 6. [N/C] (raw) as a function of K s , T eff , and log g. The FG stars are labelled as blue circles, while the SG stars are labelled as red circles.](https://thumb-us.123doks.com/thumbv2/123dok_es/3787164.647719/7.892.79.417.83.649/figure-function-stars-labelled-circles-stars-labelled-circles.webp)
![Figure 7. [Al/Fe] versus [Mg/Fe]. We also plot the measurements and uncertainties from J14 (grey squares) and AB06 (green triangles)](https://thumb-us.123doks.com/thumbv2/123dok_es/3787164.647719/8.892.468.806.84.339/figure-versus-plot-measurements-uncertainties-squares-green-triangles.webp)
![Figure 10. [Al/Fe] versus [O/Fe]. Symbols are explained in Figs 5 and 7.](https://thumb-us.123doks.com/thumbv2/123dok_es/3787164.647719/9.892.472.809.85.579/figure-al-fe-versus-fe-symbols-explained-figs.webp)
![Figure 12. Iron-peak elements as a function of [Fe/H]. Symbols are ex- ex-plained in Figs 5 and 7.](https://thumb-us.123doks.com/thumbv2/123dok_es/3787164.647719/10.892.74.415.86.582/figure-iron-peak-elements-function-symbols-plained-figs.webp)
