European Journal of Government and Economics
ISSN: 2254-7088
The Relationship Between Corporate Tax Rate and Economic
Growth During the Global Financial Crisis: Evidence from a Panel
VAR
Gamze Oz-Yalamana*
aEskisehir Osmangazi University, Eskishehir, Turkey.
* Corresponding author at: [email protected]
Article history. Received 17 January 2019; first revision required 10 August 2019; accepted 11 September 2019.
Abstract. This paper compares dynamic relationship between economic growth and corporate tax rate during the recent financial crisis and the non–crisis period using a panel VAR for 29 OECD countries over the period 1998-2016. The results show that corporate tax rate has a significantly negative effect on economic growth. Moreover, the recent financial crisis has had a significant effect on the endogenous interaction between corporate tax rate and economic growth. According to Granger causality test, there is only one-way causality from corporate tax rate to economic growth during the non-crisis period. Interestingly, there are not any causal relationships between corporate tax rate and economic growth during the crisis period. The results show that the recent crisis has had a significant effect on the endogenous interaction between corporate tax rate and economic growth.
Key words: Corporate tax, OECD countries, Panel VAR. JEL Code: H25, F23
DOI. https://10.17979/ejge.2019.8.2.5074
1. Introduction
190
productivity. In these models, taxation on both physical capital and human capital affect economic growth negatively (Lucas, 1990; Trostel, 1993). A wide range of further studies support the common findings in endogenous growth literature which suggests that taxation has effects on economic growth. For example, Helms (1985) focuses on how state and local taxes effect economic growth and concludes that increase of the state and local tax retard economic growth significantly. Koester and Kormendi (1989) analyze the effects of average and marginal tax rates on economic growth. Their results show that there is a significantly negative relationship between both average and marginal tax rates and economic growth over 63 countries.
In addition to these studies, there is a mass of literature that empirically investigates the relationship between economic growth and taxation (King and Rebelo, 1990; Lucas, 1990; Engen and Skinner, 1996; Gober and Burns, 1997; Lee and Gordon, 2005; Dackehag and Hansson, 2012; Adkisson and Mohammed, 2014; Stoilova, 2017). On the other hand, the empirical findings of these studies for the presence and direction of this relationship are controversial. For example, some studies support the existence of both negative (Lee and Gordon, 2005; Dackehag and Hansson, 2012) and positive (Gober and Burns, 1997; Stoilova, 2017) relationships, while some studies do not support the existence of any relationship between taxation and economic growth at all (Stokey and Rebelo, 1995; Mendoza et al., 1997). These studies also focus on the relationship between different types of taxation and economic growth. Some of them focus on personal income tax (Pecerino, 1994; Gober and Burns, 1997; Wildmalm, 2001), while some other focus on sales tax or property tax (Gober and Burns, 1997; Ojede and Yamarik; 2012; Stoilova, 2017). Also, there are studies investigating the relationship between corporate tax rates and economic growth (Lee and Gordon, 2005; Dackehag and Hansson, 2012; Adkisson and Mohammed, 2014).
Considering the tax deduction discussions on corporate tax in policy circles, understanding the connection between corporate tax rate and economic growth is very important. However, there are still few studies comparing the effect of corporate tax rate on economic growth. Thus, this paper contributes to the literature by exploring the corporate taxes as one of the robust determinants of economic growth. We use a larger sample and a more comprehensive set of variables. For example, the countries employed in this paper approximately produce 46% of the world GDP. Moreover, it is clear that financial crises have a significant effect on economic structure. Thus, this paper also contributes to the literature by taking into account the effect of financial crises on the endogenous interaction between corporate tax rate and economic growth. For this reason, we first estimate the model from the full sample period, and then to compare the relationship between non-crisis and crisis period, we re-estimate the same model for the sub-sample periods as the pre-crisis, crisis and post-crisis.
191
interaction between corporate tax rate and economic growth.
The following section includes a literature review. Section 3 shows description of data and section 4 presents the model specification. Section 4 provides the empirical results and discussion, while section 5 concludes.
2. Literature Review
The relationship between taxation and economic growth has been investigated in many papers (Lucas, 1990; King and Rebelo, 1990; Engen and Skinner, 1996; Lee and Gordon, 2005; Ojede and Yamarik, 2012; Atems, 2015). It is important to answer the question of how tax policy affects economic growth. There are several ways. First, corporate tax rates affect investment decision adversely. There are numerous studies in the literature showing that corporate tax rates have a significantly negative effect on investments and foreign direct investments (Slemrod, 1990; Desai et al. 2004; Benassy-Quere et al., 2005; De Mooij and Ederveen, 2005, 2006; Djankov et al., 2010). Second, taxes may affect labor supply or, in another words, labor-leisure choice adversely (Engen and Skinner, 1996; Salanie, 2003; Hindricks and Myles; 2006).
The effect of tax rate on economic growth has been a popular research topic. Many papers in the literature emphasize the significantly negative effect of tax rate on economic growth. For example, Easterly and Rebelo (1993) examine the relationships between fiscal policy and economic growth by using the fiscal variables such as central government surplus, public investment and different measures of tax rates. They conclude that a marginal income tax rate has a negative effect on economic growth. The issue of growth and taxation is also addressed by Razin and Yuen (1996). They investigate the relationship between capital income taxation and economic growth, considering the international capital mobility and endogenous population. Under perfect capital mobility, capital income taxes have larger effects on the long-run growth than under no-capital mobility. Engen and Skinner (1996) highlight the effect of tax policy on economic growth. In fact, they report that a 5% decrease in a marginal tax rate or a 2.5% decrease in average tax rate would likely increase economic growth by 0.2% or 0.3%. Although this effect can be considered to be marginal, it can be clearly seen that there is a big long-term effect by accumulating over the past 36 years. Koch, Schoeman and van Tonder (2005) examine the relationship between taxation and economic growth in South Africa from 1960 to 2002. Their findings show that there is a significantly negative relationship between tax burden and economic growth.
192
economic growth. Pesendorfer (2008) shows that the high level of labor taxes affects the growth potential negatively in Austria. Ojede and Yamarik (2012) test the short and long-run effects of tax policy on state-level growth for 48 contiguous US states over the period from 1967 to 2008. They find a significantly negative effect of property and sales tax rates on long-run income growth, while there is not any significant evidence of income tax rates on growth. Dackehag and Hansson (2012) investigate the relationship between income taxation and economic growth using statutory tax rates on corporate and personal income for 25 rich OECD countries in the period 1975-2010. They find that both taxation of corporate and personal income have a negative effect on economic growth. In contrast to common view, there are studies suggesting a positive relationship between some taxes and economic growth. Gober and Burns (1997) state that increases in personal income tax, sales tax and corporate income tax increase GNP, while increases in property tax decrease GNP. Stoilova (2017) focuses on the relationship between taxes and economic growth for the 28 EU countries in the period 1996-2013. The findings of that study suggest that the taxes on productions and imports have a strong positive impact on economic growth, but the value added taxes have a negative effect on economic growth. The property taxes and economic growth relationship is insignificant, while the personal income tax has a positive effect. However, the corporate taxes have a positive but very weak effect on economic growth. Moreover, the coefficients become insignificant when using instrumental variables.
It is also possible to find some studies that cannot capture any significant relationship between taxation and economic growth. For example, Wang and Yip (1992) state that the negative impact of factor taxes on economic growth is compensated by the positive impact of consumption taxes in Taiwan. Therefore, aggregate tax rates do not have an effect on long-run economic growth. In addition, their findings suggest that the tax structure is more important than level of taxation. Pecorino (1994) also highlights the effect of tax structure. He concludes that the effect of changing the income tax with a consumption tax on the growth rate is estimated to be 1% per capita per year. Pecorino (1995) also finds that the negative effect of taxation on growth is mild. Stokey and Rebelo (1995) investigate the effect of tax reform on economic growth in the U.S. They conclude that tax reform would have little or no effect on the U.S. growth rate. Mendoza et al. (1997) examine the effects of tax structure on growth and investment by using panel data for 18 OECD countries. They do not capture any significant evidence supporting the association between tax structure and growth. Myles (2000) reviews the association between taxation and economic growth by focusing on both theoretical and empirical frameworks. He concludes that the effect of taxation on growth is negligible. However, when the growth is endogenous, taxation can affect the factors that determine growth. Therefore, he states that tax structure is critical.
193
have negative effects on productivity and investments. Thus, corporate income taxes can be harmful for growth. Atems (2015) uses a different methodology, spatial econometric models as called from previous studies. The main finding of that study is that while 1% increase in state and local taxes is associated with a 0.37% decrease in growth in the short-run, 1% increase in state and local taxes is associated with a 0.33% decrease in growth in the long-run.
There are few studies explaining how the financial crisis affects this relationship. For example, Adkisson and Mohammed (2014) investigate that the relationship between the tax structure and short-run growth through the business cycle, particularly in the 2008 Great Recession. They use a pool of data on the 50 states of U.S. between 2004 and 2010. Their results show that differences in tax structure have little effect on economic growth in the context of Great Recession in 2008. In addition, short-term decreases in corporate taxes are not recommended to contribute to the recovery. In the light of these considerations, the aim of this paper is to fill the gap in the literature by comparing the dynamic relationship between corporate tax rate and economic growth during the recent financial crisis and non-crisis periods.
3. Data
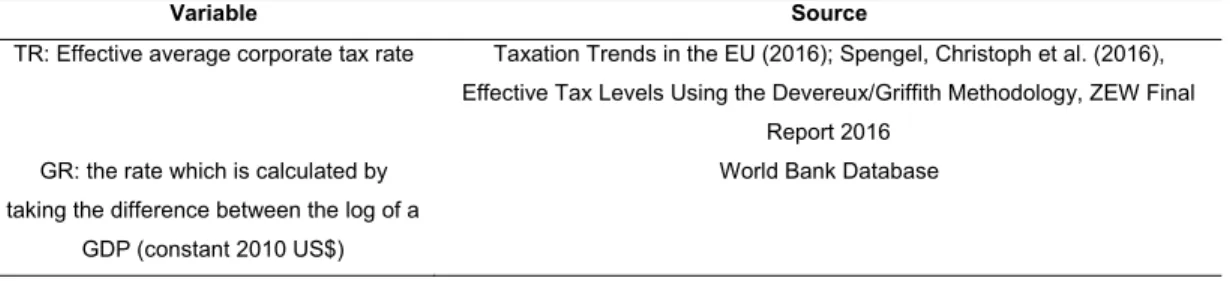
The data covers 29 OECD economies for the period between 1998 and 2016, for which the data is available. We use panel data that consists of both cross-sectional and time series information to test for any endogenous interaction between different corporate tax rate (TR) and economic growth rate (GR). The source of data is presented in Table 1.
We first estimate the model from the full sample period, and then to compare the relationship between the non-crisis and crisis periods, we re-estimate the same model for the sub-sample periods as the pre-crisis, crisis and post-crisis. Detection of crisis periods is a controversial topic in the literature. The distributions of data, threshold models and news based framework are some of the common methodologies in the literature (Lowell et. al, 1998; Favero and Giavazzi, 2002; Dungey, 2009). Following the existing literature, the crisis period is defined from 2007 to 2008 based on a news-based framework (Dungey, 2014; NBER 2010; Yalama, 2012). The pre-crisis period ranges from 1998 to 2006, the pre-crisis period ranges from 2007 to 2008, and the post-crisis period ranges from 2009 to 2016.
Table 1. Variables and Sources
Variable Source
TR: Effective average corporate tax rate Taxation Trends in the EU (2016); Spengel, Christoph et al. (2016), Effective Tax Levels Using the Devereux/Griffith Methodology, ZEW Final
Report 2016 GR: the rate which is calculated by
taking the difference between the log of a GDP (constant 2010 US$)
194
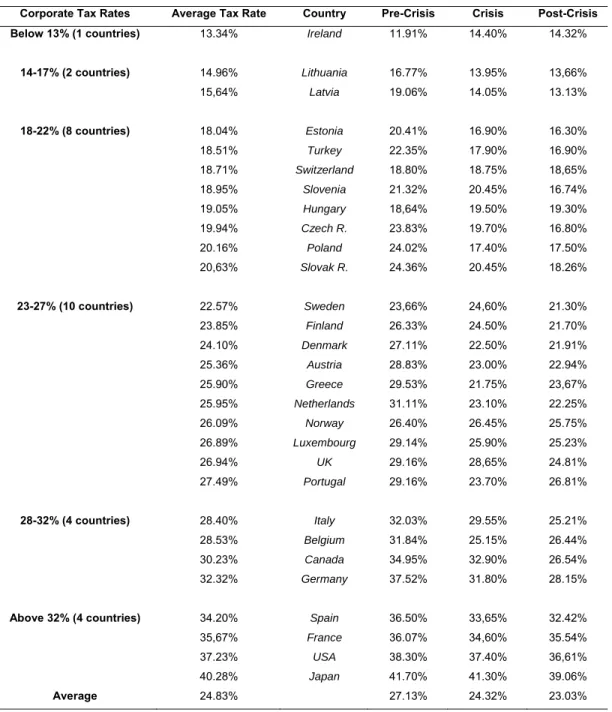
Table 2 shows that there is a huge variation in corporate tax rates across countries. In other words, there exists a large variation in corporate tax rates across countries. Corporate tax rates also vary significantly over the pre-crisis, crisis and post-crisis sub-periods. Average corporate tax rates drop from 27.13% in the pre-crisis period, to 24.32% in the crisis period, and then drop again to 23.03% level in the post-crisis period. Cross-country variation of corporate tax rates tends to persist over years.
Table 2. Distribution of corporate tax rates in the countries over 1998-2005
Corporate Tax Rates Average Tax Rate Country Pre-Crisis Crisis Post-Crisis
Below 13% (1 countries) 13.34% Ireland 11.91% 14.40% 14.32%
14-17% (2 countries) 14.96% Lithuania 16.77% 13.95% 13,66%
15,64% Latvia 19.06% 14.05% 13.13%
18-22% (8 countries) 18.04% Estonia 20.41% 16.90% 16.30%
18.51% Turkey 22.35% 17.90% 16.90%
18.71% Switzerland 18.80% 18.75% 18,65%
18.95% Slovenia 21.32% 20.45% 16.74%
19.05% Hungary 18,64% 19.50% 19.30%
19.94% Czech R. 23.83% 19.70% 16.80%
20.16% Poland 24.02% 17.40% 17.50%
20,63% Slovak R. 24.36% 20.45% 18.26%
23-27% (10 countries) 22.57% Sweden 23,66% 24,60% 21.30%
23.85% Finland 26.33% 24.50% 21.70%
24.10% Denmark 27.11% 22.50% 21.91%
25.36% Austria 28.83% 23.00% 22.94%
25.90% Greece 29.53% 21.75% 23,67%
25.95% Netherlands 31.11% 23.10% 22.25%
26.09% Norway 26.40% 26.45% 25.75%
26.89% Luxembourg 29.14% 25.90% 25.23%
26.94% UK 29.16% 28,65% 24.81%
27.49% Portugal 29.16% 23.70% 26.81%
28-32% (4 countries) 28.40% Italy 32.03% 29.55% 25.21%
28.53% Belgium 31.84% 25.15% 26.44%
30.23% Canada 34.95% 32.90% 26.54%
32.32% Germany 37.52% 31.80% 28.15%
Above 32% (4 countries) 34.20% Spain 36.50% 33,65% 32.42%
35,67% France 36.07% 34,60% 35.54%
37.23% USA 38.30% 37.40% 36,61%
40.28% Japan 41.70% 41.30% 39.06%
195
As can clearly be seen in Table 2, corporate tax rates have declined over the last 10 years in most of the countries. It is interesting to test whether the decrease of corporate tax rate brings economic growth in to the OECD countries during the crisis and non-crisis period. There are so many empirical papers emphasizing that higher corporate tax rates should decrease economic growth (see Lee and Gordon, 2005; Arnold et al., 2011; Dackehag and Hansson, 2012). Interestingly, however, there are currently no studies that compares the effect of corporate tax rate on economic growth during the crisis and non-crisis periods.
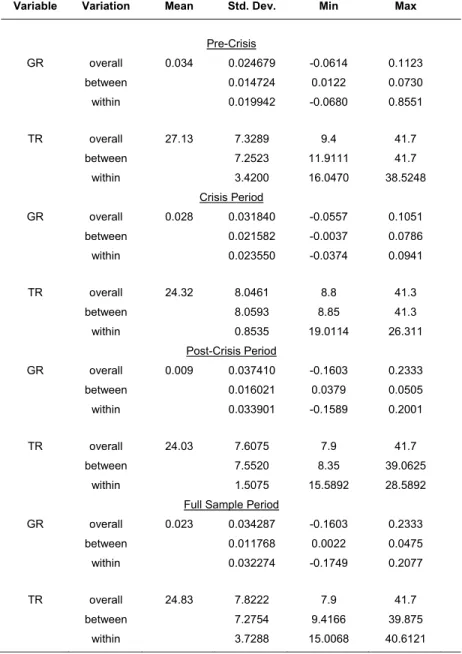
Table 3 presents the descriptive statistics for GR and TR with respect to the overall, within and between variations during the periods of pre-crisis, crisis and post-crisis. Overall variation represents variation over years and countries. Between variation represents variation between countries, and within variation represents variation within each country (over years).
Table 3: Descriptive Statistics
Variable Variation Mean Std. Dev. Min Max
Pre-Crisis
GR overall 0.034 0.024679 -0.0614 0.1123
between 0.014724 0.0122 0.0730
within 0.019942 -0.0680 0.8551
TR overall 27.13 7.3289 9.4 41.7
between 7.2523 11.9111 41.7
within 3.4200 16.0470 38.5248
Crisis Period
GR overall 0.028 0.031840 -0.0557 0.1051
between 0.021582 -0.0037 0.0786
within 0.023550 -0.0374 0.0941
TR overall 24.32 8.0461 8.8 41.3
between 8.0593 8.85 41.3
within 0.8535 19.0114 26.311
Post-Crisis Period
GR overall 0.009 0.037410 -0.1603 0.2333
between 0.016021 0.0379 0.0505
within 0.033901 -0.1589 0.2001
TR overall 24.03 7.6075 7.9 41.7
between 7.5520 8.35 39.0625
within 1.5075 15.5892 28.5892
Full Sample Period
GR overall 0.023 0.034287 -0.1603 0.2333
between 0.011768 0.0022 0.0475
within 0.032274 -0.1749 0.2077
TR overall 24.83 7.8222 7.9 41.7
between 7.2754 9.4166 39.875
196
According to Table 3, the mean values for GR and TR are 0.034 and 27.13% for the pre-crisis period; 0.028 and 24.32% for the pre-crisis period; and 0.009 and 24.03% for the post-pre-crisis period, respectively. The minimum values for GR and TR are -0.06 and 9.4% for the pre-crisis period; -0.05 and 8.8% for the crisis period; and -0.16 and 7.9% for the post-crisis period, while the maximum values for GR and TR are 0.11 and 41.7% for the pre-crisis period; 0.10 and 41.3% for the crisis period; and 0.23 and 41.7% for the post-crisis period, respectively.
According to standard deviation of GR, we have less between variation from one country to the next than within variation for all the sub-periods, which means the variation of countries over years. According to standard deviation of TR, things change and we have more between variation from one country to the next than within variation for all the sub-periods.
4. Methodology
This paper uses a panel VAR approach for several reasons. First, panel data consists of both “time series” and “cross-section” dimensions. Thus, we have considerable observation derived from both “time series” and “cross-section” dimensions, which increases degree of freedom and certifies estimation of a more robust model (Baltagi, 1995). Second, the panel VAR model allows us to investigate the endogenous interaction between corporate tax rate and economic growth. In other words, the VAR approach takes into account the fact that TR can have an impact on the GR and, at the same time, TR can be influenced by GR. Moreover, the panel VAR analysis based on the system GMM approach allows us to elaborately analyze a small sample, the omitted variables, and endogeneity problems. Third, panel Granger causality analysis based on the panel VAR methodology helps us identify the direction of the relationship between TR and GR. Finally, Impulse Response Functions (IRFs) allow us to assess the dynamic associations between TR and GR.
The model is as follows:
𝐺𝑅 𝛽 𝛽, 𝐺𝑅 𝛽 , 𝑇𝑅 𝑒 𝑢
[1]
𝑇𝑅 𝛼 𝛼 , 𝑇𝑅 𝛼 , 𝐺𝑅 µ 𝓋
[2]
Here, i (1,…N) denotes the countries, t (1,…,T) denotes the time period, and z denotes the lag number. 𝑢 and 𝓋 are white noise errors. 𝑒 and µ are individual fixed effects for the panel member. GRi,t denotes economic growth rate in different countries, while TRi,t denotes corporate
tax rates.
197
𝐻 , 𝛽 , 𝛽 , ⋯ 𝛽 , 0
On the other hand, we test whether the GR is Granger cause for TR and the corresponding null hypothesis (𝐻, is:
𝐻 , 𝛼 , 𝛼 , ⋯ 𝛼 , 0
where TRi,t and GRi,t are the observations of two stationary variables for the countries in period t.
If H0,1 is rejected, it indicates that causality from TR to GR exists. It can be tested for
causality in the other direction as well, and it is possible to detect the existence of causality for testing H0,2. If H0,2 is rejected, one can conclude that causality from GR to TR exists.
The correct choice of lag length is important to avoid non-trustable results on Granger-causality. Thus, this paper uses Schwartz Information Criteria (SIC) for determining optimal lag. According to SIC, we select a lag length of two as optimal.
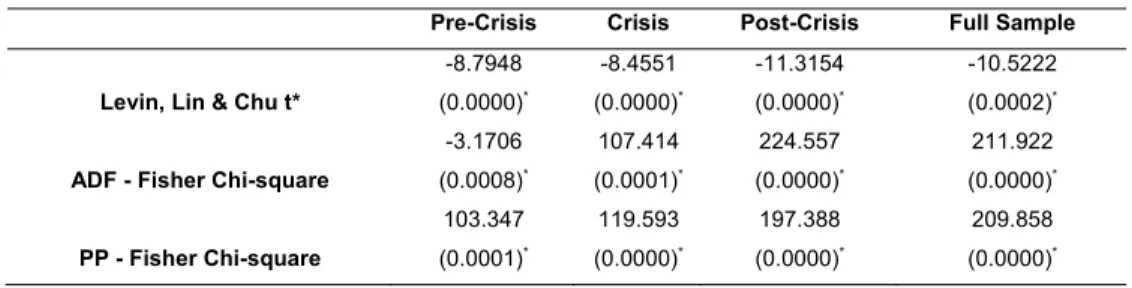
Because the priority requirement as stationary is necessary for implementing the Granger-causality tests, a panel unit root tests are applied for both GR and TR variables in the all the sub-periods as pre-crisis, crisis and post-crisis. The results are presented in Table 4a and 4b.
According to Table 4a and 4b, we reject the null hypothesis of non-stationarity for the all variables at levels for the full sample and all the related sub-samples.
Table 4a: Panel Unit Root Test for GR
* represents a significance level of 0.05.
Table 4b: Panel Unit Root Test for TR
Pre-Crisis Crisis Post-Crisis Full Sample
198
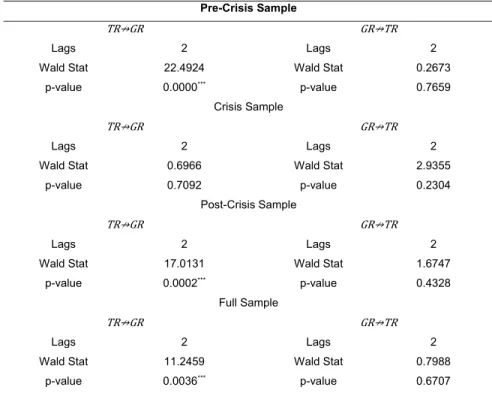
Table 5: Granger Causality Test Results (𝐓𝐑 ↛ 𝐆𝐑 : Pre-Crisis, Crisis, Post Crisis and Full Sample Period
Pre-Crisis Sample
TR↛GR GR↛TR
Lags 2 Lags 2
Wald Stat 22.4924 Wald Stat 0.2673
p-value 0.0000*** p-value 0.7659
Crisis Sample
TR↛GR GR↛TR
Lags 2 Lags 2
Wald Stat 0.6966 Wald Stat 2.9355
p-value 0.7092 p-value 0.2304
Post-Crisis Sample
TR↛GR GR↛TR
Lags 2 Lags 2
Wald Stat 17.0131 Wald Stat 1.6747
p-value 0.0002*** p-value 0.4328
Full Sample
TR↛GR GR↛TR
Lags 2 Lags 2
Wald Stat 11.2459 Wald Stat 0.7988
p-value 0.0036*** p-value 0.6707
* represents a significance level of 0.05.
Table 5 displays the results from the panel Granger causality tests for both the full sample and all the sub-sample periods. The null hypothesis that corporate tax rate does not Granger-cause economic growth is rejected at the 5 percent level of significance for the full sample period. However, for the sub-sample periods, the results of Granger causality tests are very different from those for the full sample period. For instance, for the non-crisis period (both pre-crisis and post-pre-crisis), the null hypothesis is rejected at the 5 percent level of significance as in the case with the full sample period indicating the existence of Granger causality from TR to GR. However, the results dramatically change for the crisis period. Interestingly, the null hypothesis is not rejected for the crisis period, which suggests that there is not any significant evidence of causality between TR and GR during the crisis period.
The results fail to reject the null hypothesis that GR does not Granger-cause TR at the 5 percent level of significance for both the full sample and all the sub-sample periods. The results show that there is no evidence of causality from GR to TR.
As a result, we only capture one-way Granger causality from TR to GR during the non-crisis period (both for the pre-crisis and post-crisis periods).
199
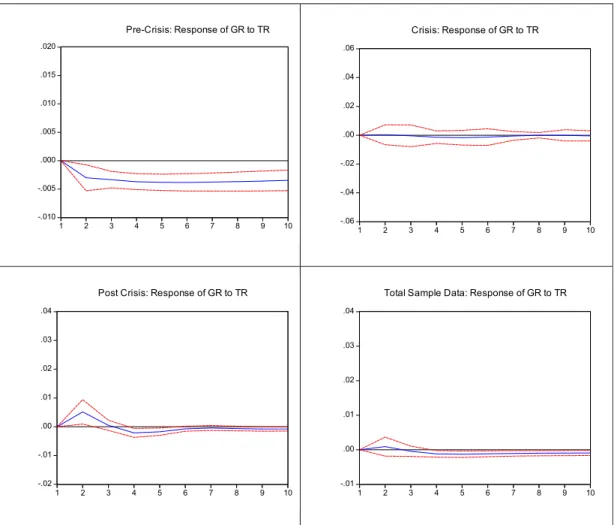
Figure 1. Impulse Response Functions of GR and TR: Pre-Crisis, Crisis, Post Crisis and Full Sample Period.
According to Figure 1, a shock to corporate tax rate decreases the economic growth during non-crisis period. Interestingly economic growth does not response a shock in corporate tax rate during the crisis period. It is clear that the impulse responses functions for crisis period are very different from those in the pre-crisis, post-crisis and full sample periods, which suggests that the recent crisis has profoundly affected the endogenous interaction between corporate tax rate and economic growth.
5. Conclusions
In terms of fiscal policy, it is important that taxes should positively affect economic growth. However, corporate tax has direct impacts on investment decisions, capital structures and earnings of corporations. Depending on the extent of taxation of corporate earnings, the entrepreneurs may give up their investment decisions and reduce their existing investments. On the other hand, a low corporate tax rate can generate both a higher rate of capital investment and a more entrepreneurial activity, which will directly affect economic growth.
-.010
200
It is essential that policy-makers detect optimal tax rate so as to meet the expectations of both governments and entrepreneurs. In other words, the tax rate adopted by policy-makers should ensure both economic growth for the government and sustainability of investments for entrepreneurs.
The primary aim of this paper is to investigate the relationship between corporate tax rate and economic growth. On the other hand, this paper also tests whether the recent financial crisis has any significant effect on the dynamic relationship between economic growth and corporate tax rate by using panel VAR for 29 OECD countries over the period 1998-2016. The results show that corporate tax rates have a significantly negative effect on economic growth. Moreover, the recent financial crisis has had a significant effect on the endogenous interaction between corporate tax rate and economic growth. According to Granger causality test, there is only one-way causality from corporate tax rate to economic growth during the non-crisis period. Interestingly, there is not any causal relationship between corporate tax rate and economic growth during the crisis period.
The public policy should focus more on corporate tax deduction to increase the economic growth during non-crisis period. Interestingly corporate tax rate is not significant policy tool to increase economic growth during the crisis period.
Future studies may contribute to the literature describing the relationship between tax rates and economic growth by focusing on the impact of different tax rates, on different characteristics of crises or on the impact of econometric methods on these relationships.
References
Adkisson, R. V. & Mohammed, M. (2014). Tax Structure and State Economic Growth during the
Great Recession. The Social Science Journal, 21, 79-89. Doi:
https://doi.org/10.1016/j.soscij.2013.10.009
Arnold, J.M., Brys, A., Heady, C., Johansson, A., Schwellnus, C. & Vartia, L. (2011). Tax Policy for Economic Recovery and Growth. The Economic Journal, 121, 59-80. Doi:
https://doi.org/10.1111/j.1468-0297.2010.02415.x
Atems, B. (2015). Another Look at Tax Policy and State Economic Growth: The Long-run and
Short-run of It. Economics Letters, 127, 64-67. Doi:
https://doi.org/10.1016/j.econlet.2014.12.035
Baltagi, B.H. (1995). Econometric Analysis of Panel Data. Wiley: Chichester.
Benassy-Quere, A., Fontagne, L. & Lahreche-Revil, A. (2005). How Does FDI React to Corporate Taxation? International Tax and Public Finance, 12 583–603. Doi:
https://doi.org/10.1007/s10797-005-2652-4
Dackehag, M. & Hansson, A. (2012). Taxation of Income and Economic Growth: An Empirical Analysis of 25 Rich OECD Countries. Lund University, Department of Economics, Working Paper 2012:6.
De Mooij, R.A. & Ederveen, S. (2005). Explaining the Variation in Empirical Estimates of Tax Elasticities of Foreign Direct Investment. Tinbergen Institute Discussion Paper, No. 2005-108/3. Doi: https://doi.org/10.2139/ssrn.869753
De Mooij, R.A. & Ederveen, S. (2006). What a Difference Does it Make? Understanding the Empirical Literature on Taxation and International Capital Flows. European Commission Economic Paper No. 261.
201
Corporate Taxes on Investment and Entrepreneurship. American Economic Journal Macroeconomics, 2(3), 31-64. Doi: https://doi.org/10.1257/mac.2.3.31
Desai, M.A., Foley, C.F. & Hines Jr., J.R. (2004). Foreign Direct Investment in a World of
Multiple Taxes. Journal of Public Economics, 88, 2727-2744. Doi:
https://doi.org/10.1016/j.jpubeco.2003.08.004
Dungey, M. (2009). The Tsunami: Measures of Contagion in the 2007-08 Credit Crunch, CESifo Forum, 9(4), 33-34.
Dungey, M. & Gajurel, D. (2014). Equity Market Contagion during the Global Financial Crisis: Evidence from the World's Eight Largest Economies. Economic Systems, 38(2), 161-177.
Doi: https://doi.org/10.1016/j.ecosys.2013.10.003
Easterly, W. & Rebelo, S. (1993). Fiscal Policy and Economic Growth. Journal of Monetary
Economics, 32, 417-458. Doi: https://doi.org/10.1016/0304-3932(93)90025-B
Engen, E. & Skinner, J. (1996). Taxation and Economic Growth. National Tax Journal, 49(4),
617-642. Doi: https://doi.org/10.3386/w5826
Favero, C.A. & Giavazzi, F. (2002). Is the International Propagation of Financial Shocks Non-linear? Evidence from the ERM. Journal of International Economics, 57(1), 231-246. Doi:
https://doi.org/10.1016/S0022-1996(01)00139-8
Gober, J. R. & Burn, J. O. (1997). The Relationship between Tax Structures and Economic Indicators. Journal of International Accounting, Auditing and Taxation, 6(1), 1-24. Doi:
https://doi.org/10.1016/S1061-9518(97)90010-0
Harberger, A. C. (1964). Taxation, Resource Allocation, and Welfare. In NBER and the Brookings Institution (eds.), The Role of Direct and Indirect Taxes in the Federal Revenue
System. New Jersey: Princeton University Press. Doi:
https://doi.org/10.1515/9781400875931-003
Helms, L. J. (1985). The Effect of State and Local Taxes on Economic Growth: A Time Series-Cross Section Approach. The Review of Economics and Statistics, 67(4), 574-582. Doi:
https://doi.org/10.2307/1924801
Hindricks, Jean & Myles, Gareth D. (2006). Intermediate Public Economics, The MIT Press.
King, R. G. & Rebelo, S. (1990). Public Policy and Economic Growth: Developing Neoclassical
Implications. Journal of Political Economy, 98(5), 126-150. Doi:
https://doi.org/10.1086/261727
Koch, S. F., Schoeman, N. J. & Van Tonder, J. J. (2005). Economic Growth and the Structure of Taxes in South Africa: 1960-2002. South African Journal of Economics, 73(2), 190-210. Doi:
https://doi.org/10.1111/j.1813-6982.2005.00013.x
Lee, Y. & Gordon, R. H. (2005). Tax Structure and Economic Growth. Journal of Public Economics, 89, 1027-1043. Doi: https://doi.org/10.1016/j.jpubeco.2004.07.002
Lowell, J., Neu, C.R., & Tong, D. (1998). Financial Crisis and Contagion in Emerging Market
Countries. Monograph RAND.
Mendoza, E. G., Milesi-Ferretti, G. M & Asea, P. (1997). On the Ineffectiveness of Tax Policy in Altering Long-Run Growth: Harberger’s Superneutrality Conjecture. Journal of Public
Economics, 66, 99-126. Doi: https://doi.org/10.1016/S0047-2727(97)00011-X
NBER. (2010). Business cycle dating committee report. Technical report, National Bureau of
Economic Research (2010).
Ojede, A. & Yamarik, S. (2012). Tax Policy and State Economic Growth: The Long-run and
Short-run of It. Economics Letters, 116, 161-165. Doi:
https://doi.org/10.1016/j.econlet.2012.02.023
Pecorino, P. (1994). The Growth Rate Effects of Tax Reform. Oxford Economic Papers, 46(3),
492-501. Doi: https://doi.org/10.1093/oxfordjournals.oep.a042143
Pecorino, P. (1995). Tax Rates and Tax Revenues in a Model of Growth through Human Capital
Accumulation. Journal of Monetary Economics, 36, 527-539. Doi:
https://doi.org/10.1016/0304-3932(95)01224-9
Pesendorfer, K. (2008). Tax and Economic Growth in Austria. Monetary Policy and the
Economy, Quarter 3, 21-40.
Rebelo, S. (1991). Long-Run Policy Analysis and Long-Run Growth. The Journal of Political Economy, 99(3), 500-521. Doi: https://doi.org/10.1086/261764
202
94(5), 1002-1037. Doi: https://doi.org/10.1086/261420
Salanie, B. (2003). The Economics of Taxation. The MIT Press.
Slemrod, J. B. (1990). Tax Effects on Foreign Direct Investment in the United States: Evidence from a Cross-Country Comparison. In Assaf Razin & Joel Slemrod (eds.) Taxation in the Global Economy (pp. 79-122). University of Chicago Press.
Solow, R. M. (1956). A Contribution to the Theory of Economic Growth. The Quarterly Journal of Economics, 70(1), 65-94. Doi: https://doi.org/10.2307/1884513
Stoilova, D. (2017). Tax Structure and Economic Growth: Evidence from the European Union.
Contaduría y Administración, 62(3), 1041-1057. Doi:
https://doi.org/10.1016/j.cya.2017.04.006
Stokey, N. L. & Rebelo, S. (1995). Growth Effects of Flat-Rate Taxes. Journal of Political Economy, 103(3), 519-550. Doi: https://doi.org/10.1086/261993
Trostel, P. A. (1993). The Effect of Taxation on Human Capital. Journal of Political Economy, 101(2), 327-350. Doi: https://doi.org/10.1086/261878
Wang, P. & Yip, C. K. (1992). Taxation and Economic Growth: The Case of Taiwan. The
American Journal of Economics and Sociology, 51(3), 317-331. Doi:
https://doi.org/10.1111/j.1536-7150.1992.tb03483.x
Wildmalm, F. (2001). Tax Structure and Growth: Are Some Taxes Better than Others? Public
Choice, 107(3/4), 199-219. Doi: https://doi.org/10.1023/A:1010340017288
Yalama, A. (2012). International Financial Contagion: The Role of the UK, Bogazici Journal,
Review of Social, Economic and Administrative Studies, 26(2), 115-129. Doi: